The Influence of Noise to the Hedge Effectiveness
Juping Wu
3and Ren-Jean Liou
4ABSTRACTS
Future market provides an important tool for hedging. Previous studies on hedge ratio estimation have been focused on original transaction price. Nevertheless, transaction price includes both true information and noise. The markets for spot and future contain different kinds of noise. This paper proposes consideration of the effect of noise in original prices. Noise were both included and excluded in the computations of hedge ratio using OLS, ECM, and GARCH models. The approaches were verified in four largest futures products in Taiwan Stock Exchange. The results show that, after the removal of noise, the correlation between spot and future markets is increased. The estimated hedge ratio is thus higher. In regarding to the hedge effectiveness, using traditional transaction price to estimate the hedge ration has better performance in 2008 as there were high market fluctuation. Removing the noise has better hedge ratio performance in the years of 2009 and 2010 when more market were more stable. This shows that noise do have significant influence on the strategy of hedging. Noise should be removed when the market is relatively stable. When the fluctuation is considerable, noise should be included in order to achieve better hedge effectiveness.
Keywords: Hedge effectiveness, Hedge ratio, Noise, GARCH
3 Assistant Professor, Department of Finance, Shu-Te University 4
壹、前言
貨持有部位的大小,並求算投資組合最小變異數之避險比率。 而本文著重於整體風險之降低,因此以 Johnson (1960)提出的投資組合報酬理 論,目標追求風險最小的避險策略,衡量各模型於不同訊息內涵下,估計之避險比率之避 險績效衡量比較,而非考量第二類之選擇性避險理論,且避險比率的決定是近代避險理論 中極為重要的一環,早期的避險研究大多專注於固定避險比率之避險模型,近年來由於各 種時間數列理論與模型的發展,使得估計避險比率的模型與方法日新月益,並偏向動態避 險比率之估計方式。 過去相關估計最適避險比率之實證方式,經常使用之模型為,OLS、ECM、及 GARCH 模型,相關文獻實證結果,首先整理國外部分,後續說明國內部分。首先 Finglewski (1984) 採用最小變異數策略,研究 S&P 500(Standard and Poor)股價指數期貨的避險效果,採 用 OLS 模式估算避險比率,避險的期間分為一天、一週、及四週等三種方式,實證結果 發現,S&P 500 股價指數期貨對 S&P500 現貨直接避險效果較好,也提出期貨交易者相對 於股票現貨交易者,能掌握的資訊資源更少,而在較佳之避險效果中,期貨的到期日不宜 超過二十日(四週)。而後 Ghosh (1993)以 S&P500、道瓊工業指數及 NYSE(New York Stock Exchange)複合指數之現貨與期貨為標的,以傳統的 OLS 模型及 ECM 對上述三個 研究標的做實證。其實證結果發現,加入誤差修正項的 ECM 比傳統 OLS 模型更能正確的 估計出最適避險比率,並且有效地改善傳統 OLS 模式的避險績效。Chou, Fan and Cheng (1996) 以香港及日本市場作為研究對象,估計簡單避險比例與交叉避險比例的不同, 並比較傳統 OLS 模型與 ECM 誤差修正模型的不同;在交叉避險比例估計上,不論避險時 間長短,交叉避險比率之績效均較低,大多數都呈現不顯著之效果,故交叉避險並沒有效 率,且在交叉避險模型中存在負的序列相關;不同模型比較方面,在香港市場中,傳統模 型所估計的短期及長期避險比例均有低估的現象;在日本市場中,ECM 模型用日資料與 一週資料所得出的短期避險比例有低估情形,但用二週以上的資料反有高估情形。實證結 果發現,在香港恆生指數及日本日經指數都顯示,以日資料所得到的避險比率遠低於用其 他資料形態所求出的避險比率;而避險比例小於 1,投資期間越長避險比率則越高。Park and Switzer (1995) 採用天真避險、傳統 OLS、ECM 及 GARCH 等避險模型,對 S & P 500、MMI(Major-market-index)及 Toronto 35 三種股價指數期貨為實證期貨商品。實證 結果發現,GARCH 模型的避險績效不論在樣本內或樣本外,均優於其他三種模型。Holmes (1996) 在採用風險極小化的策略下,運用傳統的 OLS 模式、 ECM 模型及 GARCH 模型三種經濟計量方法來估算避險比率,其探討的樣本為 FTSE-100 股價指數期貨,實 證結果發現,OLS 估計的避險比率避險效果,反而比其他複雜的 ECM 或 GARCH 等之計 量方法為佳。
GARCH 之避險模型比較其效果,以芝加哥商業交易所之 S&P 500 期貨契約、香港期貨交 易所之恆生股價指數期貨、新加坡國際貨幣交易所之日經股價指數期貨為實證對象。實證 結果發現,樣本內之避險效果,除日經股價指數期貨外,GARCH 模式之避險效果優於傳 統 OLS 模式;而樣本外之避險效果,GARCH 模式之避險效果皆優於傳統 OLS 模式。
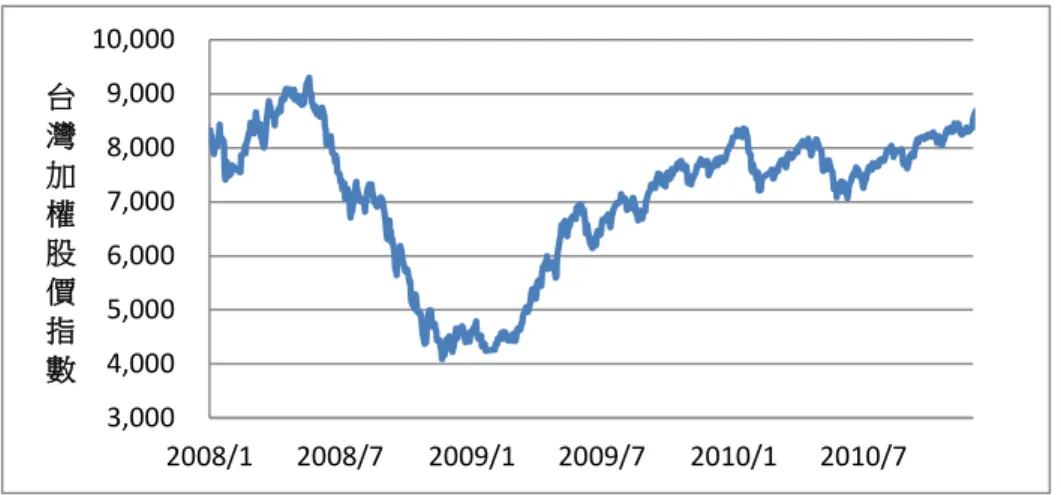
圖 1 台灣加權股價指數走勢
此兩者價格走勢具有高度相關性,而在 2008 前半年指數多在七千至九千點間盤整, 而在 2008 年底則指數大幅滑落至四千多點,呈現空頭走勢,2009 及 2010 年則緩慢回升 至八千點附近。根據 Engle and Granger(1987)的研究指出,時間數列如股票價格常呈現 不穩定的型態,然估計避險之計量模型中,須具備穩定數列方能進行相關分析,因此,根 據 Engle and Granger(1987)建議的 ADF (Augmented Dickey-Fuller)法檢視股價指數是
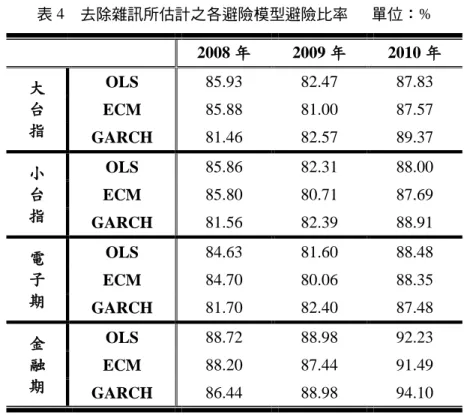
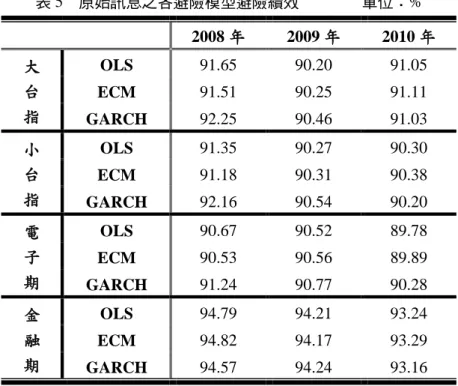
之避險績效較佳,原因或為 2008 年大幅下跌,波動較大,雜訊大幅干擾現貨及期貨之價 格波動,導致原始訊息之效果較佳,然在後續上漲且波動較小的 2009 至 2010 年,在去 除雜訊後,更能清楚解構期貨與現貨之長期趨勢及長期相關性,則避險績效較佳,綜合而 言,市場操作者,在進行相關金融商品避險考量時,應審慎考量雜訊會確實影響期貨市場 進行避險之績效,雜訊確實干擾避險策略之運作,在市場盤整上升期間,波動較低時,去 除雜訊後之訊息進行避險策略為佳,但在市場大幅波動及快速下降趨勢時,則應以傳統之 全含資訊進行避險策略。
參考文獻
1. 江文強,“股價指數期貨避險效果之研究”,交通大學管理科學研究所碩士論文,1997。 2. 溫曜誌,“以 SIMEX 摩根台股指數期貨規避台灣股價指數風險之研究”,政治大學財 務管理研究所碩士論文,1998。 3. 賴昌作,“股價指數期貨之避險比率與避險效益”,台灣科技大學資訊管理研究所碩士 論文,2000。 4. 叢宏文,“日經股價指數期貨避險效果之實證研究-GARCH模型之應用”,證券暨期貨 管理,1998,16卷,第7期:1-23。 5. 魏志良,“國際股價指數期貨與現貨直接避險策略之研究”,淡江大學金融研究所碩士 論文,2001。6. Abhyankar, A.H., “Return and Volatility Dynamics in the FT-SE 100 Stock Index and Stock Index Futures Markets”, Journal of Futures Markets. 1995, 15(4):457-488. 7. Black, F., “Noise”, Journal of Finance. 1986, 41(3): 529- 543.
8. Bollerslev, T., “Generalized Autoregressive Conditional Heteroskedasticity”, Journal of Econometrics. 1986, 31(3): 307-327.
9. Chan, K., K.C. Chan and A. Karolyi, “Intraday Volatility in the Stock Index and Stock Index Futures Markets” , Review of financial studies. 1991, 4(4): 657-684.
10. Chou, W.L., K.K. Fan and F.L. Cheng, “Hedging with the Nikkei Index Futures: Conventional Model versus the Error Correction Model”, The Quarterly Review of Economics and Finance. 1996, 36(4): 495-505.
11. Copeland, T. E. and D. Galai, “Information Effect on the Bid-Ask Spread”, The Journal of Finance. 1983, 38(5): 1457-1469.
Finance. 1979, 34(1): 157-170.
13. Engle, R.F., “Autoregressive Conditional Heteroskedasticity with Estimates of the Variance of United Kingdom Inflation”, Econometrica. 1982, 50(4): 987-1007.
14. Engle, R.F. and C.W.J. Granger, “Cointegration and Error Correction Representation, Estimation and Test”, Econometrica. 1987, 55(2): 251-273.
15. Fama, E.F. and K.R. French, “Permanent and Temporary Components of Stock Prices”, Journal of Political Economy. 1988, 96(2): 246-273.
16. Fama, E.F., “Efficient Capital Markets: A Review of Theory and Empirical Works”, Journal of Finance. 1970, 25: 383-417.
17. Finglewski, S., “Hedging Performance and Basis Risk in Stock Index Future”, Journal of Finance. 1984, 39(3): 657-669.
18. Ghosh, A., “Hedging with Stock Index Futures: Estimation and Forecasting with Error Correction Model”, Journal of Futures Markers. 1993, 13(7): 743-752.
19. Glosten, L.R., and L.E. Harris, “Estimating the Components of the Bid/Ask Spread”, Journal of Financial Economics. 1988, 21(1): 123-142.
20. Granger, C.W.J., “Some Properties of Time Series Data and their Use in Econometric Model Specification”, Journal of Econometrics. 1981, 16: 121-130.
21. Gray, R. w. and D. J. S. Rutledge, “The Economics of Commodity Futures Markets: A Survey”, Review of marketing and Agricultural Economics. 1971, 3(4): 57-108.
22. Hasbrouck, J., “Measuring the Information Contest of Stock Trades”, Journal of Finance. 1991, 46: 178-208.
23. Hill, J. and T. Schneeweis, “A Note on the Hedging Effectiveness of Foreign Currency Futures”, Journal of Future Markets. 1981, 1(4): 659-664.
24. Hiraki, T., E.D. Maberly, and Akezawa N.T., “The Information Content of End-of-the-Day Index Futures Returns: International Evidence form the Osaka Nikkei 225 Futures Contract”, Journal of Banking and Finance. 1995, 19: 921-936.
25. Holmes, p., “Stock Index Futures Hedging: Hedge Ratio Estimation Duration Effect, Expiration Effects and Hedge Ratio Stability”, Journal of Business Finance and Accounting. 1996, 23: 63-77.
26. Iihara, Y., K. Kato and T. Tokunaga, “Intraday Return Dynamics between the Cash and the Futures Markets in Japan”, Journal of Futures Markets. 1996, 16(2): 147-162. 27. Johnson, I.I., “The Theory of Hedging and Speculation in Commodity Futures”, Review of
28. Markowitz, H., “Portfolio Selection”, Journal of Finance. 1952, 7(1): 77-91.
29. Najand, M. and K. Yung,“Conditional Heteroskedasticity and the Weekend Effect in S and P 500 Index Futures ”, Journal of Business Finance and Accounting. 1994, 1(4): 603-612. 30. Neal, R. and S.M. Wheatley, “Adverse Selection and Bid-Ask Spreads: Evidence from
Closed-End Funds”, Journal of Financial Markets. 1998, 1(1): 121-149.
31. Park, T. H. and L. N. Switzer, “Bivariate GARCH Estimation of the Optimal Hedge Ratios for Stock Index Future: A Note”, Journal of Futures Markets. 1995, 15: 61-67.
32. Shefrin, H. and M. Statman, “Behavioral Capital Asset Pricing Theory”, Journal of Finance and Quantitative Analysis. 1994, 29(3): 323-349.
33. Shiller, R.J., “Fashions, Fad, and Bubbles in Financial Markets”, Oxford university press. 1988:56-61.
34. Working, H., “Futures Trading and Hedging”, American Economic Review. 1953, 43(3): 314-343.