CHAPTER III. METHODOLOGY
The methodology is developed to address the following questions: (1) what are the effects of age, gender, and organizational tenure on affective organizational commitment among vocational high school principals? (2) To what extent and in what manner organizational management such as pay satisfaction, perceived organizational support, perceived fairness and autonomy, and leadership style can predict affective organizational commitment among vocational high school principals? (3) To what extent and in what manner school status, location, type and size predict affective organizational commitment among vocational high school principals? Focused on these questions, the methodology employed in this study uses a survey questionnaire to collect the needed information, based on the following hypotheses posed in this study.
Research Framework
The framework of this study was articulated and constructed as regard to the
literature review conducted and the purposes presented in chapter one. The study is
confined to explore the predictors of affective organizational commitment of vocational
high schools principals’. Outcomes such as principals’job performance, job satisfaction
or attendance were not explored. To discover the hypothesized predictors, research
framework was presented as follow and schematized in Figure 3.1:
Figure 3.1 Framework of the study.
1-2 Age
1-3 Educational level 1.3.1 Highest degree
1.3.2 Highest training institution 1.3.3Major subject of highest degree
1-4 Organizational Tenure
1.4.1 Length/time in present position 1.4.2 Previous positions
1.4.3 Having teaching job
2- Organizational Management and Leadership Style
2-1 Organizational Management 2.1.1 Pay satisfaction
2.1.2 Perceived organizational support 2.1.3 Perceived fairness
2.1.4 Perceived autonomy
2.2 Leadership style 2.2 1 Autocratic 2.2 2 Participative 2.2.2 Delegative
3- School Setting Characteristics
3-1 School Status 3-2 School location 1-1 Gender
1- Personal Background Characteristics
Affective Organizational
Commitment Dependent Variable Independent Variables
Principals’
Performance Possible Outcomes
3-3 School type and size
The independent variables (predictors) are classified in three categories: (1) Personal Background Characteristics (gender, age, education, and organizational tenure) (2) Organizational Management (pay satisfaction, organizational support, perceived fairness, perceived autonomy) and leadership styles (autocratic, participative ant delegative), and (3) School Setting Characteristics (school status, location, type and size).
Research questions are organized in order to explore the relationship between the independent variables listed in the three categories and the dependent variable, affective organizational commitment. Frequencies, percentages, means and standard deviations are summarized and reported.
Research Hypotheses
This study aimed at determining the extent to which hypothesized predictors (independent variables) can predict affective organizational commitment of vocational high school principals in Taiwan. Below are listed the research hypotheses.
Hypothesis 1-1: Increased age leads to increased attachment of principals to the organization.
Hypothesis 1-2: Women tend to demonstrate lower organizational commitment than men
Hypothesis 1-3: A higher level of education shows lower organizational commitment.
Hypothesis 1-4: Increased organizational tenure leads to increased organizational commitment.
Hypothesis 2-1: The more satisfied a principal is with his or her pay, the higher his or
her organizational commitment.
Hypothesis 2-2: The more support a principal receives from his or her administration, the higher his or her organizational commitment.
Hypothesis 2-3: The more principal’s perceives fairness from his or her administration, the higher his or her organizational commitment.
Hypothesis 2-4: Higher feeling of autonomy displays stronger principal’s organizational commitment.
Hypothesis 2-5: A democratic (participative) leadership increases principal’s organizational commitment.
Hypothesis 3-1: Principals in the public schools are more committed to their organization than those of the private schools.
Hypothesis 3-2: Principals of schools located in big cities are more committed to their organization than principals of schools located in small cities.
Research Participants
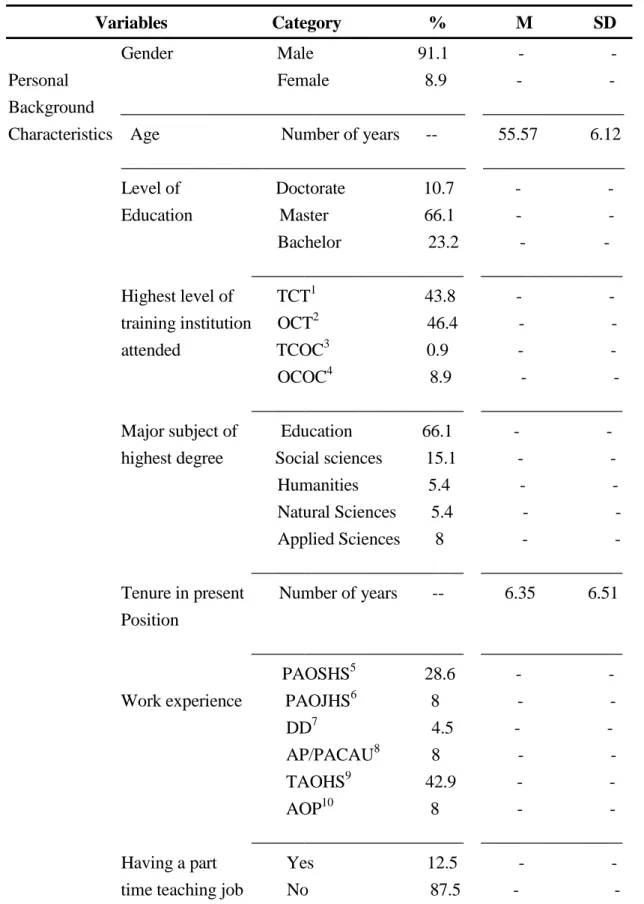
The population for this study was vocational high school principals who were included in the data bank of the Ministry of Education of Taiwan. All 157 vocational high school principals from public and private sectors were selected. Data were collected using a mailed questionnaire. A return rate of 72% had been registered after one month. Table 3.1 summarized the descriptive statistics of participants’profiles.
The majority of the participants were male (91.1%) and only 8.9% were females.
The respondents’ age was comprised between 37 and 67. The mean was 55.57 and
standard deviation 6.12. Respondents’ education Level shows that 10.7% had a
Doctoral Degree, 66.1% a Master Degree, and 23.2% had a Bachelor Degree. The
percentage of respondents who attended their highest level of training institution in
Teachers Colleges in Taiwan was 43.8. Those who attended their highest level of
training institution in other colleges in Taiwan were 46.4%. And only 0.9% attended a highest level of training institution in Teachers colleges in other country and finally, 8.9% of the respondents attended the highest training institution in other colleges in other countries.
From the total population, 66.1% major subject of highest degree was education, 15.1% social sciences, 5.4% humanities, 5.4% natural sciences and 8.0% applied sciences. The mean for the respondents’total years as a principal in their current school was 6.35 and the standard deviation 6.51. A percentage of 28.6 of the respondents have been served as a principal of any other senior high school; 8.0% of them as a principal in any other junior high school, 4.5% as a division director, 8.0% as an associate professorship or professorship in any college or university, 42.9% as teacher in any other high school and 8% of them occupied any other position before. Only 12.5% had had a part time teaching job and 87.5% of them had not had a part time teaching job.
A majority of principals in this study were from public school 66.96% and 33.04% from private vocational high schools. School location indicated that 8.9% of the principals in this study were from the Eastern district, 26.8% from the Central district, 25% from Northern district, 34.8% from the Southern district, and 4.5% from the Penghu, Kinmen & Matsu district. A great majority of them (73.2%) are leading typical vocational high schools, and 26.8% senior high schools offering vocational programs.
The mean and standard deviation for the number of teachers employed in each
school was M = 117.99; SD = 106.36. The mean and standard deviation of students
enrolled in each school were M = 2230.08; SD = 1619.87.
Table 3.1. Descriptive statistics of participants’profiles
Variables Category % M SD
Gender Male 91.1 - -
Personal Female 8.9 - -
Background _______________________________________ ________________
Characteristics Age Number of years -- 55.57 6.12
_______________________________________ ________________
Level of Doctorate 10.7 - -
Education Master 66.1 - -
Bachelor 23.2 - -
________________________ ________________
Highest level of TCT
143.8 - -
training institution OCT
246.4 - -
attended TCOC
30.9 - -
OCOC
48.9 - -
________________________ ________________
Major subject of Education 66.1 - -
highest degree Social sciences 15.1 - -
Humanities 5.4 - -
Natural Sciences 5.4 - -
Applied Sciences 8 - -
________________________ ________________
Tenure in present Number of years -- 6.35 6.51 Position
________________________ ________________
PAOSHS
528.6 - -
Work experience PAOJHS
68 - -
DD
74.5 - -
AP/PACAU
88 - -
TAOHS
942.9 - -
AOP
108 - -
________________________ ________________
Having a part Yes 12.5 - -
time teaching job No 87.5 - -
Table 3.1. (Continued)
Variables Category % M SD
School status Public 66.96 - -
School setting Private 33.04 - -
Characteristics _______________________________________ _________________
School location Eastern district 8.9 - -
Central district 26.8 - -
Northern district 25.0 - -
Southern district 34.8 - -
PKM district
114.5 - -
________________________ ________________
Kind of school TVHS
1273.2 - -
SHSOVP
1326.8 - -
_______________________ _________________
School size Teachers number 117.99 106.36
Students number 2230.08 1619.87
Notes: 1. TCT: teacher college in Taiwan; 2. OCT: other college in Taiwan; 3. TCOC: teacher college in other countries; 4. OCOC: other college in other countries; 5. PAOSHS: principal of any other senior high school; 6. PAOJHS: principal of any other junior high school; 7. DD: division director; 8. AP/PACAU:
associate professorship or professorship of any college or university; 9. TAOHS: teacher of any other high school; 10. AOP: any other position; 11. PKM district: Penghu, Kinmen, & Matsu district; 12.
TVHS: typical vocational high school; 13. SHSOVP: senior high school offering vocational program.
Research Instruments
The dependent variable, affective organizational commitment, was measured by a set of items developed by previous researchers and adapted to the current study. These items are designed to assess the relative strength of an individual’s identification with, involvement in and loyalty to a particular organization (Buffardi, Papazoglou &
Morrison, 2000). Typically the construct is characterized by a strong belief in and
acceptance of the organization’s goals, a willingness to exert considerable effort on
behalf of the organization.
Affective commitment
Affective commitment, the dependent variable in this study, was measured by the Affective commitment scale used by Hawkins (1998, p.44). This measurement system (7 items), was developed in the Part B of the research questionnaire (items 1 to 7). A sample questionnaire was ‘’I would be happy to spend the rest of my career with this school.” Respondents indicated their extent of agreement on a 7-point scale (7 = strongly agree, 1 = strongly disagree). The highest score indicated that the principal has a high level of organizational commitment.
Personal background characteristics
Personal Background characteristics such as age, gender, education, organizational tenure were measured. The Principals’ background characteristics questionnaire (9 items) developed by Hsu (1990) and retrieved from her Principal Questionnaire (p.130) was used for this measurement.
Organizational management
Organizational management Questionnaire contains pay satisfaction, perceived organizational support, perceived fairness, and perceived autonomy questionnaire. The details for each section are presented below.
Pay satisfaction was measured by four (4) items of “pay satisfaction questionnaire”
used by Kuo and Jen (2004). A sample item is ‘’ How satisfied are you with the school district pay structure?’’ Respondents indicated their extent of agreement on a 7-point scale (7 = strongly satisfied, 1 = strongly dissatisfied,). The highest score indicated that the principal has a high level of satisfaction with the organizational pay structure.
Perceived organizational support, perceived fairness and perceived autonomy were
measured by the questionnaire ‘’Predictors of affective organizational commitment
among high school principals’’ (Part B), used by Hawkins (1998) and from which we deleted two (2) items. This questionnaire contains 9 items (items 8 to 16) and had assessed the extent to which principals perceive the degree to which the organization values their contributions, cares about their well-being and the extent to which principals’ have autonomy in their job. A sample item is ‘’ The administration shows concern for the needs which I express regarding the school I work.’’ Respondents indicated their extent of agreement on a 7-point scale (7 = strongly agree, 1 = strongly disagree). The highest score indicated that the principal has a high level of perception of the organizational support, fairness or autonomy.
Leadership styles
Leadership style was measured by thirty (30) items of Leadership style questionnaire developed by Clark (2004). Respondents indicated their extent of agreement on a 5-point scale (5= Almost always true, 1 = Almost never true). The highest score indicated what leadership style principals normally use. The lowest scores indicated the style they least use (Clark, 2004).
School setting characteristics:
Organizational characteristics included school status, location, type and size.
Those items were measured by the School Setting characteristics questionnaire (5 items) developed by Hsu (1990) and retrieved from her Principal Questionnaire (p.130).
Data Collection Procedure
The questionnaire ‘’Predictors of affective organizational commitment of
high school principals. Those participants were selected from the list of the Ministry of Education’s website. A letter from the thesis advisor inviting the principals to participate to the study and complete the questionnaire within three days, have been sent with this questionnaire. Also, “a pre-addressed and postage paid envelop was provided for return convenience’’ (Lai, 1991, p.71). A month later (June 4th, 2006), 113 principals (72% of the 157 principals) had returned the questionnaire.
Data Analysis
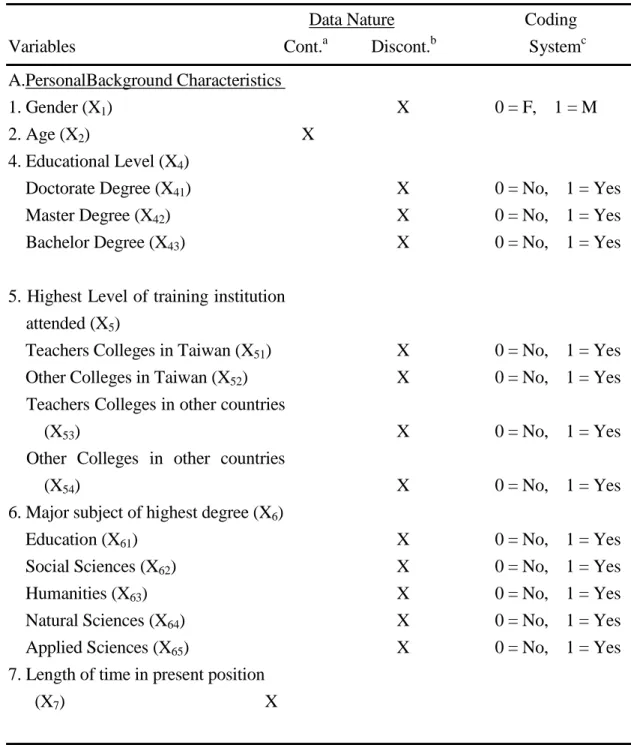
To analyze the objective data collected from the population, the following procedure was used: all the discontinuous data were coded using the dummy coding system (0 or 1) and to replace the missing data, the mean and the mode were used respectively for continuous and discontinuous data (Lai, 1991, p.74). Table 3-2 presents the summary of the data coding system for the study. After that, the computer Statistical Package for the Social Sciences (SPSS) was employed to do the descriptive and inferential statistical analyses.
Stepwise multiple regression analysis technique was used to analyze the data in order to determine the extent to which independent variables was useful in predicting affective commitment of vocational high school principals in this study (Lai, 1991, p.
84). ANOVA and Independent t-test were used to examine the correlations among and between groups. The total amount of variance explained in the regression equation was summarized.
Descriptive analysis
A. Personal Background Characteristics:
1. Gender (item 1) was coded (X
1). The analysis consists in determining the frequency and percentage of each gender. Afterwards, the dummy coding system is used in the regression analysis.
2. Age (item 2), was coded (X
2). Age is reported in number of years. The descriptive analysis of the respondents’ age includes the calculation of the mean and standard deviation. In addition, the frequency and percentage of the respondents’ ages respectively below and above average were counted (Lai, 1991, p.75).
3. Geographic origin (Item 3: deleted)
4. Educational Level (item 4), was coded (X
4); the analysis included determining the frequency and percentage of each educational level. Afterwards, the dummy coding of each level has been used in the regression analysis.
5. Highest Level of training institution attended (item 5) was coded (X
5); the analysis included determining the frequency and percentage of each training institution attended. Afterwards, the dummy coding of each level has been used in the regression analysis.
6. Major subject of highest degree (item 6) was coded (X
6); the analysis included determining the frequency and percentage of each educational subject. In addition, the dummy coding of each subject has been used in the regression analysis.
7. Length of time in present position (item 7) was coded (X
7); the analysis included determining the frequency and the percentage of the respondents’ total years as a principal in their current school. In addition, means and standard deviations of all responses were computed.
8. Previous position have been served (item 8) was coded (X
8); the analysis included
determining the frequency and percentage of respondents who respectively had and
had not occupied previous administrative or teaching position. The mean and
standard deviation of the length of time of all respondents’ previous position were computed.
9. Whether having a part time teaching job (item 9) was coded (X
9); this analysis included determining the frequency and percentage of respondents who respectively had and had not had a part time teaching job while being a principal. In addition, the dummy coding has been used in the regression analysis.
Table 3.2. Summary of the data coding system for this study
Data Nature Coding
Variables Cont.
aDiscont.
bSystem
cA.PersonalBackground Characteristics
1. Gender (X
1) X 0 = F, 1 = M
2. Age (X
2) X
4. Educational Level (X
4) Doctorate Degree (X
41) Master Degree (X
42) Bachelor Degree (X
43)
X X X
0 = No, 1 = Yes 0 = No, 1 = Yes 0 = No, 1 = Yes
5. Highest Level of training institution attended (X
5)
Teachers Colleges in Taiwan (X
51) Other Colleges in Taiwan (X
52) Teachers Colleges in other countries
(X
53)
Other Colleges in other countries (X
54)
X X
X
X
0 = No, 1 = Yes 0 = No, 1 = Yes
0 = No, 1 = Yes
0 = No, 1 = Yes 6. Major subject of highest degree (X
6)
Education (X
61) Social Sciences (X
62) Humanities (X
63) Natural Sciences (X
64) Applied Sciences (X
65)
7. Length of time in present position
(X
7) X
X X X X X
0 = No, 1 = Yes
0 = No, 1 = Yes
0 = No, 1 = Yes
0 = No, 1 = Yes
0 = No, 1 = Yes
Table 3.2. (Continued)
Data Nature Coding
Variables Cont.
aDiscont.
bSystem
c8. Previous position have been served (X
8)
Principalship of any other senior high school (X
81)
Principalship of any other junior high school (X
82)
Division directorship of any other city or county bureau of education (X
83)
Associate professorship or professorship in any college or university (X
84)
Teacher in any other high school (X
85)
Any other position (X
86)
X
X
X
X
X X
0 = No, 1 = Yes
0 = No, 1 = Yes
0 = No, 1 = Yes
0 = No, 1 = Yes
0 = No, 1 = Yes 0 = No, 1 = Yes 9. Whether having a part time teaching
job (X
9) X 0 = No, 1 = Yes
B. Organizational management and Leadership style
Pay satisfaction (Y
1)
X
Perceived organizational support, perceived fairness and perceived autonomy (Y
2,Y
3,Y
4) X
Perceived organizational support
(Y
2) X
Perceived fairness (Y
3) X Perceived autonomy (Y
4) X
Leadership style (Y
5) X
Participative Leader (Y
51) Affective commitment (Y)
X
X
Table 3.2. (Continued)
Data Nature Coding
Variables Cont.
aDiscont.
bSystem
cC. School setting characteristics 1. School status (Z
1)
Public (Z
11) Private (Z
12)
X X
0 = No, 1 = Yes 0 = No, 1 = Yes 2. School location (Z
2)
Eastern District (Z
21) Central District (Z
22) Northern District (Z
23) Southern District (Z
24)
The Penghu, Kinmen & Matsu District (Z
25)
X X X X
X
0 = No, 1 = Yes 0 = No, 1 = Yes 0 = No, 1 = Yes 0 = No, 1 = Yes
0 = No, 1 = Yes 3. School type (Z
3)
Typical vocational high school (Z
31)
Senior high school offering vocational program (Z
32)
X
X
0 = No, 1 = Yes
0 = No, 1 = Yes 4. School size (Z
4)
Number of full-time teachers for the semester (Z
41)
Student enrollment for the semester (Z
42)
X
X
0 = No, 1 = Yes
0 = No, 1 = Yes
Source: Lai, 1991.
Notes: a- continuous data; b- discontinuous data; c- data coding system