Temperature Prediction Based on Fuzzy Clustering and Fuzzy Rules
Interpolation Techniques
Yu-Chuan Chang1 and Shyi-Ming Chen1, 2
1Department of Computer Science and Information Engineering, National Taiwan University of Science and Technology, Taipei, Taiwan, R. O. C.
2Department of Computer Science and Information Engineering, Jinwen University of Science and Technology, Taipei County, Taiwan, R. O. C.
Abstract—In this paper, we present a new method to deal with temperature prediction based on fuzzy clustering and fuzzy rules interpolation techniques. First, the proposed method constructs fuzzy rules from training samples based on the fuzzy C-Means clustering algorithm, where each fuzzy rule corresponds to a cluster and the linguistic terms appearing in the fuzzy rules are represented by triangular fuzzy sets. Then, it performs fuzzy inference based on the multiple fuzzy rules interpolation scheme, where it calculates the weight of each fuzzy rule with respect to the input observation based on the defuzzified values of triangular fuzzy sets. Finally, it uses the weight of each fuzzy rule to calculate the forecasted output. We also apply the proposed method to handle the temperature prediction problem. The experimental result shows that the proposed method gets higher average forecasting accuracy rates than Chen and Hwang’s method [7].
Keywords—fuzzy rules, temperature prediction, fuzzy clustering, fuzzy rules interpolation
I. INTRODUCTION
Forecasting activities play an important role in our daily life, where there are many kinds of forecasting activities, such as stock market forecasting, earthquake forecasting, traffic flow forecasting, weather forecasting, economic growth rate forecasting, enrollments forecasting, etc. If we can make a forecast as precise as possible, we can prevent damages from the coming disasters, such as economic recession, company loss, traffic jam, storms, typhoons, etc. In [18], Zadeh presented the concepts of linguistic variables and fuzzy rules to approximate reasoning. In recent years, some forecasting methods have been presented based on fuzzy rules [2], [4], [5], [7], [10], [12], [13], [15].
However, fuzzy rule-based systems suffer from the problem of sparse fuzzy rule bases in which fuzzy rules incompletely cover the universe of discourse. Fuzzy rules in rule-based systems are usually limited to a few input variables, because a complete fuzzy rule base with K input variables and T fuzzy linguistic terms in each input variable needs TK fuzzy rules, where the complexity of the rule base is exponentially increasing with the number of input variables. In order to increase the efficiency of fuzzy rule-based systems with multiple variables, it is necessary to reduce bigger fuzzy rule bases into smaller fuzzy rule bases while keeping the essential fuzzy rules in the rule bases. However, reducing fuzzy rule bases will cause sparse fuzzy rule bases which contain blank
areas uncovered by fuzzy rules in the universe of discourse while conventional fuzzy inference methods only can handle complete fuzzy rule bases [14]. In recent years, some fuzzy rules interpolation methods [6], [8], [11], [16], [17] have been presented to handle inferences in sparse fuzzy rule bases for sparse fuzzy rule-based systems.
In this paper, we present a new method to deal with temperature prediction based on fuzzy clustering and fuzzy rules interpolation techniques. First, the proposed method constructs fuzzy rules from training samples based on the fuzzy C-Means clustering algorithm [1], where each fuzzy rule corresponds to a cluster and the linguistic terms appearing in the fuzzy rules are represented by triangular fuzzy sets. Then, it performs fuzzy inference based on the multiple fuzzy rules interpolation scheme [6], where it calculates the weight of each fuzzy rule with respect to the input observation based on the defuzzified values [9] of triangular fuzzy sets and uses the weight of each fuzzy rule to calculate the forecasted output. We also apply the proposed method to handle the temperature prediction problem. The experimental result shows that the proposed method gets higher average forecasting accuracy rates than Chen and Hwang’s method [7].
II. PRELIMINARIES A. Fuzzy C-Means Clustering Algorithm [1]
The fuzzy C-Means (FCM) clustering algorithm [1] is a widely used fuzzy clustering method in pattern recognition, which allows each data belonging to two or more clusters. The FCM clustering algorithm partitions data points Xj (j = 1, 2,
…, n) into clusters Ci (i = 1, 2, …, c) based on the minimization of the following objective function [1]:
,
1 1
¦¦ 2
= = −
= c
i n
j
j i m ij
m u V X
J (1) where
j
i X
V − is the Euclidean distance between data point Xj and the cluster center Vi (i = 1, 2, …, c), uij is the membership grade of Xj belonging to cluster Ci, m is a fuzziness index [1], m≥ 1, n is the number of data points, and c is the number of clusters. The procedures of the FCM clustering algorithm are reviewed from [1] as follows:
Step 1: Randomize the membership grade uij, where 0 ≤ uij≤
1, 1
1
¦ =
= c
i
uij , 1 ≤ i ≤ c and 1 ≤ j ≤ n.
Proceedings of the 2009 IEEE International Conference on Systems, Man, and Cybernetics San Antonio, TX, USA - October 2009
Step 2: Calculate the cluster center Vi of cluster Ci,
, ) (
) (
1 1
¦
¦
=
= ×
= n
j m ij n
j
j m ij
i
u X u
V (2)
where 1 ≤ i ≤ c.
Step 3: Update the membership grade uij of Xj belonging to Ci, where
1 ,
1 2
1
−
¦= ¸¸
¹
·
¨¨
©
§
−
−
=
c m
d d j
j i ij
X V
X V
u (3)
1≤ i ≤ c and 1 ≤ j ≤ n.
Step 4: Repeat Step 2 and Step 3 until the value of Jm in Eq.
(1) is no longer decreasing.
B. The Multiple Fuzzy Rules Interpolation Scheme [6]
A triangular fuzzy set A can be represented by three characteristic points (a, b, c), as shown in Fig. 1, where b is called “the center point” whose membership value in A is equal to 1, and a and c are called “the left point” and “the right point”, respectively, whose membership values in A are equal to 0, respectively. The defuzzified value DEF(A) of the triangular fuzzy set A shown in Figure 1 is calculated as follows [9]:
4 ) 2 (
DEF a b c
A = + × + . (4)
Figure 1. A triangular fuzzy set A.
Let us consider the multiple fuzzy rules interpolation scheme, which is shown as follows:
Rule 1: If x1 = A11 and x2 = A21 and … and xk = Ah1Then y = B1
Rule 2: If x1 = A12 and x2 = A22 and … and xk = Ah2Then y = B2
Rule p: If x1 = A1p and x2 = A2p and … and xk = AhpThen y = Bp Observations: x1 = A1
* and x2 = A2
* and … and xh = Ah* Conclusion: y = B*
where Rule i (i = 1, 2, .., p) is the ith fuzzy rule in the sparse fuzzy rule base, xk denotes the kth antecedent variable (k = 1, 2, …, h), y denotes the consequence variable, Aki denotes the kth antecedent fuzzy set of Rule i, Bi denotes the consequence fuzzy set of Rule i, Ak* denotes the kth observation fuzzy set for the kth antecedent variable xk, and B* denotes the interpolated consequence fuzzy set. Figure 2 shows an example of the multiple fuzzy rules interpolation scheme with two antecedent variables using triangular fuzzy sets.
Figure 2. Multiple fuzzy rules interpolation scheme with two fuzzy rules using triangular fuzzy sets.
III. THE PROPOSED METHOD FOR HANDLING FORECASTING PROBLEMS BASED ON FUZZY CLUSTERING AND FUZZY RULES
INTERPOLATION TECHNIQUES
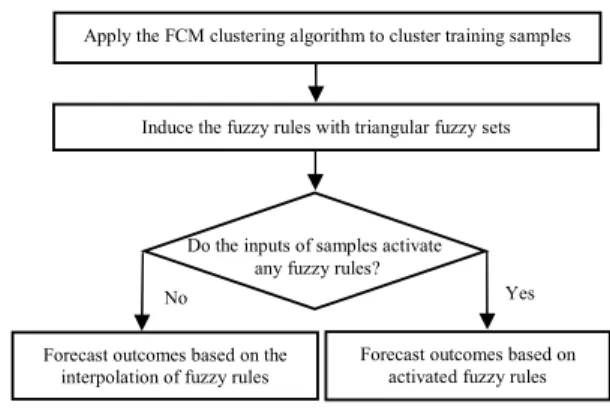
In this section, we present a new method to handle forecasting problems based on fuzzy clustering and fuzzy rules interpolation techniques. The flowchart of the proposed algorithm is shown in Figure 3.
Figure 3. The flowchart of the proposed algorithm.
Assume that there is a forecasting dataset having n training samples X1, X2, …, and Xn, where the jth sample Xj is represented by (I(j1),I(j2), …, I(hj), Oj), I(kj ) is the kth input of Xj, 1≤ k ≤ h, and Oj is the desired output of Xj. Let c denote the number of clusters. The proposed algorithm to construct fuzzy rules from training samples is now presented as follows:
Step 1: Apply the FCM clustering algorithm [1] to update the cluster center Vi of cluster i and the membership grade uij of sample Xj belonging to cluster Ci based on Eq. (2) and Eq. (3), respectively, until the objective function Jm in Eq. (1) is no longer decreasing, where 1 ≤ i ≤ c, 1 ≤ j ≤ n, and the fuzziness index m = 2.
Step 2: Based on the clusters C1, C2, … and Cc obtained in Step 1, construct fuzzy rules Rule 1, Rule 2, …, and Rule c using triangular fuzzy sets, where Rule i corresponds to cluster Ci, shown as follows:
Rule i:If x1 is A1i and x2 is A2i and … and xh is Ahi Then y is Bi, where xk is the kth antecedent variable (k = 1, 2, …, h), Aki is the kth antecedent fuzzy set of Rule i, y is the consequence variable, Bi is the consequence fuzzy set of Rule i; the center
Apply the FCM clustering algorithm to cluster training samples
Induce the fuzzy rules with triangular fuzzy sets
Yes Do the inputs of samples activate
any fuzzy rules?
No
Forecast outcomes based on activated fuzzy rules Forecast outcomes based on the
interpolation of fuzzy rules
…
point bki, the left point aki and the right point cki of the triangular fuzzy set Aki of Rule i are calculated as follows:
, max where
,
1 )
(
n ij it j k
t
ki I u u
b = = ≤≤ (5)
,
and ..., , 2 , 1
and ..., , 2 , 1
) (
) ( ) (
¦
¦
≤
=
≤
=
×
=
ki k j
ki k j
b I n j
ij b I n j
k j ij
ki
u I u
a (6)
,
and ..., , 2 , 1
and ..., , 2 , 1
) (
) ( ) (
¦
¦
≥
=
≥
=
×
=
ki k j ki k j
b I n j
ij b I n j
k j ij
ki
u I u
c (7)
where bki is the center point having the membership value of 1 in Aki, aki and cki are the left point and the right point having the membership value of 0 in Aki, I(kj ) is the kth input of Xj, 1 ≤ k ≤ h and 1 ≤ i ≤ c; and similarly, the center point bi, the left point ai and the right point ci of the triangular fuzzy set Bi of Rule i are calculated as follows:
, max where
, it 1 jn ij t
i O u u
b = = ≤≤ (8)
,
and ..., , 2 , 1
and ..., , 2 , 1
¦
¦
≤
=
≤
=
×
=
i j
i j
b O n j
ij b O n j
j ij
i
u O u
a (9)
,
and ..., , 2 , 1
and ..., , 2 , 1
¦
¦
≥
=
≥
=
×
=
i j
i j
b O n j
ij b O n j
j ij
i
u O u
c (10)
where Oj is the desired output of Xj and 1 ≤ i ≤ c. Based on Eqs.
(6)-(11), we can obtain the triangular fuzzy sets of the fuzzy rules Rule 1, Rule 2, … and Rule c, shown as follows:
Rule 1: If x1 is A1i and x2 is A2i and … and xh is Ahi Then y is Bi, Rule 2: If x1 is A1i and x2 is A2i and … and xh is Ahi Then y is Bi,
Rule c: If x1 is A1i and x2 is A2i and … and xh is Ahi Then y is Bi. Step 3: If the inputs I(j1),I(j2), … and I(hj) of the jth sample Xj
activate some fuzzy rules, where min ( ( )) 0
1≤k≤hμAk,i Ijk > , ( ())
, k j
A I
i
μ k is the membership value of the input I( kj ) belonging to triangular fuzzy set Ak,i, 1 ≤ i ≤ p, and p denotes the number of activated fuzzy rules, then calculate the inferred output Oj*
as follows:
, ) ( min
) ( DEF ) ( min
1
) ( 1
1
) ( 1
, ,
¦
¦
= ≤≤
= ≤≤
∗ ×
= p
i
k j h A k p
i
i k
j h A k j
I B I
O
i k i k
μ
μ (11)
where DEF(Bi) denotes the defuzzified value of the consequence fuzzy set Bi of the activated fuzzy rule Rule i, and 1 ≤ i ≤ p. Otherwise, go to Step 4.
Step 4: Based on the fuzzy rules Rule 1, Rule 2, … and Rule c obtained in Step 2, we have the following multiple fuzzy rules interpolation scheme [6]:
Rule 1: If x1 = A11 and x2 = A21 and …and xh = Ah1Then y = B1
Rule 2: If x1 = A12 and x2 = A22 and …and xh = Ah2Then y = B2
Rule c: If x1 = A1c and x2 = A2c and …and xh = AhcThen y = Bc Observations: x1 = I(j1) and x2 = I(j2) and … and xh = I(hj) Conclusion: y = Oj*
where xk denotes the kth antecedent variable (k = 1, 2, …, h), y denotes the consequence variable, Ak,i denotes the kth antecedent fuzzy set of Rule i (i = 1, 2, …, c), Bi denotes the consequence fuzzy set of Rule i, I( kj) denotes the kth input (k = 1, 2, …, h) of the jth sample Xj, and Oj* denotes the inferred output with respect to the inputs I(j1), I(j2), …, and I(hj)of Xj. Calculate the weight Wi of Rule i (i = 1, 2, …, c) with respect to the input observations x1 = (1)
Ij and x2 = (2)
Ij and … and xh =
) (h
Ij , where
,
2 1
1
−
= ∗
∗
¸¸
¸
¹
·
¨¨
¨
©
§
¸¸
¹
·
¨¨
©
§
−
= ¦c −
d d
i
i r r
r
W r (12)
r* denotes the vector of the inputs (I(j1),I(j2), …, I(hj)), ri
denotes the vector of the defuzzified values of antecedent fuzzy sets of Rule i (DEF(A1,i), DEF(A2,i), …, DEF(Ah,i)) based on Eq. (4), 1 ≤ k ≤ h, 0 ≤ Wi≤ 1 and 1
1
¦ =
= c
i
Wi . Step 5: Calculate the inferred output Oj*, where
), ( DEF
1
i c
i i
j W B
O =¦ ×
=
∗ (13)
where DEF(Bi) is the defuzzified value of consequence fuzzy set Bi based on Eq. (4), 0 ≤ Wi≤ 1, and 1
1
¦ =
= c i
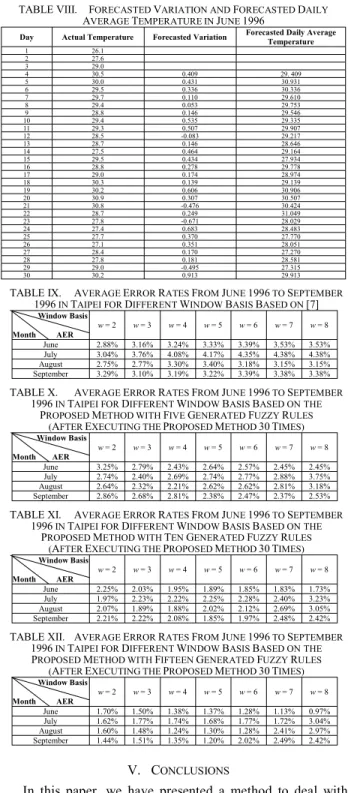
Wi . IV. EXPERIMENTAL RESULTS
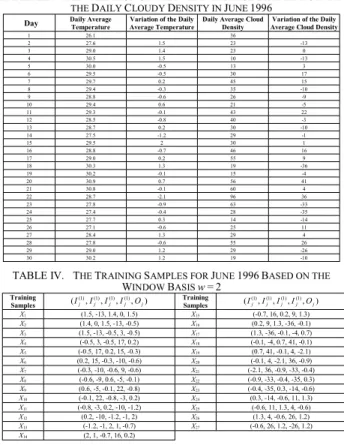
In this section, we apply the proposed method for temperature prediction based on the data set of the daily average temperature and the data set of the daily average cloud density from June 1996 to September 1996 in Taipei [3], as shown in Table I and Table II. If we want to forecast the daily average temperature of day i, then we use the proposed method to get the forecasted variation (i.e., the inferred output) of day i, and the forecasted daily average temperature of day i is equal to the daily average temperature of day i – 1 plus the forecasted variation of day i. We partition each data set into four groups, i.e., June 1996, July 1996, August 1996 and September 1996, and apply the proposed method to each group by using the variations of the daily average temperature and the daily average cloud density between any two adjacent days. Table III shows the variations of the daily average temperature and the daily average cloud density in June 1996, respectively. Let us consider a widow basis w using the historical data of the past w days to predict the forecasted data of the day being considered, where w is a positive integer. That is, the historical variations
… …
Ti-w, …, Ti-2 and Ti-1 of the daily average temperature and the historical variations Di-w, …, Di-2, Di-1 of the daily average cloud density are used to predict the variation Ti of the daily average temperature of day i, where Ti-w, …, Ti-2, Ti-1, Di-w, …, Di-2, Di-1 and Ti form a training sample (Ti-w, Di-w, …, Ti-2, Di-2, Ti-1, Di-1, Ti). Table IV shows the 27 training samples of June 1996 based on the window basis w = 2. For example, the historical variations T2 = 1.5 and T3 = 1.4 of the daily average temperature and the historical variations D2 = -13 and D3 = 0 of the daily average cloud density are used to predict the variation T4 = 1.5 of the daily average temperature of June 4, 1996, where T2, T3, D2, D3 and T4 form the training sample X1 = (1.5, -13, 1.4, 0, 1.5). In the following, we apply the proposed method to forecast the daily average temperature of June 1996, where the number of clusters is set to five.
TABLE I. THEHISTORICALDATA OF THEDAILYAVERAGE TEMPERATUREFROMJUNE1, 1996TOSEPTEMBER30, 1996
INTAIPEI, TAIWAN(UNIT: °C) [3]
Month
Day June July August September
1 26.1 29.9 27.1 27.5 2 27.6 28.4 28.9 26.8 3 29.0 29.2 28.9 26.4 4 30.5 29.4 29.3 27.5 5 30.0 29.9 28.8 26.6 6 29.5 29.6 28.7 28.2 7 29.7 30.1 29.0 29.2 8 29.4 29.3 28.2 29.0 9 28.8 28.1 27.0 30.3 10 29.4 28.9 28.3 29.9 11 29.3 28.4 28.9 29.9 12 28.5 29.6 28.1 30.5 13 28.7 27.8 29.9 30.2 14 27.5 29.1 27.6 30.3 15 29.5 27.7 26.8 29.5 16 28.8 28.1 27.6 28.3 17 29.0 28.7 27.9 28.6 18 30.3 29.9 29.0 28.1 19 30.2 30.8 29.2 28.4 20 30.9 31.6 29.8 28.3 21 30.8 31.4 29.6 26.4 22 28.7 31.3 29.3 25.7 23 27.8 31.3 28.0 25.0 24 27.4 31.3 28.3 27.0 25 27.7 28.9 28.6 25.8 26 27.1 28.0 28.7 26.4 27 28.4 28.6 29.0 25.6 28 27.8 28.0 27.7 24.2 29 29.0 29.3 26.2 23.3 30 30.2 27.9 26.0 23.5
31 26.9 27.7
TABLE II. THEHISTORICALDATA OF THEDAILYAVERAGECLOUD DENSITYFROMJUNE1, 1996TOSEPTEMBER30, 1996IN
TAIPEI, TAIWAN(UNIT: %) [3]
Month
Day June July August September
1 36 15 100 29
2 23 31 78 53
3 23 26 68 66
4 10 34 44 50
5 13 24 56 53
6 30 28 89 63
7 45 50 71 36
8 35 34 28 76
9 26 15 70 55
10 21 8 44 31
11 43 36 48 31
12 40 13 76 25
13 30 26 50 14
14 29 44 84 45
15 30 25 69 38
16 46 24 78 24
17 55 26 39 19
18 19 25 20 39
19 15 21 24 14
20 56 35 25 3
21 60 29 19 38
22 96 48 46 70
23 63 53 41 71
24 28 44 34 70
25 14 100 29 40
26 25 100 31 30
27 29 91 41 34
28 55 84 14 59
29 29 38 28 83
30 19 46 33 38
31 95 26
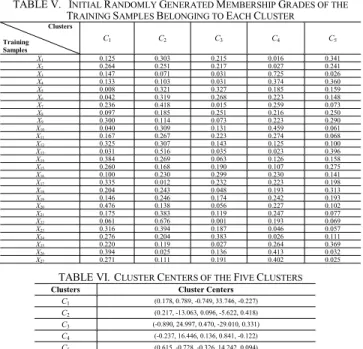
Given the initial randomly generated membership grades shown in Table V, the proposed method to forecast the daily average temperature for June, 1996 is presented as follows:
[Step 1] After applying the FCM clustering algorithm [1], we can get the five clusters, as shown in Table VI, where the membership grades of the training samples belonging to each cluster are shown in Table VII.
[Step 2] Based on Eqs. (5)-(10), we can get the following five fuzzy rules Rule 1, Rule 2, Rule 3, Rule 4 and Rule 5 from the training samples, where
Rule 1: If x1 is A11 and x2 is A21 and x3 is A31 and x4 is A41 Then y is B1, Rule 2: If x1 is A12 and x2 is A22 and x3 is A32 and x4 is A42 Then y is B2, Rule 3: If x1 is A13 and x2 is A23 and x3 is A33 and x4 is A43 Then y is B3, Rule 4: If x1 is A14 and x2 is A24 and x3 is A34 and x4 is A44 Then y is B4, Rule 5: If x1 is A15 and x2 is A25 and x3 is A35 and x4 is A45 Then y is B5, the antecedent fuzzy sets A11 = (-0.257, -0.1, 0.39), A21 = (-3.298, 4, 8.245), A31 = (-2.1, -2.1, -0.429) and A41 = (17.573, 36, 38.353), A12 = (-0.629, -0.3, 0.753), A22 = (-18.589, -10, -3.577), A32 = (-0.842, -0.6, 0.315), A42 = (-15.537, -9, -0.671), A13 = (-1.225, -0.6, -0.011), A23 = (9.253, 26, 31.664), A33 = (0.08, 1.2, 1.276), A43 = (-31.212, -26, -13.441), A14 = (-0.563, -0.1, 0.413), A24 = (8.094, 22, 28.972), A34 = (-0.841, -0.8, 0.222), A44 = (-11.465, -3, 5.737), A15 = (0.37, 2, 2), A25 = (-8.781, 1, 7.796), A35 = (-0.79, -0.7, -0.05) and A45 = (2.769, 16, 19.623) are calculated by Eqs. (5)-(7), respectively, and the consequence fuzzy sets B1 = (-1.032, -0.9, -0.058), B2 = (- 0.297, 0.6, 1.237), B3 = (0.03, 1.2, 1.22), B4 = (-0.553, 0.2, 0.737) and B5 = (-0.315, 0.2, 0.611) are calculated by Eqs. (8)- (10), respectively.
TABLE III. THEVARIATION OF THEDAILYAVERAGETEMPERATUE AND THEDAILYCLOUDYDENSITY INJUNE1996
Day Daily Average
Temperature
Variation of the Daily Average Temperature
Daily Average Cloud Density
Variation of the Daily Average Cloud Density
1 26.1 36
2 27.6 1.5 23 -13
3 29.0 1.4 23 0
4 30.5 1.5 10 -13
5 30.0 -0.5 13 3
6 29.5 -0.5 30 17
7 29.7 0.2 45 15
8 29.4 -0.3 35 -10
9 28.8 -0.6 26 -9
10 29.4 0.6 21 -5
11 29.3 -0.1 43 22
12 28.5 -0.8 40 -3
13 28.7 0.2 30 -10
14 27.5 -1.2 29 -1
15 29.5 2 30 1
16 28.8 -0.7 46 16
17 29.0 0.2 55 9
18 30.3 1.3 19 -36
19 30.2 -0.1 15 -4
20 30.9 0.7 56 41
21 30.8 -0.1 60 4
22 28.7 -2.1 96 36
23 27.8 -0.9 63 -33
24 27.4 -0.4 28 -35
25 27.7 0.3 14 -14
26 27.1 -0.6 25 11
27 28.4 1.3 29 4
28 27.8 -0.6 55 26
29 29.0 1.2 29 -26
30 30.2 1.2 19 -10
TABLE IV. THETRAININGSAMPLES FORJUNE1996 BASED ON THE WINDOWBASISw = 2
Training
Samples (I(j1),I(j1),I(j1),I(j1),Oj) Training
Samples (I(j1),I(j1),I(j1),I(j1),Oj) X1 (1.5, -13, 1.4, 0, 1.5) X15 (-0.7, 16, 0.2, 9, 1.3) X2 (1.4, 0, 1.5, -13, -0.5) X16 (0.2, 9, 1.3, -36, -0.1) X3 (1.5, -13, -0.5, 3, -0.5) X17 (1.3, -36, -0.1, -4, 0.7) X4 (-0.5, 3, -0.5, 17, 0.2) X18 (-0.1, -4, 0.7, 41, -0.1) X5 (-0.5, 17, 0.2, 15, -0.3) X19 (0.7, 41, -0.1, 4, -2.1) X6 (0.2, 15, -0.3, -10, -0.6) X20 (-0.1, 4, -2.1, 36, -0.9) X7 (-0.3, -10, -0.6, 9, -0.6) X21 (-2.1, 36, -0.9, -33, -0.4) X8 (-0.6, -9, 0.6, -5, -0.1) X22 (-0.9, -33, -0.4, -35, 0.3) X9 (0.6, -5, -0.1, 22, -0.8) X23 (-0.4, -35, 0.3, -14, -0.6) X10 (-0.1, 22, -0.8, -3, 0.2) X24 (0.3, -14, -0.6, 11, 1.3) X11 (-0.8, -3, 0.2, -10, -1.2) X25 (-0.6, 11, 1.3, 4, -0.6) X12 (0.2, -10, -1.2, -1, 2) X26 (1.3, 4, -0.6, 26, 1.2) X13 (-1.2, -1, 2, 1, -0.7) X27 (-0.6, 26, 1.2, -26, 1.2) X14 (2, 1, -0.7, 16, 0.2)
[Step 3] Let us consider to infer the output (i.e., the forecasted variation) with respect to the inputs of the training sample X1 shown in Table IV. That is, we want to forecast the daily average temperature of June 4, 1996. we can see that no fuzzy rules can be activated by the inputs I1(1), I1(2), I1(3) and I1(4) of X1 shown in Table IV, where X1 = (I1(1), I1(2), I1(3), I1(4), O1) = (1.5, -13, 1.4, 0, 1.5). Because min (1()) 0
4
1≤k≤μAk1Ik = for Rule 1, 0
) ( min 1()
4
1 2 =
≤
≤ k
k A I
μk for Rule 2, min (()) 0
4 1
1 3 =
≤
≤ k
k μAk I for Rule 3,