Does Variable Habitat Usage by the Japanese Eel Lead to Population
Genetic Differentiation?
Yu-San Han1,2,*, Yoshiyuki Iizuka3, and Wann-Nian Tzeng1,2
1Department of Life Science, College of Life Science, National Taiwan University, Taipei 106, Taiwan 2Institute of Fisheries Sciences, College of Life Science, National Taiwan University, Taipei 106, Taiwan 3Institute of Earth Sciences, Academia Sinica, Nangang, Taipei 115, Taiwan
(Accepted August 13, 2009)
Yu-San Han, Yoshiyuki Iizuka, and Wann-Nian Tzeng (2010) Does variable habitat usage by the Japanese
eel lead to population genetic differentiation? Zoological Studies 49(3): 392-397. Freshwater habitat use by
Japanese eels (Anguilla japonica) is facultative. However, the relationship between its habitat-use strategy and the population genetic structure is still unknown. To evaluate whether Japanese eel populations with different habitat-use behaviors display genetic differentiation, we examined the otolith Sr/Ca ratios by an electron probe microanalyzer of 166 wild Japanese eels collected from the Kaoping River of southwestern Taiwan in 2006-2007. Eel habitat use was divided into 3 types according to the mean and standard deviation (SD) of otolith Sr/Ca ratios: type 1 (fresh water, low-migratory, the SD of the Sr/Ca ratio < 1.4‰), type 2 (brackish water, low-migratory, the SD of the Sr/Ca ratio < 1.4‰), and type 3 (highly migratory, the SD of the Sr/Ca ratio > 1.4‰). No significant genetic differentiation was found among these 3 eel types (overall FST = 0.0007, p = 0.99). Our results suggest that the diverse habitat usage by Japanese eels is due to behavioral plasticity that allows the utilization of different ecological niches, rather than a heritable character that can cause genetic differentiation among populations. http://zoolstud.sinica.edu.tw/Journals/49.3/392.pdf
Key words: Japanese eel, Otolith Sr/Ca ratio, Population genetic differentiation, Microsatellite DNA.
*To whom correspondence and reprint requests should be addressed. Tel: 886-2-33663726. E-mail:yshan@ntu.edu.tw
E
volution of speciation (reproductive isolation between populations) is usually thought to involve the gradual accumulation of genetic differences between geographically isolated (allopatric) populations through selection or genetic drift, or in the absence of geographic isolation, between (sympatric) populations through polyploidization or nonrandom mating (Coyne and Orr 2004). Sympatric speciation requires that populations coexist ecologically during the evolution of reproductive isolation. Potential examples of sympatric speciation were found in plants, insects, fish, and birds (Coyne and Orr 2004, Friesen et al. 2007, Ryan et al. 2007). In teleost fish, the colonization of new environments allows rapid diversification to occur sympatricallyby adaptation to divergent selection regimes (Barluenga et al. 2006). Thus, a modification of any life history character could lead to reproductive isolation and population differentiation.
The Japanese eel, Anguilla japonica Temminck and Schlegel, is a temperate catadromous fish with a complex life cycle. The spawning ground of this species is in the western Mariana Is., near 14°-16°N, 142°E (Tsukamoto 1992 2006). The hatched leptocephalus larvae drift from the spawning grounds with the North Equatorial Current (NEC) and then the Kuroshio Current (KC) for 4-6 mo, to reach the coastlines of Northeast Asia (Cheng and Tzeng 1996); they then metamorphose into glass eels along the continental shelf and enter estuaries and rivers
for growth (Tesch 2003). In recent years, otolith strontium/calcium (Sr/Ca) ratio levels have been used to trace the salinity life history of eels (Tzeng et al. 1997, Tsukamoto et al. 1998, Han et al. 2003a). The Japanese eel should be regarded as a facultative catadromous fish that can grow up in fresh water, brackish water, and seawater, and can even migrate between fresh water and seawater (Tzeng et al. 1997 2002 2003, Tsukamoto et al. 1998, Tsukamoto and Arai 2001, Daverat et al. 2006). In estuarine habitats, changes in salinity are highly variable. Eels choose a preferred salinity microhabitat in which to grow (Han et al. 2003a). Low-migratory eels may stay in seawater, brackish water, or fresh water, whereas highly migratory eels may shift between fresh water and seawater. Although the migratory behavior of this eel species is well documented, the genetic nature behind that behavior and its potential connection to population genetic differentiation is poorly understood.
Recent studies using microsatellite DNA found no population-based genetic differentiation among intra- (Chang et al. 2007) or interannual recruits (Han et al. 2008) of the Japanese eel within the same habitat. However, those studies were done using glass eels in coastal waters, and those eels’ subsequent habitat choices may have diverged. Accordingly, if habitat choice behavior is a heritable trait, it might form reproductive barriers among populations with different life-history strategies, thus causing genetic differentiation among populations.
In this study, Japanese eel specimens were categorized into 3 types following a previous study (Han et al. 2009), based on habitat use characteristics determined from otolith strontium (Sr)/calcium (Ca) ratios. We examined the relationship between habitat use behavior by the Japanese eel and its population genetic structure using microsatellite markers.
MATERIALS AND METHODS
Sample collection, otolith preparation, and Sr/ Ca ratio analysis
Wild Japanese eels (n = 166), with 26 at the silver stage and 140 at the yellow stage, were collected from the Kaoping River estuary in southwestern Taiwan, from June 2006 to July 2007. Sampling locations and methods used for eel capture are described in detail by Han et
al. (2009). Only specimens longer than 35 cm, of a definitive gender, and with clear habitat use patterns were analyzed. The eels were transported live to the laboratory and sacrificed by decapitation for otolith collection, and a small piece of liver tissue was taken and stored at -80°C until the DNA was extracted. The gender of the eels was determined by morphology, as described by Han et al. (2003b).
The eels’ sagittal otoliths were used for the Sr/Ca ratio analysis. Specimens used and otolith preparations were described in detail by Han et al. (2009). Briefly, otoliths were dried in the air, embedded in Epofix resin, ground, and polished until the core was exposed. For electron probe microanalysis, the polished otoliths were coated with carbon under a high-vacuum evaporator. Using an electron probe microanalyzer (JEOL JXA-800M, Tokyo, Japan), Sr and Ca concentrations (wt%) in the otolith were measured from the primordium to the edge of the otolith at 10 μm intervals with a 5 μm diameter electron beam. The accelerating voltage was set to 15 kV and the probe current to 5 nA. Strontianite (SrCO3, USNM-R10065) and calcite
(CaCO3, USNM-36321) from the Department of
Mineral Sciences, National Museum of Natural History, Smithsonian Institution, Washington, DC, USA, were used as the standards to respectively calibrate the concentrations of Sr and Ca in eel otoliths.
DNA extraction, polymerase chain reaction (PCR), and genotyping
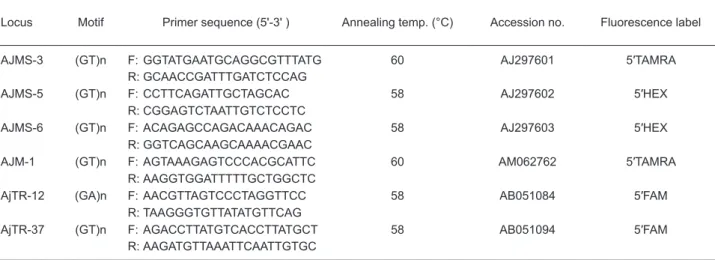
Genomic DNA was extracted from a small piece of liver tissue. Extraction was done using a commercial DNA extraction kit (Bioman Scientific, Taipei, Taiwan). The extracted genomic DNA was dissolved in 50 μl of elution buffer (10 mM Tris-HCl, pH 8.5) and stored at -20°C until the PCR amplification was performed. In total, 6 microsatellite loci were selected, including 5 (GT)n loci and 1 (GA)n locus (Table 1). These loci were selected from GenBank on account of their modest to high polymorphisms and ease of use. Microsatellite DNA was amplified via PCR, according to Chang et al. (2007). Reverse primers contained FAM, TAMRA, or HEX fluorescence labels (Table 1). For genotyping, 1 μl of the PCR product was diluted with 12 μl of Milli-Q H2O (Millipore, Taipei, Taiwan), and fragment
analysis was performed using a MegabaseTM 1000
Piscataway, NJ, USA). Data were scored using Genetic ProfilerTM, vers. 2.0 (Amersham
Biosciences), and the size of each allele was inspected visually.
Data analyses
The observed number of alleles (na), effective allele number (ne), observed (HO) and expected
(HE) heterozygosities, and deviations from
Hardy-Weinberg equilibrium (HWE) were independently calculated for each locus by Arlequin, vers. 3.1 (Schneider et al. 2000). The presence of allele dropouts and null alleles for each eel type was tested by Micro-Checker, vers. 2.2.3 (Van Oosterhout et al. 2004). Pairwise Wright’s fixation indices, FST (Weir and Cockerham 1984), were
calculated using GENEPOP, vers. 4.0 (Raymond and Rousset 1995), and the significance levels were adjusted with a sequential Bonferroni correction (Rice 1989). The statistical power was analyzed with the POWSIM program (Ryman and Palm 2006). This novel simulation method was applied to assess the statistical power for detecting population differentiation with the applied set of markers and sample sizes. The program detects significant differentiation (using Chi-squared and Fisher’s exact tests) under a specified level of population divergence given by 1 - (1 - 1/2Ne)t, where t is the time since divergence and Ne is the effective population size. Simulations were run to detect an expected divergence of FST = 0.005
between subpopulations, with 6 microsatellite loci from 39, 32, and 95 individuals. Ne/t combinations respectively corresponded to 500/5, 1000/10, and
2000/20.
RESULTS Otolith Sr/Ca ratio patterns
Otolith Sr/Ca ratios and microsatellite loci were analyzed in 166 Japanese eels (15 males and 151 females) (Table 2). The Sr/Ca ratios in Japanese eel otoliths before the glass eel stage, approximately 0-200 μm from the primordium, were similar among individuals, indicating that the migratory environmental histories were similar among individuals during the marine leptocephalus stage. However, otolith Sr/Ca ratios beyond the leptocephalus stage markedly varied and were classified into 3 types according to Han et al. (2009). Briefly, the migratory levels of Japanese eel were based on the standard deviation (SD) of the Sr/Ca ratio for each individual beyond 200 μm from the primordium to the otolith edge; this is because the more active the movement of the eel was between different salinities, the higher the SD value of the Sr/Ca ratio was (Han et al. 2009). A value of the SD of the Sr/Ca ratio of 1.4‰ was used as the boundary to discriminate low- (types 1 and 2, n = 71) and highly (type 3, n = 95) migratory eels. The low-migratory eel samples were subdivided into freshwater (type 1, n = 39) and brackish water (type 2, n = 32) types, based on the mean Sr/Ca ratio of 2.4‰ in the otolith beyond 200 μm from the primordium to the edge as the boundary (Han et al. 2009).
Table 1. Characteristics of the 6 analyzed microsatellite loci, including repeat motifs, primer sequences,
annealing temperatures (temp.), GenBank accession numbers, and fluorescence labels
Locus Motif Primer sequence (5'-3' ) Annealing temp. (°C) Accession no. Fluorescence label
AJMS-3 (GT)n F: GGTATGAATGCAGGCGTTTATG 60 AJ297601 5′TAMRA
R: GCAACCGATTTGATCTCCAG
AJMS-5 (GT)n F: CCTTCAGATTGCTAGCAC 58 AJ297602 5′HEX
R: CGGAGTCTAATTGTCTCCTC
AJMS-6 (GT)n F: ACAGAGCCAGACAAACAGAC 58 AJ297603 5′HEX
R: GGTCAGCAAGCAAAACGAAC
AJM-1 (GT)n F: AGTAAAGAGTCCCACGCATTC 60 AM062762 5′TAMRA
R: AAGGTGGATTTTTGCTGGCTC
AjTR-12 (GA)n F: AACGTTAGTCCCTAGGTTCC 58 AB051084 5′FAM
R: TAAGGGTGTTATATGTTCAG
AjTR-37 (GT)n F: AGACCTTATGTCACCTTATGCT 58 AB051094 5′FAM
Genetic diversity and differentiation among the 3 eel types
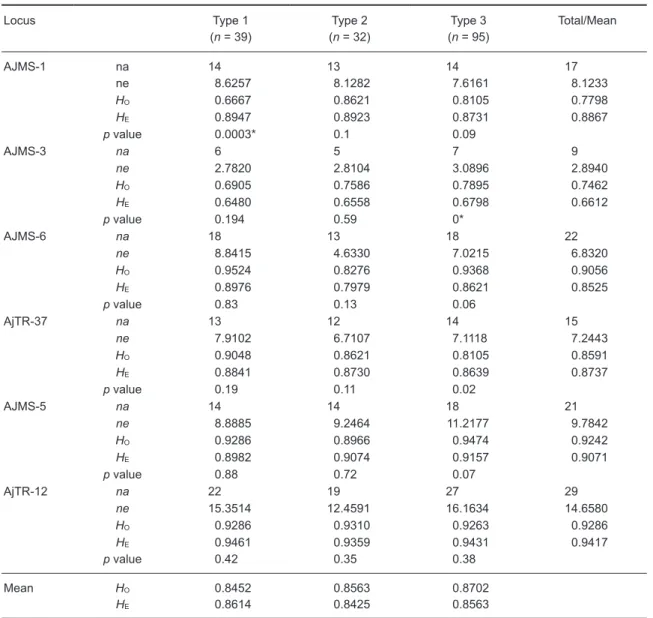
The observed number of alleles (na), effective number of alleles (ne), observed heterozygosity (HO), expected heterozygosity (HE), and HWE test
of the 6 microsatellite loci from the 3 eel types are shown in table 2. All loci were moderately to highly polymorphic, such that the total number of alleles ranged from 9 in locus AJMS-3 to 29 in locus AjTR-12 (Table 2). The HWE test showed that only two of 18 (13%) loci significantly deviated, after Bonferroni corrections. They were scattered in the
AJMS-1 and AJMS-3 loci, with neither eel type- nor locus-specific patterns (Table 2). No allele dropout was found in any of the 3 eel types, as tested by Micro-Checker. Null alleles were found only in the AJMS-1 locus of the type 1 eel.
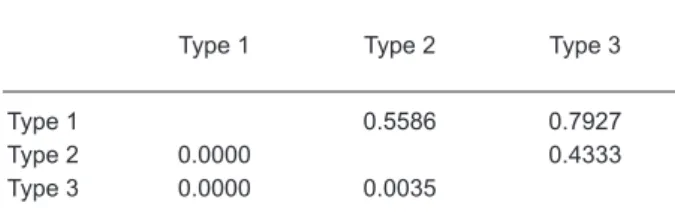
The overall genetic differentiation among the 3 eel types was very low and statistically insignificant (FST = 0.0007, p = 0.99) (Table 3). FST
estimates between sample pairs ranged 0-0.0035. No pairwise FST tests were significant among the 3
eel types (Table 3).
The POWSIM analysis of statistical power for detecting differentiation among samples
Table 2. Levels of genetic variation observed at 6 microsatellite loci. HO, observed
heterozygosity; HE, expected heterozygosity; na, observed number of alleles; ne, effective number
of alleles; n, sample size. *Indicates a significant deviation from Hardy-Weinberg equilibrium after a Bonferroni-corrected p value of 0.0028
Locus Type 1
(n = 39) (n = 32)Type 2 (n = 95)Type 3 Total/Mean
AJMS-1 na 14 13 14 17 ne 8.6257 8.1282 7.6161 8.1233 HO 0.6667 0.8621 0.8105 0.7798 HE 0.8947 0.8923 0.8731 0.8867 p value 0.0003* 0.1 0.09 AJMS-3 na 6 5 7 9 ne 2.7820 2.8104 3.0896 2.8940 HO 0.6905 0.7586 0.7895 0.7462 HE 0.6480 0.6558 0.6798 0.6612 p value 0.194 0.59 0* AJMS-6 na 18 13 18 22 ne 8.8415 4.6330 7.0215 6.8320 HO 0.9524 0.8276 0.9368 0.9056 HE 0.8976 0.7979 0.8621 0.8525 p value 0.83 0.13 0.06 AjTR-37 na 13 12 14 15 ne 7.9102 6.7107 7.1118 7.2443 HO 0.9048 0.8621 0.8105 0.8591 HE 0.8841 0.8730 0.8639 0.8737 p value 0.19 0.11 0.02 AJMS-5 na 14 14 18 21 ne 8.8885 9.2464 11.2177 9.7842 HO 0.9286 0.8966 0.9474 0.9242 HE 0.8982 0.9074 0.9157 0.9071 p value 0.88 0.72 0.07 AjTR-12 na 22 19 27 29 ne 15.3514 12.4591 16.1634 14.6580 HO 0.9286 0.9310 0.9263 0.9286 HE 0.9461 0.9359 0.9431 0.9417 p value 0.42 0.35 0.38 Mean HO 0.8452 0.8563 0.8702 HE 0.8614 0.8425 0.8563
showed 97.3%, 97.8%, and 97.2% for Chi-squared test, and 96.5%, 96.5%, and 96.0% for Fisher’s exact test where Ne/t combinations respectively corresponded to 500/5, 1000/10, and 2000/20. Therefore, the power analysis revealed that 6 microsatellite loci were sufficient to provide a > 96% probability of detecting an FST of 0.005
when analyzing the 166 total specimens distributed in 3 groups.
DISCUSSION
Life-history scans of otolith Sr/Ca ratios confirmed that yellow-stage Japanese eels occupy habitats that include fresh and brackish water, with some eels migrating between the 2 habitats. The diverse habitat usage allows the eels to find a suitable habitat (Han et al. 2003a), and might also promote the occurrence of population differentiation. In the facultatively diadromous New Zealand eleotrid (Gobiomorphus cotidianus), the loss of migration in certain subpopulations limits dispersal and gene flow between distant populations and, therefore, facilitates intraspecific morphological, behavioral, and genetic differentiation between migratory and non-migratory populations (Christian et al. 2008). Therefore, if reproductive isolation persists, these processes may provide a mechanism leading to speciation. For the Japanese eel, silver eel spawners from habitats with different salinities might migrate and spawn in different spawning areas, forming different ecotypes. This study, however, found that eel groups with different habitat usage exhibited no apparent genetic differentiation. Accordingly, the variety of eel habitats used is more likely to be a result of behavioral plasticity, which depends on external factors such as habitat quality and/or intra-/
interspecific competition.
Genetic effects of habitat fragmentation for 50 yr on blue sucker (scientific name) populations were observed in the upper Missouri River (Bessert and Ortí 2008). A similar result was also found in European capercaillie (Tetrao urogallus) after only 50 yr of anthropogenic fragmentation (Segelbacher et al. 2003). If habitat preferences in the Japanese eel were heritable, eel populations with different habitat preferences might spawn in different spawning areas, thus forming “natural” habitat fragmentation, which would result in reproductive isolation and thus limit gene flow among populations. In the present study, no genetic differentiation was detected among eel types separated based on their habitat preferences, indicating little or no contribution of habitat use to population genetic isolation of the Japanese eel.
In conclusion, no genetic differentiation was found among eel groups possessing different habitat uses. Diverse habitat use by Japanese eels is more likely a result of behavioral plasticity that helps eels maximize their range of habitat possibilities.
Acknowledgments: This study was financially
supported by the National Science Council of Taiwan (NSC95-2313-B-002-019 and NSC96-2313-B-002-008). The authors are grateful to all previous students and research assistants for their help with field and laboratory work.
REFERENCES
Barluenga M, KN Stölting, W Salzburger, M Muschik, A Meyer. 2006. Sympatric speciation in Nicaraguan crater lake cichlid fish. Nature 439: 719-723.
Bessert ML, G Ortí. 2008. The genetic effects of habitat fragmentation on blue sucker populations in the upper Missouri River. Conserv. Genet. 9: 821-832.
Chang KC, YS Han, WN Tzeng. 2007. Evidence of panmictic populations among intra-annual arrival waves of the Japanese eel Anguilla japonica. Zool. Stud. 46: 583-590.
Cheng PW, WN Tzeng. 1996. Timing of metamorphosis and estuarine arrival across the dispersal range of the Japanese eel Anguilla japonica. Mar. Ecol.-Prog. Ser.
131: 87-96.
Christian M, BJ Hicks, KN Stölting, AC Clarke, MI Stevens, R Tana et al. 2008. Distinct migratory and non-migratory ecotypes of an endemic New Zealand eleotrid (Gobiomorphus cotidianus) – implications for incipient speciation in island freshwater fish species. BMC Evol. Biol. 8: 49.
Coyne JA, HA Orr. 2004. Speciation. Sunderland, MA: Sinauer Associates.
Daverat F, KE Limburg, I Thibault, JC Shiao, JJ Dodson et
Table 3. Pairwise FST values (below the diagonal)
and uncorrected p values (above the diagonal) between eel types. No values were significant (Bonferroni-corrected p value of 0.0167)
Type 1 Type 2 Type 3
Type 1 0.5586 0.7927
Type 2 0.0000 0.4333
Type 3 0.0000 0.0035
al. 2006. Phenotypic plasticity of habitat use by three temperate eel species Anguilla anguilla, A. japonica and A.
rostrata. Mar. Ecol.-Prog. Ser. 308: 231-241.
Friesen VL, AL Smith, E Gómez-Díaz, M Bolton, RW Furness, J González-Solís, LR Monteiro. 2007. Sympatric speciation by allochrony in a seabird. PNAS 104: 18589-18594.
Han YS, YT Chang, WN Tzeng. 2009. Variable habitat use by Japanese eel affects dissemination of swimbladder parasite Anguillicola crassus. Aquat. Biol. 5: 143-147.
Han YS, IC Liao, YS Huang, JT He, CW Chang, WN Tzeng. 2003b. Synchronous changes of morphology and gonadal development of silvering Japanese eel Anguilla
japonica. Aquaculture 219: 783-796.
Han YS, YL Sun, YF Liao, KN Shen, IC Liao, WN Tzeng. 2008. Temporal analysis of population genetic composition in the overexploited Japanese eel Anguilla japonica. Mar. Biol. 155: 613-621.
Han YS, JYL Yu, IC Liao, WN Tzeng. 2003a. Salinity preference of the silvering Japanese eel Anguilla japonica: evidences from the pituitary prolactin mRNA levels and otolith strontium/calcium ratios. Mar. Ecol.-Prog. Ser. 259:
253-261.
Raymond M, F Rousset. 1995. GENEPOP (vers. 1.2): population genetics software for exact tests and ecumenicism. J. Hered. 86: 248-249.
Rice WR. 1989. Analyzing tables of statistical tests. Evolution
43: 223-225.
Ryan PG, P Bloomer, CL Moloney, TJ Grant, W Delport. 2007. Ecological speciation in South Atlantic island finches. Science 315: 1420-1423.
Ryman N, S Palm. 2006. POWSIM: a computer program for assessing statistical power when testing for genetic differentiation. Mol. Ecol. 6: 600-602.
Schneider S, D Roessli, L Excoffier. 2000. Arlequin: a software for population genetics data analysis. Vers. 2.000. Geneva, Switzerland: Genetics and Biometry Lab,
Department of Anthropology, Univ. of Geneva.
Segelbacher G, J Hoglund, I Storch. 2003. From connectivity to isolation: genetic consequences of population fragmentation in capercaillie across Europe. Mol. Ecol.
12: 1773-1780.
Tesch FW. 2003. The eel. Oxford, UK: Blackwell Science. Tsukamoto K. 1992. Discovery of the spawning area for
Japanese eel. Nature 356: 789-791.
Tsukamoto K. 2006. Spawning of eels near a seamount: tiny transparent larvae of the Japanese eel collected in the open ocean reveal a strategic spawning site. Nature 493:
929.
Tsukamoto K, T Arai. 2001. Facultative catadromy of the eel Anguilla japonica between freshwater and seawater habitats. Mar. Ecol.-Prog. Ser. 220: 265-276.
Tsukamoto K, I Nak, WV Tesch. 1998. Do all freshwater eels migrate? Nature 396: 635-636.
Tzeng WN, Y Iizuka, JC Shiao, Y Yamada, H Oka. 2003. Identification and growth rates comparison of divergent migratory contingents of Japanese eel (Anguilla japonica). Aquaculture 216: 77-86.
Tzeng WN, KP Severin, H Wickström. 1997. Use of otolith microchemistry to investigate the environmental history of European eel Anguilla anguilla. Mar. Ecol.-Prog. Ser.
149: 73-81.
Tzeng WN, JC Shiao, Y Iizuka. 2002. Use of otolith Sr: Ca ratios to study the riverine migratory behaviors of Japanese eel Anguilla japonica. Mar. Ecol.-Prog. Ser.
245: 213-221.
Van Oosterhout C, WF Hutchinson, DPM Wills, P Shipley. 2004. Micro-Checker: software for identifying and correcting genotyping errors in microsatellite data. Mol. Ecol. Note 4: 535-538.
Weir BS, CC Cockerham. 1984. Estimating F-statistics for the analysis of population structure. Evolution 38: 1358-1370.