IV FINDINGS AND DISCUSSION
Empirical Results Six Regions
4.1 Six Regions and Americans Studying Abroad
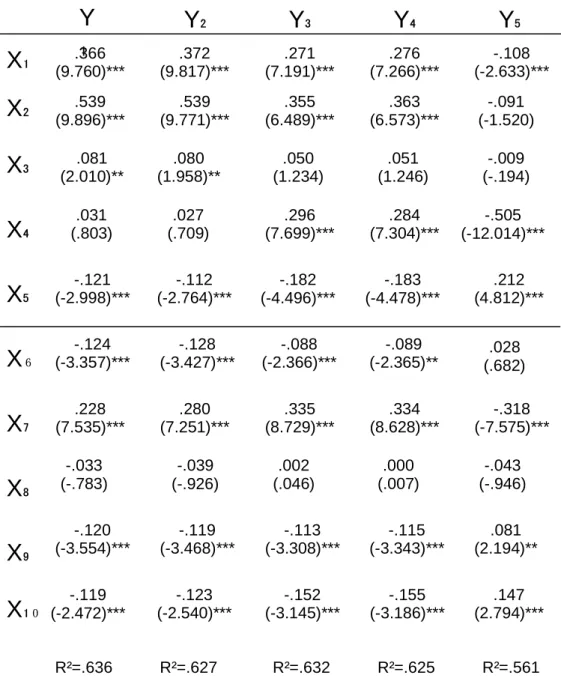
The data for the analysis are shown in Table 9 for each of the ten independent variables and the economic performance of the United States over the fiscal period for the years 1990- 2004. The variable for masculinity x₁ indicates the amount of Americans studying abroad. This analysis was performed on all six regions from table 6.
United States Exports (Y₁ & Y₂)
Americans studying abroad x₁ and membership in the WTO x₂ are both positive and significant at the 1% level. The more aggressive a country is behaving by hosting American students and the lower their power distance with the United States, the more United States’
goods they are buying. The number of disputes against WTO members x₃ is significant at the 5% level for both types of exports. Countries that are becoming more individualistic buy more
Y₂Y₂== ff ((xxii)) == ..337722**xx11++..553399**xx22++..008800**xx33++..002277**xx44++--..111122**xx55++ ((99..881177)) ((99..771111)) ((11..995588)) ((..770099)) ((--22..776644))
-.-.112288**xx66++..228800**xx77++--..003399**xx88++--..111199**xx99++--..112233**xx1100 ++ εε (-3.427) (7.251) (-.926) (-3.468) (-2.540)
Y
Y₁₁== ff ((xxii)) == ..336666**xx11++..553399**xx22++..008811**xx33++..003311**xx44++--..112211**xx55++ ((99..776600)) ((99..889966)) ((22..001100)) ((..880033)) ((--22..999988))
-
-..112244**xx66++..222288**xx77++--..003333**xx88++--..112200**xx99++--..119999**xx1100 ++ εε (-3.357) (7.535) (-.783) (-3.554) (-2.472)
United States exports than countries who are more communitarian. Population x₄ is not significantly obvious for United States exports.
Countries that continue to exhibit low uncertainty avoidance by engaging in business outside of their own language are important buyers of United States products. This means that of the countries that are important markets for buying United States goods and services these are countries that do not use English officially as can by see in that language x₅ is negative and significant at the 1% level.
Regionally, Asia x₇ is positive and significant for both types of exports at the 1% level.
Asia is buying more United States goods than any other region using Latin America as a baseline.
Africa x₆, the Middle East x₉, and Europe x₁₀ are negative and significant at the 1% level.
These countries are not buying United States goods and services compared with Latin America as a baseline. Regional agreements such as the EU have not provided an important market for buying United States goods and services comparatively. The relationship between United States exports and Southeast Asia & Oceania x₈ is not obvious. The implication here is that Asia is buying the most United States goods and services and it is here where international education should be focused.
The cultural and regional variables tested in this study are explaining 63% of trade performance with the United States since R² for both models is around 63%. United States domestic exports have a slightly higher score. Cultural variables and regional attribution have slightly more effect on Y₁ then Y₂.
United States Imports (Y₃ & Y₄)
YY₃₃= = ff ((xxii)) == ..227711**xx11++..335555**xx22++..005500**xx33++..229966**xx44++--..118822**xx55++ (7(7..119911)) ((66..448899)) (1(1..223344)) ((77..696999)) ((--44..449966))
-.-.008888**xx66++..333355**xx77++..000022**xx88++--..111133**xx99++..114477**xx1100 ++ εε (-2.366) (8.729) (.046) (-3.308) (2.794)
Y₄Y₄= = ff ((xxii)) == ..227766**xx11++..336633**xx22++..005511**xx33++..228844**xx44++--..118833**xx55++ ((77..226666)) ((66..557733)) ((11..224466)) ((77..330044)) ((--44..447788))
-
-..008899**xx66++..333344**xx77++..000000**xx88++--..111155**xx99++--..115555**xx1100 ++ εε
The sale of goods to the United States has similar results for Americans studying abroad x₁, membership in the WTO x₂. Again, the more aggressive a country is behaving by hosting American students and the lower its power distance with the United States, the more United States goods it is selling to the United States.
There is not a significant relationship between individualism x₃ and the importation of goods to the United States. It is unclear which type of country is selling goods to the United States on the scale of individualism.
The larger the country x₄ the more it is selling goods to the United States comparatively.
This is positive and significant at the 1% level. Language x₅, however, is negative and significant at the 1% level. Countries that are selling goods and services to the United States do not speak English officially. Therefore, countries that are exhibiting high masculinity, low power distance, low uncertainty avoidance, and that have large populations are important factors for importing to the United States.
Regionally, Asia x₇, the Middle East x₉, and Europe x₁ are all significant at the 1% level but only Asia is positive. Asian countries are currently importing more goods into the United States than other regions compared to Latin America as a baseline. Africa x₆ is significant at the 5% level and is also sending fewer imports than Latin America. There is no obvious relationship between the Southeast Asia & Oceania x₇ and the importation of goods to the United States.
As for the selling of goods to the United States, the R² for both models is again around 63% with United States general imports CIF (Y₃) about 1 percent higher. Therefore, these cultural and regional variables are explaining 63% of trade performance. Surcharges in shipping can provide slightly better results.
Balance of Trade (trade deficit/trade surplus)
Masculinity x₁ is negative and significant at the 1% level. Countries exhibiting high masculinity are causing a trade deficit for the United Sates. Focus should be placed on these
Y
Y₅₅= = ff ((xxii)) == --..110088**xx11++--..009911**xx22++--..000099**xx33++--..505055**xx44++..221122**xx55++ ((--22..663333)) ((--11..552200)) ((--..119944)) ((--1122..001144)) ((44..881122))
.0.02288**xx66++--..331188**xx77++--..004433**xx88++..008811**xx99++..114477**xx1100 ++ εε (.682) (-7.575) (-.946) (2.194) (2.794)
markets by sending American students to study to increase institutional understanding to restore the balance and reduce the deficit.
There is no obvious relationship between power distance x₂ and individualism x₃ and the balance of trade for the United States.
Countries that are large x₄ are producing a trade deficit because they haven’t opened up their market. If the trade deficit is to be reduced, focus should be placed on open economies until the time when large closed economies are able to open their economies and change their path dependence; if they are willing.
Countries that are high in uncertainty avoidance x₅ are causing a trade surplus for the United States; therefore the United States can take advantage of other countries that speak English officially. Focus should be placed on countries exhibiting low uncertainty avoidance to reduce the trade deficit.
Regionally, Europe x₁₀ is positive and significant at the 1% level and the Middle East x₉ is positive and significant at the 5% level. Both regions are important for creating trade surpluses. Good relations with these regions are import if a trade surplus is to continue. Asia x₇ is significant at the 1% level but it is producing a trade deficit. There is not significant relationship between trade surplus and Africa x₆ and Southeast Asia & Oceania x₈.
The R² drops to 56 percent. These cultural and regional variables are explaining 56 percent of the variance of trade performance.
Table 9 Cultural and Regional Variables for Americans Studying Abroad
Y ₃ Y ₄ Y ₅ X₁
X₂ X₃ X ₄ X₅ X₆ X₇ X ₈ X₉ X₁₀
.366 (9.760)***
.539 (9.896)***
.081 (2.010)**
.031 (.803)
-.121 (-2.998)***
-.124 (-3.357)***
.228 (7.535)***
-.033 (-.783)
-.120 (-3.554)***
-.119 (-2.472)***
.372 (9.817)***
.539 (9.771)***
.080 (1.958)**
.027 (.709)
-.112 (-2.764)***
-.128 (-3.427)***
.280 (7.251)***
-.039 (-.926)
-.119 (-3.468)***
-.123 (-2.540)***
.271 (7.191)***
.355 (6.489)***
.050 (1.234)
.296 (7.699)***
-.182 (-4.496)***
-.088 (-2.366)***
.335 (8.729)***
.002 (.046)
-.113 (-3.308)***
-.152 (-3.145)***
.276 (7.266)***
.363 (6.573)***
.051 (1.246)
.284 (7.304)***
-.183 (-4.478)***
-.089 (-2.365)**
.334 (8.628)***
.000 (.007)
-.115 (-3.343)***
-.155 (-3.186)***
R²=.625 R²=.632
R²=.627
R²=.636 R²=.561
-.108 (-2.633)***
-.091 (-1.520)
-.009 (-.194)
-.505 (-12.014)***
.212 (4.812)***
-.318 (-7.575)***
-.043 (-.946)
.081 (2.194)**
.147 (2.794)***
Y
₁ Y ₂
.028 (.682)
• The numbers in the Parenthesis are the ratio of parameter estimate to standard error of estimate, where * denotes significance at 10 percent level, ** denotes significance at 5 percent level; *** denotes as significance at 1 percent level.
Empirical Results Six Regions
4.2 Six Regions and Foreign Students in the United States
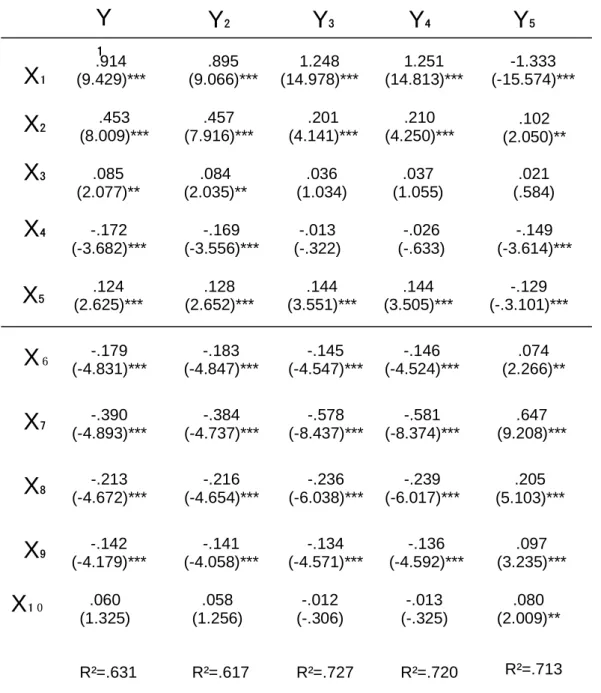
The data for the analysis are shown in Table 10 for each of the ten independent variables and the economic performance of the United States over the fiscal period for the years 1990- 2004. The variable for masculinity x₁ indicates the number of foreign students studying in the United States. The regression analyzes all six regions that are listed in table 6.
United States Exports (Y₁ & Y₂)
As the number of foreign students in the United States increases so does the ability of the United States to sell its goods and services to other nations. The same trend is seen as more countries join the WTO, the ability of the United States to sell its exports also increases.
Therefore the correlation between foreign students in the United States x₁ and membership in the WTO x₂ are both positive and significant at the 1% level. Places exhibiting high masculinity values which are trying to lower their power distance are important factors for the buying of United States goods and services.
Countries that are becoming more individualistic buy more exports from the United Y
Y₁₁== ff ((xxii)) == --..991144**xx11++..445533**xx22++..008855**xx33++--..171722**xx44++..112244**xx55++ ((99..442299)) (8(8..000099)) ((22..000077)) ((--33..668822)) ((22..662255))
-.-.117799**xx66++--..339900**xx77++--..221133**xx88++--..114422**xx99++..006600**xx1100 ++ εε (-4.831) (-4.893) (-4.672) (-4.179) (1.325)
Y₂Y₂= = ff ((xxii)) == ..889955**xx11++..445577**xx22++..008844**xx33++--..116699**xx44++..112288**xx55++ ((99..006666)) ((77..991166)) ((22..003355)) (-(-33..555566)) ((22..665522))
-.-.118833**xx66++--..338844**xx77++--..221166**xx88++--..114411**xx99++..005588**xx1100 ++ εε (-4.487) (-4.737) (-4.654) (-4.058) (1.256)
of WTO member disputes x₃ shows the relationship that individualistic countries are buying more goods and services from the United States than countries that are acting more communitarian. This is true for both types of exports.
Countries that have large populations x₄ are not buying United States goods and services.
Rather it is the smaller countries that are important markets for the United States to sell its goods and services. The negative correlation between population and sale of United States products at the 1 percent level is a strong indicator that large countries have not opened up their market for United States goods.
Countries that speak English x₅ are buying more United States goods and services than non-English speaking countries. Countries that are exhibiting high uncertainty avoidance by engaging in business inside their own language, in this case English, are important buyers of United States exports.
Compared with the trade performance of Latin America with the United States, the regions of Africa x₆, Asia x₇, Southeast Asia & Oceania x₈, and the Middle East x₉ are not buying more United States exports respectively. Regional agreements such as ASEAN have not provided an important market for the buying of United States services comparatively with Latin America. The relationship between United States exports and Europe x₁₀ is not significant.
The cultural and regional variables for United States exports explain 63.1% of trade performance for United States domestic exports and 61.7% for United States total exports as exhibited by the R². United States domestic exports have a slightly higher score. Cultural variables and regional attribution has slightly more effect of on Y₁ then Y₂.
United States Imports (Y₃ & Y₄)
The higher a country rates on the masculinity scale x₁ the more that country imports goods to the U.S. This is inversely true of power distance x₂ where the lower the power distance is between countries the higher the amount of importation of goods to the United States.
Therefore, high masculinity and low power distance are important factors for the United States to consider when wanting to import goods from foreign countries to the United States.
There is not a significant relationship between individualism x₃ and population x₄ correlated with the importation of goods to the United States. Goods are coming from countries that are high in individualism and high in communitarianism which also have large and small populations.
The use of English as an official language x₅ has a similar correlation as masculinity and power distance. The importation of goods to the United States is occurring from countries that speak English more than from countries that do not speak English which shows that a high level of uncertainty avoidance is good for the sale of goods to the United States.
Regionally, Africa x₆, Asia x₇, Southeast Asia & Oceania x₈, and the Middle East x₉ are not importing more goods than Latin America to the United States. Regional agreements such as ASEAN have not provided an important market for selling goods to the United States comparatively with agreements made in the Americas. Europe x₁₀ does not have an obvious relationship with United States imports.
Y
Y₃₃= = ff ((xxii)) == 11..224488**xx11++..202011**xx22++..003366**xx33++--..001133**xx44++..114444**xx55++ ((1144..997788)) (4(4..114411)) ((11..003344)) ((--..332222)) ((33..555511))
-
-..114455**xx66++--..557788**xx77++--..223366**xx88++--..113344**xx99++--..001122**xx1100 ++ εε (-4.547) (-8.437) (-6.038) (-4.571) (-.306)
Y
Y₄₄= = ff ((xxii)) == 11..225511**xx11++..212100**xx22++..003377**xx33++--..002266**xx44++..114444**xx55++ ((1144..881133)) (4(4..225500)) (1(1..050555)) ((--..663333)) ((33..550055))
-
-..114466**xx66++--..558811**xx77++--..223399**xx88++--..113366**xx99++--..001133**xx1100 ++ εε (-4.524) (-8.374) (-6.017) (-4.592) (-.325)
A .727 R² for general imports CIF and a .707 for general imports CV indicate that the changes in culture measured by these variables regionally explain around 72% of trade performance of the United States. However, United States general imports CIF (Y₃) is about 1 percent higher. Surcharges in shipping can provide slightly better results.
Balance of Trade (trade deficit/trade surplus)
Countries exhibiting high masculinity x₁ are causing a trade deficit for the United Sates.
The result is positive and significant at the 1 percent level. Focus should be placed on these markets by importing more students from these countries to increase the understanding of United States institutions by foreigners so that they thereby gain knowledge of the United States market and so the trade deficit is reduced. The United States needs to be more aggressive in international education pursuits as in recruiting foreign students.
Lowered power distance x₂ can create trade surpluses for the United States. The result is positive and significant at the 5 percent level. There is no obvious relationship between individualism x₃ and the balance of trade for the United States.
Countries that are large in population size x₄ are producing a trade deficit because they have not opened up their market. The result is negative and significant at the 1 percent level.
Until countries with large populations open up their market this won’t change. Since protectionism can result in a closed economy, the process of liberalizing the economies of both trading partners would be beneficial. Emphasis needs to be on maintaining good diplomatic relations with smaller countries until the time when larger closed economies have had enough time to adjust and change their path dependence to a more open policy.
Countries that are low in uncertainty avoidance x₅ are causing a trade surplus for the United States; therefore the United States can take advantage of other countries that do not speak English but not the ones which do. The result is negative and significant at the 1 percent level.
Y₅Y₅== ff ((xxii)) == --11..333333**xx11++..110022**xx22++..002211**xx33++--..114499**xx44++--..112299**xx55++ ((--1155..557744)) ((22..005500)) ((..558844)) ((--33..661144)) ((--33..110011))
..007744**xx66++..664477**xx77++..220055**xx88++..009977**xx99++..008800**xx1100 ++ εε (2.266) (9.208) (5.103) (3.235) (2.009)
Focus should be placed on countries exhibiting high uncertainty avoidance to reduce the trade deficit.
Comparing regional performance shows that all regions are creating a greater trade surplus for the United States than Latin America. Asia x₇, Southeast Asia & Oceania x₇, Middle East x₉ are positive and significant at the 1% level. Europe x₁₀ and Africa x₆ are significant at the 5% level. These regions are important for creating trade surpluses and are creating these trade surpluses more than Latin America comparatively. Good relations with these regions are important if a trade surplus is to continue.
The results from the cultural and regional variables explain 71 percent of United States trade performance as seen in the R². Power distance and individualism do not contribute to this explanation.
Table 10 Cultural and Regional Variables for Foreign Students Studying in the United States
Y
₁ Y ₂ Y ₃ Y ₄
X ₁ X₂ X₃ X ₄ X₅ X ₆ X₇ X ₈ X ₉ X₁₀
.914 (9.429)***
.453 (8.009)***
.085 (2.077)**
-.172 (-3.682)***
.124 (2.625)***
-.179 (-4.831)***
-.390 (-4.893)***
-.213 (-4.672)***
-.142 (-4.179)***
.060 (1.325)
.895 (9.066)***
.457 (7.916)***
.084 (2.035)**
-.169 (-3.556)***
.128 (2.652)***
-.183 (-4.847)***
-.384 (-4.737)***
-.216 (-4.654)***
-.141 (-4.058)***
.058 (1.256)
1.248 (14.978)***
.201 (4.141)***
.036 (1.034)
-.013 (-.322)
.144 (3.551)***
-.145 (-4.547)***
-.578 (-8.437)***
-.236 (-6.038)***
-.134 (-4.571)***
-.012 (-.306)
1.251 (14.813)***
.210 (4.250)***
.037 (1.055)
-.026 (-.633)
.144 (3.505)***
-.146 (-4.524)***
-.581 (-8.374)***
-.239 (-6.017)***
-.136 (-4.592)***
-.013 (-.325)
R²=.720 R²=.727
R²=.617 R²=.631
-1.333 (-15.574)***
.102 (2.050)**
.021 (.584)
-.149 (-3.614)***
-.129 (-.3.101)***
.074 (2.266)**
.647 (9.208)***
.205 (5.103)***
.097 (3.235)***
.080 (2.009)**
R²=.713
Y ₅
• The numbers in the Parenthesis are the ratio of parameter estimate to standard error of estimate, where * denotes significance at 10 percent level, ** denotes significance at 5 percent level; *** denotes as significance at 1 percent level.
4.3 Summary and Conclusions for Six Regions
The hypothesis pertaining to the study of the number of American students studying abroad for x₁, the four other cultural variables, and five regional variables for six regions of the world are as follows:
The alternative hypothesis 1 is accepted for all forms of trade. There is significant difference in trade performance when sending American students abroad to receive a foreign education. The more American students that go abroad to study the more trade increases for the United States. More American students are studying in countries that sell goods and services to the United States than the countries that buy goods and services from the United States. This is showing an effect of a trade deficit.
The alternative hypothesis 2 is accepted for both United States imports and exports.
When a country enters the WTO there is significant difference in trade performance relating to the buying of goods and services to and from the United States. As for the United States balance of trade, the null hypothesis is accepted. There is no significant difference in the United States balance of trade when countries enter into the WTO.
The alternative hypothesis 3 is accepted for United States exports. The amount of disputes a country files against member countries of the WTO changes the amount of United States goods and services bought by the country that filed the dispute. A high level of individualism is good for the buying of United States goods and services. As for United States imports and balance of trade, the null hypothesis 3 is accepted. When a country files disputes against other member countries of the WTO there is no change in the amount of goods and services sold to the United States and the balance of trade with the United States for the country that filed the disputes.
The null hypothesis 4 is accepted for United States exports. Larger countries do not show a difference in the buying of United States goods and services than smaller countries. The alternative hypothesis 4 is accepted for United States imports and balance of trade. Larger countries do show a difference in the selling of goods and services to the United States than smaller countries. Larger countries are selling more goods and services to the United States than smaller countries. Larger countries are producing more of a trade deficit for the United States than smaller countries.
The alternative hypothesis 5 is accepted for all forms of trade. There is a significant difference between the use of a common language shared by two trading partners and their trade performance. Countries that use English as an official language are not buying or selling goods and services from and to the United States more than countries that do not speak English officially. Countries that do not speak English officially have been creating a trade surplus for the United States.
The alternative hypothesis 6 is accepted for Africa, Asia, the Middle East, and Europe.
There are differences in trade performance due to regional differences. Asia is the only country to be outperforming the other countries compared to Latin America used as the baseline. Asia was the only country to produce a trade deficit; the other countries produced a trade surplus for the United States. As for Southeast Asia & Oceania, the null hypothesis 6 is accepted. There are no differences in trade performance due to regional differences.
The hypothesis pertaining to the study of the number of foreign students studying in the United States for x₁, the four other cultural variables, and five regional variables for six regions of the world are as follows:
The alternative hypothesis 1 is accepted for all forms of trade. There is significant difference in trade performance when receiving foreign students into the United States. The effect is a positive one. The more students that come into the United States to study, the more trade increases for the United States. More students are coming into the United States from countries that are selling foreign goods and services to the United States than from countries that are buying United States goods and services. This is showing an effect of a trade deficit.
The alternative hypothesis 2 is accepted for all forms of trade. When a country enters the WTO there is a significant difference in trade. The lowering of power distance between the United States and other countries increases the amount of trade.
The alternative hypothesis 3 is accepted for United States exports. The number of disputes a country files against other member countries has an impact on how much United States exports a foreign country buys. The null hypothesis 3 is accepted for United States imports and balance of trade. The effect of filing disputes against member countries of the WTO has no impact on the selling of goods and services to the United States and the balance of trade
of the United States. A high level of individualism is only good for the buying of United States goods and services.
The alternative hypothesis 4 is accepted for United States exports and balance of trade.
Larger countries will show a difference in trade performance when it comes to the buying of United States’ goods and services and increasing or decreasing the trade deficit. Larger countries that have more closed markets are not buying United States goods and services. The large countries are also creating a trade deficit. The null hypothesis is accepted for United States imports. Larger countries do not show a difference in the selling of goods and services to the United States than smaller countries.
The alternative hypothesis 5 is accepted for all forms of trade. There is a significant difference between the use of a common language shared by two trading partners and their trade performance. A high amount of uncertainty avoidance is good for the selling of goods and services to and from the United States. Countries that have the commonality of language with the United States are engaging more in trade than countries that do not have that commonality.
A high level of uncertainty avoidance is bad for the trade deficit however as countries that use English officially are selling more goods and services to the United States than they are buying.
The alternative hypothesis 6 is accepted for all forms of trade for all regions except Europe. In the case of Africa, Asia, Southeast Asia & Oceania, and the Middle East, there are differences in trade performance due to regional differences. No region is trading Latin America.
These regions are producing a trade deficit. For Europe in the case of the balance of trade, the alternative hypothesis 6 is accepted. However for the buying and selling of goods and services from and to the United States, the null hypothesis is accepted. There are no differences in trade performance due to regional differences.
The R² is higher in table 10 than in table 9. The receiving of foreign students by the United States, which becomes than the dominant variable, can explain more of the trade variance than when the amount of Americans studying abroad is used.
American values need to consider the following: The dimension of masculinity is highest with nations seeking to compete globally rather than keeping its focus on the welfare of only its own citizens. Therefore the United States has to be aggressive in its pursuit of foreign education.
Americans have to be more knowledgeable about foreign markets and this is best down through experiential education which leads to institutional understanding. This is evident when the major
descriptive factor for trade performance is when students come into the United States to study.
This is the highest explanatory variable for the variance in trade performance. The more students that come into the United States to study, the more they understand our market and can buy and sell goods from and to the United States. Since many of the countries are manufacturing based countries they are selling much more to the United States than they are buying. This is causing a trade deficit.
It does show in table 9 that when Americans study abroad the trade performance for the countries trading with the United States also increases. This is evident when Americans are studying at countries that are buying United States goods and services more so than countries that are selling goods and services to the United States. Americans know these markets the best.
The volume of students that come into the United States to study far outweighs the number of Americans that study abroad. Therefore, the number of Americans studying abroad does not become the major explanatory variable in the table. More Americans need to study abroad, be more masculine (aggressive), to increase international trade. The United States should also continue to be aggressive by recruiting foreign students and allowing them to have visas to continue the trend of increased performance.
This aggressiveness has to be countered by an effort to decrease the power distance between countries, in this case the United States, by joining the WTO and in the case of exports, for countries exhibiting a high degree of individualism. Open negotiation and the assurance of a court of law to enforce contracts are increasing United States trade performance. Therefore, the United States has to increase its power by using education and not by using its economic strength to manipulate the market.
Americans studying abroad and the WTO are important under a language consideration as well. Americans studying abroad lower information costs and transaction costs by increasing the ability to negotiate across the language divide. The WTO provides a forum where differences in language are evened out.
Countries that can be grouped by regional trade agreements and are similar in cultural dimensions show a potential for trade and should be considered as an area of new entry by organizations. These are highly masculine and individualistic countered with low uncertainty avoidance and power distance.
Countries with large populations and closed economies are creating trade deficits by selling large amounts to the United States. As large countries take longer to change their path dependence effort should be placed on smaller countries with open economies until such time as this can be changed without hurting the local economies of both trading partners.
Regionally Asia is the important region for buying United States exports and imports since they outperform other regions. However, this is creating a trade deficit since the region is selling more goods to the United States than it is buying. Europe, the Middle East, and Africa are currently important regions for reducing the trade deficit. With recent United States international policy, United States diplomatic relations have at best become strained with the Middle East and as a result Europe. If America wants to reduce the trade deficit it should restore relations with these regions and promote institutional understanding within the governmental body and not pursue institutional imperialism. Sending Americans to understand these foreign institutions is an important first step as well as recruiting foreign students from these regions.
This would promote mutual trust if trust is willing to be risked.
Empirical Results
Asia, Southeast Asia, and the Middle East
4.4 Americans Study Abroad for Asia, Southeast Asia, and the Middle East
The data for the analysis are shown in Table 11 for each of the seven independent variables and the economic performance of the United States over the fiscal period for the years 1990-2004. The times series regression formula used was:
Y= f (xi) = b1*x1+b2*x2+b3*x3+...+b7*x7 + ε
This is focused on three of the regions under study. The regions compared are the ones with booming economies, Asia x₆ & Southeast Asia x₇, compared with countries rich in resources, the Middle East as the baseline. Both are important trading partners for the United States. All three regions have shown much change in trade policies with the United States compared with the regions of European influence that have had centuries of trade with the United States.
United States Exports (Y₁ & Y₂)
American students studying in this region are causing the trade performance in relation to the buying of United States’ goods and services to increase. More American students are going to study x₁ in the emerging markets that are rich in human resources and the politically unstable markets that are rich in natural resources.
YY₁₁= = ff ((xxii)) == ..221144**xx11++..221111**xx22++..110099**xx33++--..113388**xx44++--..118822**xx55++..669955**xx66++..119922**xx77++ ++ εε ((55..443355)) ((33..993311)) ((22..884422)) ((--33..118800)) (-(-33..774400)) (13.743) (3.336)
Y₂Y₂== ff ((xxii)) = = ..221122**xx11++..222211**xx22++..110066**xx33++--..141433**xx44++--..116688**xx55++..669922**xx66++..118800**xx77++ ++ εε ((55..443311)) (4(4..115511)) ((22..779933)) (-(-33..330011)) ((--33..474777)) (13.775) (3.136)
The countries of these three regions are also trying to lower their power distance with other countries x₂ resulting in an increase of trade performance. As these countries reduce their power distance they are also increasing their individualism x₃ and this is allowing them to buy U.S. goods and services.
The larger the population a country has x₄, the less it is buying United States goods and services. It may be an indication of a large closed market or a country that has enough people in its workforce to become more self-sufficient.
The countries of Asia, Southeast Asia, and the Middle East show an inverse correlation between the use of English x₅ and the buying of United States goods or services. This means the countries where English isn’t spoken are the ones who are buying United States exports.
When comparing the three regions which have the most potential for resources whether it be natural resources or human resources, there is a marked difference in U.S. goods and services using the Middle East as the baseline against Asia x₆ and Southeast Asia x₇. Both are buying more exports than the Middle East. Asia is buying more exports than Southeast Asia. Political instability and a lack of institutional understanding in the region of the Middle East are bad for the buying goods and services produced in the United States.
When the trade performance of these three regions is compared against cultural and regional variables, the dimensions chosen from a neo-institutional perspective can explain 77 percent of trade performance with the United States. It should be noted that all cultural and regional variables in regards to both types of United States exports are significant at the 1 percent level. The score for total exports is slightly higher than domestic exports though the difference is only .3 percent.
United States Imports (Y₃ & Y₄)
The places where Americans are going to study are also heavy importers of goods and services to the United States. This is evident as the result is positive and significant at the 1 percent level.
Countries that are joining the WTO x₂ are significant at 10 percent for general imports CIF and at the 5 percent level for general imports CV. Both are positive. Countries trying to decrease their power distance with other countries are selling more goods and services to the United States than countries exhibiting high power distance.
The same type of significance level is seen for the filing of disputes in the WTO denoting individualism x₃. The results show a 10 percent significant level for general imports CIF and a 5 percent level for general import CV. The more individualistic countries are becoming the more they are able to sell their goods to the United States.
With a difference in significance level for general imports CIF and general imports CV, shipping charges may be more vulnerable to changes in culture and differences in regions.
The larger the population the more it is selling goods and services to the United States.
This is a human resource issue. Larger countries have not opened up their market perhaps because they have the man power to mass produce large quantities of items to the United States.
The use of English is the same as exports, negative and significant at the 1 percent level.
Countries that do not speak English officially are the ones selling goods and services to the United States. These countries are exhibiting a low amount of uncertainty avoidance.
Regionally, both Asia x₆ and Southeast Asia x₇ are importing more goods and services to the United States than the Middle East. Asia shows more significant results attributing trade success to greater cultural change in Asia than in Southeast Asia & Oceania. The countries that
YY₃₃= = ff ((xxii)) == ..220066**xx11++..111166**xx22++..007799**xx33++..223300**xx44++--..282800**xx55++..551199**xx66++..114433**xx77++ ++ εε ((44..663355)) ((11..991166)) ((11..883322)) ((44..668822)) ((--55..009977)) (9.180) (2.200)
YY₄₄== ff ((xxii)) == ..220077**xx11++..111199**xx22++..008811**xx33++..221155**xx44++--..228833**xx55++..552266**xx66++..114466**xx77++ ++ εε ((44..663333)) ((11..995522)) ((11..887722)) (4(4..335599)) ((--55..112233)) (9.179) (2.231)
are rich in human resources are more profitable in trade with the United States than the ones rich in natural resources.
The correlation independent and dependent variables are explaining 70 percent of international trade performance. Shipping charges seems to be more vulnerable to cultural change.
Balance of Trade (trade deficit/trade surplus)
More Americans are going to study in countries that are causing a trade deficit for the United States than countries that are creating a surplus. Americans are seeing the advantage of studying where there are resources available to be traded though the number is quite low. More Americans should be following this example.
As for the effort to decrease power distance x₂ and the effort to become more individualistic x₃ there is no significant relationship when trying to measure the balance of trade with the United States.
The larger a country is x₄, the more it is creating a trade deficit. The number for this result is quite high therefore large countries in these regions are selling much more goods and services to the United States than they are buying.
The more a country speaks English officially in these regions the more it is creating a trade surplus. This fits with the explanation given in United States exports and imports. The only countries to speak English officially in these regions are the Philippines, India, Hong Kong and Singapore. These four countries are creating a trade surplus when compared with the 11 countries that do not. A high level of uncertainty avoidance is good for the United States to reduce the trade deficit because the United States can take advantage of countries that have the commonality of language. Low uncertainty avoidance gives the opportunity for increased profit to foreign countries that do not speak English.
Asia x₆ is creating a trade deficit when compared to the Middle East. This means that Y₅Y₅= = ff ((xxii)) == -.-.117788**xx11++--..003333**xx22++--..005522**xx33++--..445522**xx44++..332233**xx55++--..334466**xx66++--..110033**xx77++ ++ εε
((--33..667744)) ((--..449966)) ((--11..110011)) ((--88..442299)) ((55..338822)) (-5.554) (-1.446)
resource markets of Asia are still outperforming them. There is no significant relationship between Southeast Asia & Oceania x₇ and the balance of trade with the United States.
The balance of trade performance for the United States and the countries in the three regions under study can be explained by cultural and regional variables 64 percent of the time.
In other words, these variables are explaining 64 percent of the variance for the balance of trade.
Table 11 Asia, SE Asia, and the Middle East for Americans Studying Abroad
Y₁ Y₂ Y₃ Y₄ Y₅
X ₁ X ₂ X ₃ X₄
X ₆ X ₅
X₇
R²=.768 .214 (5.435)***
.211 (3.931)***
.109 (2.842)***
-.138 (-3.180)***
-.182 (-3.740)***
.695 (13.743)***
.192 (3.336)***
R²=.771 .212 (5.431)***
.221 (4.151)***
.106 (2.793)***
-.143 (-3.301)***
-.168 (-3.477)***
.692 (13.775)***
.180 (3.136)***
R²=.702 .206
(4.635)***
R²=.705 .116 (1.916)*
.079 (1.832)*
.230 (4.682)***
-.280 (-5.097)***
.519 (9.180)***
.143 (2.200)**
.207 (4.633)***
.119 (1.952)**
.081 (1.872)**
.215 (4.359)***
-.283 (-5.123)***
.526 (9.179)***
.146 (2.231)**
R²=.636 -.178 (-3.674)***
-.033 (-.496)
-.052 (-1.101)
-.452 (-8.429)***
.323 (5.382)***
-.346 (-5.554)***
-.103 (-1.446)
• The numbers in the Parenthesis are the ratio of parameter estimate to standard error of estimate, where * denotes significance at 10 percent level, ** denotes significance at 5 percent level; *** denotes as significance at 1 percent level.
Empirical Results
Asia, Southeast Asia, and the Middle East
4.5 Foreign Students Studying in the U.S for Asia, Southeast Asia, and the Middle East
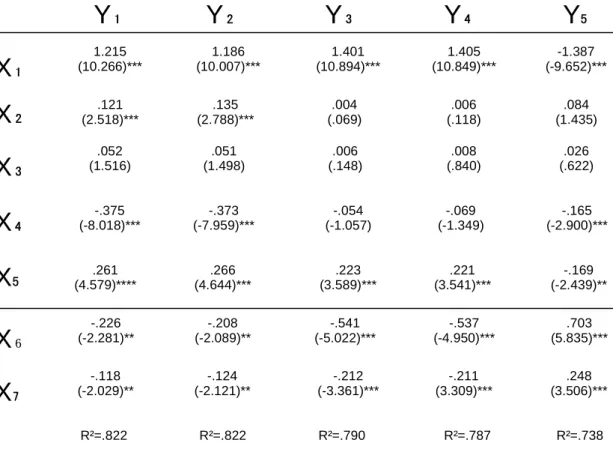
The data for the analysis are shown in Table 12 for each of the seven independent variables and the economic performance of the United States over the fiscal period for the years 1990-2004. The times series regression formula used was:
Y= f (xi) = b1*x1+b2*x2+b3*x3+...+b7*x7 + ε
The regions compared again are the ones with booming economies, Asia x₆ & Southeast Asia x₇, compared with countries rich in resources, the Middle East as the baseline. Here the variable x₁ has been changed to the amount of students coming to study in the United States thereby making the United States the host country.
United States Exports (Y₁ & Y₂)
The more students come in to the United States x₁ to study from a country the higher the trade performance between the United States and that country. This is also true of the efforts of the country to decrease power distance x₂. The more countries join the WTO the more United States goods and services they buy. Both results are positive and significant at the 1 percent level.
Y₁Y₁= = ff ((xxii)) = = 11..221155**xx11++..112211**xx22++..005522**xx33++--..337755**xx44++..226611**xx55++--..222266**xx66++--..111188**xx77++ ++ εε ((1100..226666)) ((22..551188)) ((11..551166)) ((--88..001188)) (4(4..557799)) (-2.281) (-2.029)
YY₂₂= = ff ((xxii)) = = 11..118866**xx11++..113355**xx22++..005511**xx33++--..337733**xx44++..226666**xx55++--..220088**xx66++--..112244**xx77++ ++ εε ((1100..000077)) ((22..778888)) ((11..449988)) (-(-77..995599)) ((44..664444)) (-2.089) (-2.121)
When students are coming into the United States to study there is no significant relationship between how a country files disputes thereby becoming more individualistic x₃ and the buying of U.S. goods and services.
The larger the country x₄ the less it is buying United States goods and services. However, the more a country speaks English officially the more it is likely to buy United States goods and services x₅. As stated before, this relates to the four countries that use English officially in this study.
Asia x₆ and Southeast Asia x₇ are both negative and significant at the 1 percent level with Asia having a higher result. The more foreign students come to the United States from these regions the less they are buying United States goods and services. The results are significant at the 5 percent level.
82 percent of the trade performance relating to United States exports can be explained by these cultural and regional variables. This time both types of exports match in R².
United States Imports (Y₃ & Y₄)
The more students a country sends to the United States to study the higher the amount of goods and services bought by the United States. This is the dominant explanatory variable for trade performance.
There are no significant relationships between lowering power distance by entry into the WTO x₂, an increasing sense of individualism by filing disputes in the WTO x₃, and population x₄.
Y₃Y₃== ff ((xxii)) == 11..440011**xx11++..000044**xx22++..000066**xx33++--..005544**xx44++..222233**xx55++--..554411**xx66++--..212122**xx77++ ++ εε ((1100..889944)) ((..006699)) ((..114488)) ((--11..005577)) ((33..558899)) (-5.022) (-3.361)
Y₄Y₄== ff ((xxii)) == 11..440055**xx11++..000066**xx22++..000088**xx33++--..006699**xx44++..222211**xx55++--..553377**xx66++--..212111**xx77++ ++ εε ((1100..884499)) ((..111188)) ((..884400)) ((--11..334499)) ((33..554411)) (-4.950) (-3.309)
The use of the English language officially x₅ is positive and significant at the 1 percent level. English speaking countries that are sending students to the United States are important countries for the selling of goods to the United States.
Asian x₆ and Southeast Asian x₇ countries are not selling more goods to the United States than Middle Eastern countries. Both are negative and significant at the 1 percent level.
These variables are explaining 79 percent of the variance of trade performance for these regions for the fifteen year period. General imports by shipping charges are again a little more sensitive to cultural influence.
Balance of Trade (trade deficit/trade surplus)
The results for masculinity x₁ are negative and significant at the 1 percent level.
Countries that are sending students to the United States are gaining an advantage in trade with the United States market and are therefore creating a trade deficit.
There are no significant relationships between reduced power distance x₂ and increased individualism x₃ and the balance of trade for the United States.
Both population x₄ and the use of English x₅ are negative and significant at the 1 percent level. The larger the countries are and the less they are using English officially, which shows they display low uncertainty avoidance, then the more they are benefiting from trade with the United States. The United States, however, is not benefiting from this trade as the trade relationship is creating a trade deficit.
Both Asia x₆ and Southeast Asia x₇ are creating trade surpluses for the United States when compared with the Middle East as a baseline. Both results are positive and significant at the 1 percent level.
The R² is at 74%. The cultural and regional variables are explaining 74 percent of the trade variance between Asia, Southeast Asia & Oceania, and the Middle East when correlated against the United States.
Y₅Y₅= = ff ((xxii)) == --11..338877**xx11++..008844**xx22++..002266**xx33++--..116655**xx44++--..116699**xx55++..770033**xx66++..224488**xx77++ + + εε ((--99..665522)) ((11..434355)) (6(62222)) ((--22..990000)) ((--22..443399)) (5.835) (3.506)
Table 12 Asia, SE Asia, and the Middle East for Foreign Students studying in the United States
Y ₁ Y ₂ Y ₃ Y ₄ Y ₅ X₁
X ₂ X ₃ X ₄
X ₆ X ₅
X ₇
R²=.822 1.215 (10.266)***
.121 (2.518)***
.052 (1.516)
-.375 (-8.018)***
.261 (4.579)****
-.226 (-2.281)**
-.118 (-2.029)**
R²=.822 1.186 (10.007)***
.135 (2.788)***
.051 (1.498)
-.373 (-7.959)***
.266 (4.644)***
-.208 (-2.089)**
-.124 (-2.121)**
R²=.787 1.401
(10.894)***
R²=.790 .004 (.069)
.006 (.148)
-.054 (-1.057)
.223 (3.589)***
-.541 (-5.022)***
-.212 (-3.361)***
1.405 (10.849)***
.006 (.118)
.008 (.840)
-.069 (-1.349)
.221 (3.541)***
-.537 (-4.950)***
-.211 (3.309)***
R²=.738 -1.387 (-9.652)***
.084 (1.435)
.026 (.622)
-.165 (-2.900)***
-.169 (-2.439)**
.703 (5.835)***
.248 (3.506)***
• The numbers in the Parenthesis are the ratio of parameter estimate to standard error of estimate, where * denotes significance at 10 percent level, ** denotes significance at 5 percent level; *** denotes as significance at 1 percent level.
4.6 Summary and Conclusions for Asia, Southeast Asia, and the Middle East
The hypothesis pertaining to the study of the number of American students studying abroad for x₁, the four other cultural variables, and two regional variables for three regions of the world are as follows:
The alternative hypothesis 1 is accepted for all forms of trade. There is a significant difference in trade performance when sending American students abroad to study. Foreign study abroad increases the trade performance for the United States because Americans get to know a foreign market. A trade deficit shows that not enough Americans were not studying abroad during the time of the study.
The alternative hypothesis 2 is accepted for United States exports and imports. When a country enters the WTO there is a significant difference in trade performance. By entering the WTO and decreasing the power distance between the United States and member countries, international trade increases. The null hypothesis 2 is accepted for balance of trade. There is no significant difference in balance of trade when a country enters the WTO.
The alternative hypothesis 3 is accepted for United States exports and imports. The amount of disputes a country files against member countries of the WTO changes the trade performance of the country, which filed the dispute. In the case of United States exports and imports, the international trade increases. The null hypothesis 3 is accepted for United States balance of trade. The amount of disputes a country files against member countries of the WTO does not change the trade performance of the country, which filed the dispute.
The alternative hypothesis 4 is accepted for all forms of trade. Larger countries show a difference in trade performance than smaller countries. In the case of United States exports, smaller countries buy more United States goods and services than larger countries. In the case of United States imports, larger countries sell more goods and services to the United States than smaller countries. Larger countries are more responsible for creating a trade deficit for the United States than smaller countries.
The alternative hypothesis 5 is accepted for all forms of trade. There is significant difference between the use of a common language shared by two trading partners and their trade performance. For United States exports, English speaking countries are not buying more United
more goods and services to the United States than countries that do not speak English. Countries that speak English are creating a trade surplus. A high level of uncertainty avoidance is good for the United States trade deficit.
The alternative hypothesis 6 is accepted for both Asia and Southeast Asia & Oceania.
There are differences in trade performance due to regional differences. Both Asia and Southeast Asia & Oceania outperformed the Middle East when it came to United States goods and services.
The Middle East created a trade surplus for the United States comparatively.
The hypothesis pertaining to the study of the number of foreign students studying in the United States for x₁, the four other cultural variables, and two regional variables for three regions of the world are as follows:
The alternative hypothesis 1 is accepted for all forms of trade. There is a significant difference in trade performance when receiving students from foreign countries wanting to obtain an education in the United States. As foreign student numbers increase, the international trade of the United States increases. The more students come into the United States to study, the more they get to know the American market. This allows them to sell goods to the United States.
The United States is buying more goods from these countries where students are coming from than it is selling. Therefore, as foreign students come into the country the more the trade deficit increases. Americans should go to obtain an education in these countries to equalize the advantage from understanding a foreign market.
The alternative hypothesis 2 is accepted for United States exports. When a country enters the WTO there is a significant difference in the amount of United States goods and services sold to that country. The sale of United States goods and services increases. The null hypothesis 2 is accepted for United States imports and balance of trade. When a country enters the WTO there is no significant difference in the amount of goods sold to the United States and the balance of trade for the United States.
The null hypothesis 3 is accepted for all forms of trade. The amount of disputes a country files against WTO member countries does not change the trade performance of the country that filed the dispute.
The alternative hypothesis 4 is accepted for United States exports and balance of trade.
Larger countries show a difference in trade performance than smaller countries. Smaller
countries are buying more United States goods and services than larger countries. Smaller countries are creating more of a trade surplus than larger countries. The null hypothesis 4 is accepted for United States imports. Larger countries do not show a difference in the selling of goods and services to the United States than smaller countries.
The alternative hypothesis 5 is accepted for all forms of trade. There is a significant difference in the use of a common language shared by two trading partners and their trade performance. Countries that use English officially are buying more goods from the United States and selling more goods to the United States than countries that do not speak English officially.
Countries that do not speak English officially are creating more of a trade deficit than countries that speak English officially.
The alternative hypothesis 5 is accepted for all forms of trade. There are differences in trade performance due to regional differences. The Middle East is buying more goods from the United States and selling more goods to the United States than Asia or Southeast Asia & Oceania.
The Middle East was creating more of a trade deficit than Asia and Southeast Asia & Oceania.
The R² is higher in Table 12 than in Table 11. The receiving of foreign students by the United States, which becomes than the dominant variable, can explain more of the trade variance than when the amount of Americans studying abroad is used.
More results in Table 1have significance 1when the number of Americans studying abroad is measured as the masculinity variable however the R² is lower. Therefore when masculinity is measured as Americans studying abroad, the explanation of international trade is influenced more by all of the four cultural and regional dimensions.
This is not the case when x₁ is changed to foreign students studying in the United States, Table 12. Here the t ratio is high. X₁ becomes the dominant variable for explaining trade performance with these three regions and the United States. This is evident because in Table 12 the R² get a minimum of five percent higher. The relative importance of the other cultural variables decreases with the exception of x₅. However, the domination of masculinity has implications for all other variables.
Therefore, in these three regions, the use of institutional understanding of the United States market though the use of obtaining an American education is the primary explanation of how the countries in these regions are increasing their trade performance. When it is the
Americans who are trying to learn the institutional framework of the 15 countries under study, it is all five cultural variables that are explaining trade success.
Empirical Results
Europe, Latin America, and Africa
1.7 Americans Study Abroad
The data for the analysis are shown in Table 13 for each of the seven independent variables and the economic performance of the United States over the fiscal period for the years 1990-2004. The times series regression formula used was:
Y= f (xi) = b1*x1+b2*x2+b3*x3+...+b7*x7 + ε
This is focused on three of the regions under study. These regions are Europe denoted as x₆, Latin America denoted as x₇, and Africa used as a baseline. X₁ denotes the number of Americans studying abroad.
The United States was founded by England and has had a long standing relationship with Europe as whole. Europe not only colonized the United States but it also colonized Latin America and Africa. Latin America has been a long time trading partner with the United States as a result of vicinity and Africa has as well even if the only predominant commodity historically used to be slaves.
This regression wants to uncover if cultural change during the 15 year time period can explain changes in trade performance for countries that have had an open market and long standing trade relationships with the United States. This will provide a counter-perspective for the regression run on Asia, Southeast Asia, and the Middle East where long-standing trade partnerships have historically not existed. The results of the regression run on the cultural and regional variables against trade performance of the United States are shown in Table 13.
United States Exports (Y₁ & Y₂)
As the countries in Europe, Latin America, and Africa host Americans students in their countries x₁, the more these countries are buying United States goods and services. This is evident by positive and significant results at the 1 percent level. Inversely, the more these countries are trying to decrease their power distance x₂, the less they are buying United States goods and services. This result is negative and significant at the 5 percent level.
There is no significant relationship between individualism x₃ and the buying of United States goods and services for the regions of Europe, Latin America, and Africa.
The larger the country, the more it is buying United States exports in these regions x₄.
The markets of the countries from these regions have large and open markets.
There is no significant relationship between language x₅ and the explanation of trade performance in relation to the buying of United States exports.
Europe x₆ is buying more United States exports than Africa. This is positive and significant at the 1 percent level. Latin America x₇ is buying more United States goods and services than both Africa and Europe. This result is positive and significant at the 1 percent level.
For United States domestic exports these variables are explaining 63% of the trade performance between these regions and the United States. For United States total exports, they are explaining 62% percent of the trade performance between these regions and the United States.
United States domestic exports are more sensitive to cultural and regional variations than United States total exports.
Y
Y₁₁== ff ((xxii)) = = ..336600**xx11++--..225566**xx22++..005555**xx33++..444411**xx44++--..004444**xx55++..119944**xx66++..330066**xx77++ ++ εε ((66..448855)) ((--22..000022)) ((..994488)) ((44..882255)) ((--..775500)) (2.097) (3.921)
Y₂Y₂== ff ((xxii)) = = ..336666**xx11++--..225588**xx22++..005544**xx33++..434355**xx44++--..004433**xx55++..118866**xx66++..330044**xx77++ ++ εε ((66..446677)) ((--11..998855)) ((..991133)) ((44..668844)) ((--..771188)) (1.978) (3.830)
United States Imports (Y₃ & Y₄)
The more the countries from Europe, Latin America, and Africa host American students to study x₁, the more these countries are selling their goods and services to the United States.
The results are positive and significant at the 1 percent level.
As for general imports CIF (Y₃), the results are negative and significant at the 1 percent level while for general imports CV (Y₄), the results are significant at the 5 percent level.
Countries in these regions that are trying to decrease their power distance x₂ are not selling goods and services to the United States.
There is no significant relationship between individualism x₃ and the buying and selling of goods from Europe, Latin America, and Africa to the United States.
The larger the country in terms of population size x₄, the more it is selling goods or services to the United States. The results are positive and significant at the 1 percent level.
There is no significant relationship between uncertainty avoidance x₅ and the selling of goods to the United States.
Europe x₆, with a result that is significant and positive at the 10 percent level, is selling more goods and services to the United States than Africa. Latin America x₇, with a result that is positive and significant at the 1 percent level and much higher than Europe, is selling the most goods and services to the United States among these regions.
For both types of imports, these variables can explain 56 percent of the trade variance among these regions. General imports in terms of being measured by shipping charges is more sensitive to cultural and regional variables than general imports customs value.
Y
Y₄₄== ff ((xxii)) == ..335522**xx11++--..334455**xx22++..004422**xx33++..448822**xx44++..000066**xx55++..116677**xx66++..332288**xx77++ ++ εε ((55..777700)) (-(-22..446633)) ((..666655)) ((44..883377)) ((..009944)) (1.646) (3.822)
Y
Y₃₃== ff ((xxii)) == ..335500**xx11++--..334466**xx22++..004422**xx33++..448822**xx44++..000077**xx55++..117722**xx66++..333311**xx77++ ++ εε ((55..778833)) ((--22..484888)) ((..666655)) ((44..883377)) (.(.111166)) (1.705) (3.883)
Countries that are hosting American students x₁ are causing a trade deficit for the United States. These countries are selling more goods to the United States then they are buying. The result is negative and significant at the 1 percent level.
Countries that are trying to reduce their power distance x₂ by joining the WTO are creating a trade surplus for the United States. The result here is positive and significant at the 5 percent level.
There is not a significant relationship between the measurement of individualism x₃ by this variable and the explanation of trade performance in relation to balance of trade.
The larger the country is in terms of population x₄ the more it is creating a trade deficit for the United States. The results are negative and significant at the 1 percent level.
There is no significant relationship between the amount of uncertainty avoidance a country is exhibiting x₅ and the explanation of the balance of trade.
Europe x₆ has no significant relationship for balance of trade with the United States but Latin America x₇ is creating a trade deficit with the United States when compared with Africa as the baseline.
The R² for this variable is quite low at .239. Only 24% of the balance of trade of the United States compared with the regions of Europe, Latin America, and Africa are being explained by the cultural and regional variables chosen for this regression.
Y
Y₅₅= = ff ((xxii)) == --..212166 **xx11++..444488**xx22++--..000033**xx33++--..445500**xx44++--..111199**xx55++--..009911**xx66++--..229966**xx77++ ++ εε ((--22..770066)) ((22..444433)) ((--..003388)) (-(-33..442299)) ((--11..441144)) (-.687) (-2.640)