國立臺灣大學工學院土木工程研究所 碩士論文
Department of Civil Engineering College of Engineering National Taiwan University
Master Thesis
加勁擋土牆以含細粒料之回填土在降雨作用下之行為及改善方法評估 Evaluation of Improved Methods for Geosynthetic-Reinforced Soil Walls
with Marginal Backfills subjected to Rainfall
呂昕臻 Hsin-Chen Lu
指導教授:楊國鑫 博士 Advisor: Kuo-Hsin Yang, Ph.D.
中華民國 108 年 7 月
July, 2019
Acknowledgement
首先,向恩師楊國鑫教授致上最高的謝意與敬意,碩士生涯中不斷地引領我 們思考、學習。除了學術方面,老師也以身作則,培養我們做學問及面對問題該 有的嚴謹態度。此外,也謝謝口試委員黃景川教授、洪勇善教授、及方永壽教授 於百忙之中撥冗審閱並提供建議,使本論文更臻完善。
在研究所期間,也很感謝兆偉、名琁、奕新、蔣榮、昕明、Son 等學長姊的 悉心帶領及教導我們各種試驗流程及儀器使用。對研究室的好夥伴建澄、健鈞、
Mark 以及最貼心的學妹們婷苓、昱葵、于萱亦是感激不盡。謝謝你們不惜犧牲 自己念書做研究的時間來幫我一起做實驗,尤其是婷苓,幾乎每一次的實驗都有
你的參與。至於我的實驗夥伴 Mark,非常榮幸能和你一起合作,這兩年來我們
從未知慢慢摸索、解決問題,也精進了自己團隊合作及溝通的能力。除了很高興 能夠在日常生活中有練習英語口說的機會之外,實驗中的重物也很感謝你幫忙搬。
最後,將最深的感謝獻給我最愛的家人。感謝你們在求學過程中全力的支持 關愛,提供衣食無缺的生活,使我能無後顧之憂的專心在研究所課業及實驗。你 們無疑是此論文最大的功臣之一,能夠生在這樣的家庭是如此的幸運。願自己能 在不久的將來對你們獻上最大的回饋。
謹以此論文獻給我最親愛的家人及朋友,並勉勵自己保持積極嚴謹的態度,
朝向未來前進。
呂昕臻 謹誌于 國立台灣大學 土木工程學系 大地組 2018.07
摘要
加勁擋土牆相較於傳統重力式擋土牆為柔性的擋土結構物,因此被視為邊坡 穩定中最好的方法之一。然而為因應台灣地方法規,富含細粒料的現地土壤常被 利用為背填土。當降雨入滲時,背填土基質吸力的喪失以及土壤剪力強度的弱化 都是導致以含細粒料的現地土背填的加勁擋土牆破壞之主因。因此本研究致力於 了解以富含細粒料的土壤為背填土的加勁擋土牆在降雨情況下的行為以及破壞 模式。
本研究進行了一系列以富含細粒料的土壤為背填土的加勁擋土牆之縮尺試 驗,除了了解其在降雨情況下的行為之外,也提出改善的方法供實際應用並探討 其改善之效益。改善方法包含了縮小加勁材間距、使用高滲透係數的回填土、以 及在加勁材界面鋪設薄砂層。試驗中降雨的延時設定使模型加勁擋土牆達到穩定 狀態,或是直到擋土牆完全破壞為止。而在每組試驗中均紀錄了體積含水量、孔 隙水壓、及牆變位;發展出的加勁材應變及土壤剪力也利用實驗後的影像處理來 分析。
研究結果顯示縮小加勁材間距有助於維持模型加勁擋土牆之穩定,並使牆變 位最小化。此外,使用高滲透係數的回填土雖然能有效的避免基質吸力的喪失,
但仍會發展出張力裂縫,同時也使破壞機制轉為較於瞬間的表面淺層破壞。至於 薄紗層的設計則是對以富含細粒料的土壤為背填土的加勁擋土牆在降雨情況下 有相當優良的成效。除了加勁材與背填土之間的摩擦力增加之外,牆體本身受覆 土壓力而變形的程度也因為採用了薄紗層而大幅改善。由於變形量為影響加勁擋 土牆表現之關鍵因素,因此本研究認為在降雨情況下的設計安全係數須因應最大 容許之牆變為來提升。
關鍵字:加勁擋土牆、富含細粒料之背填土、降雨、模型試驗
Abstract
Geosynthetic reinforced soil walls (GRS walls) are considered as one of the best among all slope stabilization methods. However, in-situ soil (marginal backfill) was often adopted to adhere to a local regulation which specifies that the excavated and backfilled soils should be balanced. Loss of matric suction and soil shear strength due to rainfall infiltration is a main cause of the failure of GRS walls with marginal backfill.
A series of reduced scale model tests was performed to investigate the performance of GRS walls with marginal backfill under rainfall conditions and to propose improved methods for practical design. The effects of the three improved methods, namely, reduction of reinforcement spacing, selection of better quality backfill, and adoption of sand cushions, were evaluated. Rainfall duration was set such that the wall model became fully wet or the monitored value reached steady state. The volumetric water content and the pore water pressure were monitored and the wall displacement was recorded throughout the tests. Mobilized reinforcement tensile strain was evaluated and the strain distribution in the wall models was analyzed via post image processing.
The test results indicated that the reduction of reinforcement spacing can effectively improve the stability of the wall; meanwhile, the displacement was diminished. In addition, applying granular backfill can indeed avoid the loss of matric suction; however, tensions cracks or critical failure surface developed suddenly. Finally, the adoption of sand cushions is complementary beneficial to the performance of GRS walls with marginal backfill under rainfall condition. Not only was the interface friction enhanced but the deformation characteristic was improved. The sand cushions also accelerated the dissipation of water.
Keywords: Geosynthetic-reinforced walls; Marginal backfill; Rainfall; Model tests
Table of Contents
Acknowledgement ... III Abstract ... IV Table of Contents ... VI List of Figures ... IX List of Tables ... XIV
Chapter 1 Introduction ... 1
1.1 Research Background and Motivation ... 1
1.2 Research Objectives ... 5
1.3 Research Layout... 5
Chapter 2 Literature Review... 8
2.1 History and Design Methods of GRS Structures ... 8
2.1.1 History... 8
2.1.2 Basic Principles ... 8
2.1.3 Failure Mode and Design of GRS Structures ... 9
2.2 Performance of GRS Structures subjected to rainfall or seepage ... 12
2.2.1 Case Study ... 13
2.2.2 Model Tests ... 17
2.2.3 Full-scale Tests ... 23
2.2.4 Numerical Study ... 24
2.3 Model Tests and Scaling Laws... 26
2.3.1 Similitude Law ... 26
2.3.2 Dimensional analysis ... 28
Chapter 3 Material Testing and Properties ... 31
3.1 Test Layout ... 31
3.2 Soil Physical Properties ... 32
3.2.1 Specific Gravity Test ... 32
3.2.2 Sieve Analysis Test ... 33
3.2.3 Hydrometer Test ... 35
3.2.4 Relative Density Test ... 37
3.2.5 Compaction Test ... 38
3.3 Engineering Properties of Testing Soil ... 40
3.3.1 Constant Head Test ... 40
3.3.2 Falling Head Test ... 41
3.3.3 Consolidated Drained Triaxial Test... 42
3.3.4 Consolidated Undrained Triaxial Test ... 45
3.4 Material Properties of Reinforcement ... 47
3.4.1 Wide Width Tensile Strength Test ... 48
3.4.2 Soil-Geogrid Interface Shearing Strength Test ... 50
Chapter 4 Model Tests and Test Program ... 53
4.1 Model test... 53
4.1.1 Wall model ... 53
4.1.2 Model Preparation ... 59
4.1.3 Improved design measure ... 64
4.2 Instrumentation ... 65
4.2.1 Specifications of the Measuring Devices ... 65
4.2.2 Calibration of the Measuring Devices ... 68
4.2.3 Photography Equipment... 74
4.3 Test Procedures and Test Repeatability... 75
4.3.1 Test Procedures ... 75
4.3.2 Test Repeatability ... 77
4.4 Test Program ... 79
Chapter 5 Results of GRS Walls with Marginal Backfills... 81
5.1 Test Results ... 81
5.1.1 Test SM-Sv9 (Baseline Case) ... 81
5.1.2 Test SM-Sv12 (Increase Spacing) ... 91
5.1.3 Test SM-Sv6 (Reduce Spacing) ... 98
5.2 Effects of Spacing ... 103
Chapter 6 Improved designs ... 110
6.1 Influence of Backfill Quality ... 110
6.1.1 Test SP-Sv9 (Granular Backfill) ... 110
6.1.2 Comparison ... 117
6.2 Effects of Sand Cushions ... 124
6.2.1 Test SM-Sv9-C4 (Adoption of Sand Cushions) ... 124
6.2.2 Comparison ... 131
6.2.3 Test SM-Sv12-C4 (Adoption of Sand Cushions) ... 138
6.2.4 Comparison ... 145
Chapter 7 Conclusions and Recommendations ... 151
7.1 Conclusions ... 151
7.2 Recommendations for Future Study ... 152
References ... 153
Questions and Suggestions from the Panels ... 156
A. Professor Ching-Chuan Huang ... 156
B. Professor Yong-Shan Hung ... 157
C. Professor Yong-Show Fang ... 159
List of Figures
Chapter 1
Figure 1.1 Rainfall induced slope instability ... 1
Figure 1.2 Mechanism of rainfall induced GRS structure failure ... 4
Figure 1.3 GRS wall failure caused by rainfall... 4
Figure 1.4 Research Flowchart ... 7
Chapter 2 Figure 2.1 Failure mechanisms of GRS structures ... 9
Figure 2.2 Normalized coefficient of lateral earth pressure... 10
Figure 2.3 Schematic view of the pullout resistance of the reinforcement ... 12
Figure 2.4 Schematic view of the interlocking effect ... 12
Figure 2.5 Failure mechanisms of GRS walls induced by water ... 14
Figure 2.6 Scenario of the wall failure... 15
Figure 2.7 Pore water pressure distributions at different dates during rainfall .... 16
Figure 2.8 Development of the pore water pressure ... 17
Figure 2.9 Configuration of the model wall... 18
Figure 2.10 Wall deformation modes (a) tilting (b) bulging ... 18
Figure 2.11 Cross-section view of the centrifuge model test instrumentation ... 19
Figure 2.12 Tension cracks inspected during the model tests ... 20
Figure 2.13 Sensor locations in the model tests ... 21
Figure 2.14 Change of PWP and VWC ... 21
Figure 2.15 A photo and the schematic sectional view of the GRS wall ... 22
Figure 2.16 Results (a) wall displacement (b) pore water pressure ... 22
Figure 2.17 Schematic view of the full-scale model ... 23
Figure 2.18 Front view of the full-scale GRS wall ... 24
Figure 2.19 Distribution of PWP after rainfall ... 24
Figure 2.20 Schematic view of sand cushion ... 25
Figure 2.21 Effect of the adoption of sand cushion ... 25
Figure 2.22 Schematic view of a prototype slope and its model ... 28
Chapter 3
Figure 3.1 Material property tests layout ... 31
Figure 3.2 Testing soil: (a) Vietnam quartz sand; (b) Vietnam quartz sand with 20% Kaolinite ... 32
Figure 3.3 Equipment of the pycnometer test ... 33
Figure 3.4 Equipment for the sieve analysis ... 34
Figure 3.5 Grain size distribution curve of Vietnam quartz sand ... 34
Figure 3.6 Apparatus of the hydrometer test ... 36
Figure 3.7 Grain size distribution curve of silty sand ... 36
Figure 3.8 Apparatus for relative density test ... 38
Figure 3.9 Equipment for the compaction test ... 39
Figure 3.10 Compaction curve of the testing soil ... 39
Figure 3.11 Apparatus for permeability tests ... 41
Figure 3.12 Apparatus of the triaxial test ... 43
Figure 3.13 Specimen preparation ... 43
Figure 3.14 Results of the consolidated drained triaxial tests ... 44
Figure 3.15 Results of the consolidated undrained triaxial tests ... 46
Figure 3.16 Photo of testing materials (a) Geotextile facing (b) Geogrid reinforcement ... 47
Figure 3.17 Universal testing machine ... 49
Figure 3.18 Results of the tensile strength test along longitudinal direction ... 49
Figure 3.19 Modified direct shear box ... 51
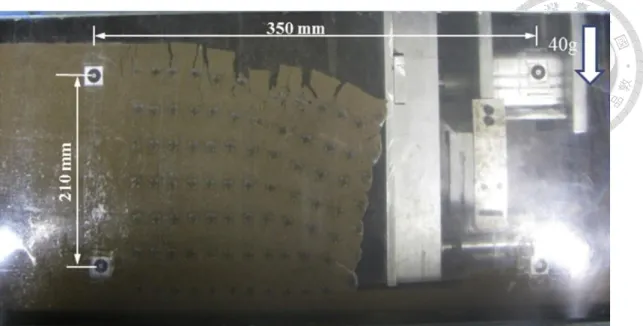
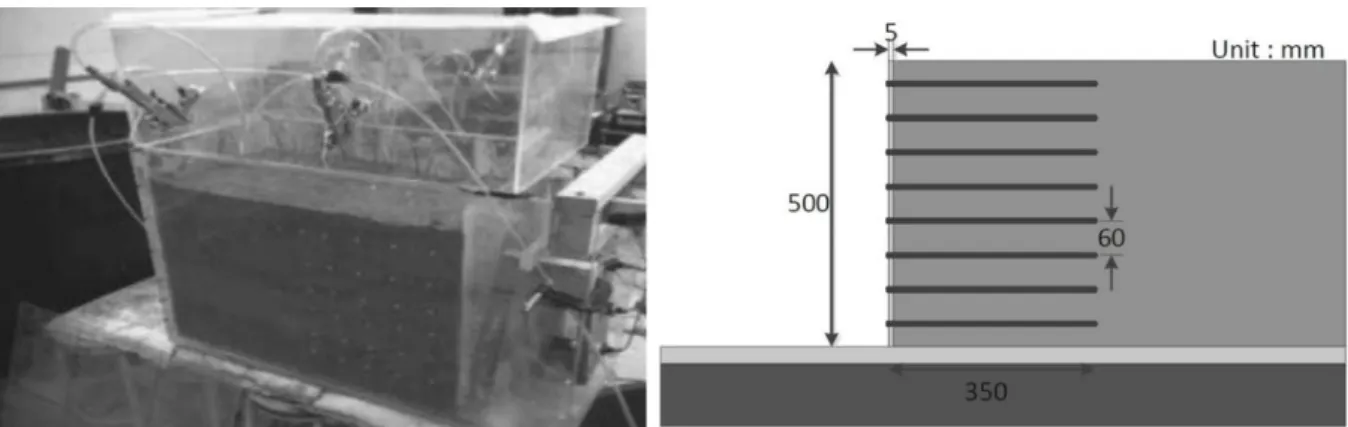
Chapter 4 Figure 4.1 Schematic view of the sandbox and the locations of the sensors ... 53
Figure 4.2 Panorama of the experiment ... 54
Figure 4.3 (a) Irrigation system; (b) Nozzles; (c) Transparent boxes ... 56
Figure 4.4 Schematic view of the function of filter layer ... 59
Figure 4.5 Design of the filter layer ... 59
Figure 4.6 Blue Styrofoam mold used for construction ... 61
Figure 4.7 Tools used for construction: (a) Angle sleeker; (b) Concrete trowel .. 62
Figure 4.8 (a) Hammer; (b) Filter layer; (c) Scarifying between layers ... 62
Figure 4.9 Model GRS wall after construction ... 63
Figure 4.10 Design of sand cushion ... 64
Figure 4.11 (a) Pore water pressure transducer; (b) Data logger; (c) Signal amplifier ... 66
Figure 4.12 Schematic view of the data acquisition system ... 66
Figure 4.13 (a) Volumetric water content gauge (b) EM 50 data logger ... 68
Figure 4.14 DPI 601 portable pressure calibrator ... 69
Figure 4.15 Calibration curve of pore water pressure transducer 1 ... 70
Figure 4.16 Calibration curve of pore water pressure transducer 2 ... 70
Figure 4.17 Calibration curves of VWC gauges for pure sand ... 72
Figure 4.18 Calibration curves of VWC gauges for silty sand ... 73
Figure 4.19 Photography equipment: (a) GoPro 4; (b) Canon EOS 800D ... 74
Figure 4.20 Pictures of tests SM-Sv9: (a) Experimental group; (b) Control group ... 78
Figure 4.21 Variation of VWC throughout the test ... 78
Figure 4.22 Wall displacement profile ... 79
Chapter 5 Figure 5.1 Pictures of the model test SM-Sv9 ... 83
Figure 5.2 VWC with time elapse ... 84
Figure 5.3 Picture of the cracks ... 85
Figure 5.4 Wall displacement profile ... 86
Figure 5.5 Maximum wall displacement and settlement versus time ... 87
Figure 5.6 Reinforcement tensile strain and comparison of potential sliding surface ... 89
Figure 5.7 Maximum reinforcement tensile force profile ... 89
Figure 5.8 Pictures of the model test SM-Sv12 ... 91
Figure 5.9 Collapse of the wall ... 92
Figure 5.10 VWC with time elapse ... 93
Figure 5.11 Wall displacement profile ... 94
Figure 5.12 Maximum wall displacement and settlement versus time ... 95
Figure 5.13 Reinforcement tensile strain and comparison of potential sliding surface ... 96
Figure 5.14 Maximum reinforcement tensile force profile ... 97
Figure 5.15 Pictures of the model test SM-Sv6 ... 98
Figure 5.16 VWC with time elapse ... 99
Figure 5.17 Wall displacement ... 100
Figure 5.18 Reinforcement strain ... 101
Figure 5.19 Maximum reinforcement tensile force profile ... 102
Figure 5.20 Pictures of tests: (a) SM-Sv6; (b) SM-Sv9; (c) SM-Sv12 ... 103
Figure 5.21 Factor of safety under different reinforcement spacing ... 104
Figure 5.22 Wall displacement profile under different reinforcement spacing . 105 Figure 5.23 Maximum wall displacement versus time ... 106
Figure 5.24 Maximum reinforcement tensile force profile ... 107
Figure 5.25 FSbreakage versus maximum displacement and reinforcement tensile
strain ... 108
Chapter 6 Figure 6.1 Pictures of the model test SP-Sv9 ... 111
Figure 6.2 VWC with time elapse ... 112
Figure 6.3 Wall displacement profile ... 113
Figure 6.4 Maximum wall displacement and settlement versus time ... 114
Figure 6.5 Reinforcement tensile strain and comparison of potential sliding surface ... 115
Figure 6.6 Maximum reinforcement tensile force profile ... 116
Figure 6.7 Pictures of the tests: (a) SM-Sv9; (b) SP-Sv9 ... 117
Figure 6.8 Wall displacement profile ... 119
Figure 6.9 Maximum wall displacement versus time ... 119
Figure 6.10 Reinforcement tensile strain ... 120
Figure 6.11 Maximum reinforcement tensile force profile ... 121
Figure 6.12 Strain contour from PIV analysis: (a) SM-Sv9; (b) SP-Sv9 ... 122
Figure 6.13 Pictures of the model test SM-Sv9-C4 ... 125
Figure 6.14 VWC with time elapse ... 126
Figure 6.15 Wall displacement profile ... 127
Figure 6.16 Maximum wall displacement and settlement versus time ... 128
Figure 6.17 Reinforcement tensile strain and comparison of potential sliding surface ... 129
Figure 6.18 Maximum reinforcement tensile force profile ... 130
Figure 6.19 Pictures of tests: (a) SM-Sv9; (b) SM-Sv9-C4 ... 131
Figure 6.20 Wall displacement profile ... 132
Figure 6.21 Maximum wall displacement versus time ... 133
Figure 6.22 Reinforcement tensile strain ... 134
Figure 6.23 Maximum reinforcement tensile force profile ... 135
Figure 6.24 Strain contour from PIV analysis: (a) SM-Sv9; (b) SM-Sv9-C4 ... 136
Figure 6.25 Pictures of the model test SM-Sv12-C4 ... 139
Figure 6.26 VWC with time elapse ... 140
Figure 6.27 Wall displacement profile ... 141
Figure 6.28 Maximum wall displacement and settlement versus time ... 142
Figure 6.29 Reinforcement tensile strain ... 143
Figure 6.30 Maximum reinforcement tensile force profile ... 144
Figure 6.31 Pictures of tests: (a) SM-Sv12; (b) SM-Sv12-C4 ... 145
Figure 6.32 Wall displacement profile ... 146
Figure 6.33 Maximum wall displacement versus time ... 147
Figure 6.34 Reinforcement tensile strain ... 148
Figure 6.35 Maximum reinforcement tensile force profile ... 149
List of Tables
Chapter 1
Table 1.1 Slope stability measures and application ... 3
Chapter 2 Table 2.1 Correction factor of the reinforcement extensibility of different materials ... 12
Table 2.2 Generic causes of mechanically stabilized earth failure ... 13
Table 2.3 Common scaling factors for modeling of GRS structures ... 30
Chapter 3 Table 3.1 Results of the pycnometer test ... 32
Table 3.2 Results of the sieve analysis ... 35
Table 3.3 Results of the relative density test of sand ... 38
Table 3.4 Results of the permeability tests ... 42
Table 3.5 Result of the consolidated undrained triaxial test ... 45
Table 3.6 Basic properties of the reinforcement ... 47
Table 3.7 Test results of the tensile strength test along longitudinal direction ... 48
Table 3.8 Results of the soil-geogrid interface direct shear test ... 51
Table 3.9 Material properties of testing soil and reinforcement ... 52
Chapter 4 Table 4.1 Reduced-scale model parameters ... 55
Table 4.2 Rainfall uniformity in preceding studies ... 57
Table 4.3 Specifications of WGA-670A amplifier ... 67
Table 4.4 Specifications of USB-6218 data logger ... 67
Table 4.5 Specifications of the photography equipment ... 75
Table 4.6 Test program ... 80
Chapter 5 Table 5.1 Summary of test results ... 109
Chapter 6 Table 6.1 Factor of safety ... 117
Table 6.2 Summary of test results ... 123
Table 6.3 Factor of safety ... 131
Table 6.4 Summary of test results ... 137
Table 6.5 Factor of safety ... 145
Table 6.6 Summary of test results ... 150
Chapter 1 Introduction
1.1 Research Background and Motivation
In recent years, global warming has been considered as one of the greatest threats to earth; it not only causes the rise of sea levels but also changes the pattern of precipitation.
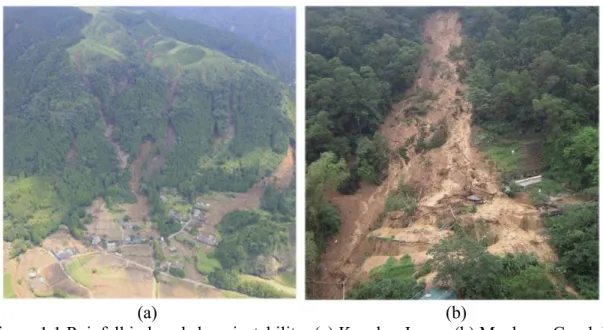
From a geotechnical engineering standpoint, the pattern of precipitation, which has a trend of becoming more and more extreme, is of great concern. More specifically, a high- intensity rainfall in a flash or a long-lasting rainfall became frequent occurrence. The above-mentioned situation has caused slope stability issues around the world and has caused catastrophic damage. Figure 1.1 shows some pictures of slope stability problems induced by rainfall.
(a) (b)
Figure 1.1 Rainfall induced slope instability: (a) Kyushu, Japan; (b) Maokong Gondola Various measures have been taken to stabilize the slopes, as shown in Table 1.1.
Factors such as the mode of failure, the feasibility of construction, the effect of stabilizing, and the eco-friendliness should be considered upon designing. Conventional RC structures can be easily controlled to satisfy the requirement of the quality and can
detrimental to the environment but they also restrain much of the deformation, causing abrupt failure. Contrarily, geosynthetic reinforced soil (GRS) structures can provide significant enhancement on the slope stability; meanwhile, the tolerance of the deformation is dramatically improved due to the flexibility of the GRS structures.
Therefore, GRS structures, having the advantages of eco-friendliness, high tolerance of deformation, and eloquent reduction in the risk of sudden collapse, are considered as one of the best measures to stabilize the slopes (Wu and Chou, 2013).
With various advantages, GRS walls are widely used all over the world for slope stabilization. However, the application of GRS structures has certain limitations. The use of good quality backfills with high permeability (i.e., pure sand) is indeed satisfactory.
Nevertheless, for the cut down of the cost and the convenience of the construction, in-situ soil is often used as backfills. Additionally, in-situ soil was adopted to adhere to a local regulation which specifies that the excavated and backfilled soils at the construction site should be balanced. In-situ soil, considered as marginal backfill, consists of sand and fines contents. Marginal backfill has little capacity for drainage. Loss of matric suction and soil shear strength due to the infiltration of rainfall has long been one of the main causes of the failure of GRS walls. Figure 1.2 enunciates the mechanism and process of a GRS slope failure triggered by rainfall. Among all types of failures, rainfall holds the largest portion of the causes. Figure 1.3 presents some failure cases of GRS structures caused by rainfall. According to preceding studies, up to 60% of GRS wall failure was caused by water (Koerner and Koerner, 2013). Intense rainfall had then been identified as the most critical natural factor on slope stability (Wu et al., 2013). Hence, investigating the performance of slopes under rainfall condition and stabilizing the slopes is mandatory.
This study purports to evaluate the performance of GRS walls with marginal backfills and propose remedial measures by using different backfill or configurations.
Table 1.1 Slope stability measures and application Construction
method Method illustration Applications and advantages
GRS structures
Applications:
1. Embankment
2. Repairment measures Advantages:
1. Flexibility 2. Eco-friendly
Ground anchor with RC grid beam
Applications:
1. Gentle slope 2. Dip slope Advantages:
1. Time-saving 2. Vegetation in grid
RC grid beam
Applications:
1. Uneven slope 2. Steep slope Advantages:
1. Slope-adjusted 2. Vegetation in grid
RC retaining wall
Applications:
1. Excavation toe stability 2. Landfill stability Advantages:
1. Durable
2. Concrete can be controlled and meet requirements
Shotcrete
Applications:
1. Steep slope
2. No-vegetation slope Advantages:
1. Fill the discontinuity of slope surface
Figure 1.2 Mechanism of rainfall induced GRS structure failure
Figure 1.3 GRS wall failure caused by rainfall (Wu and Chou, 2013)
1.2 Research Objectives
This research carried out a series of reduced scale model tests of GRS walls subjected to rainfall. The performance of GRS walls with marginal backfill was investigated. Various improved methods concerning different backfills and configurations were also evaluated. The target of this research is to pursue the following:
To investigate the hydraulic performance and failure mechanism of GRS walls subjected to rainfall.
To evaluate the effects of different backfills and configurations on GRS walls under rainfall condition.
To propose improved measures for practical design of GRS walls with marginal backfills against rainfall.
1.3 Research Layout
This thesis presents a study on GRS walls with marginal backfills subjected to rainfall and proposed improved measures for practical design. The performance of GRS wall subjected to rainfall is discussed in terms of pore water pressure, volumetric water content, the reinforcement strain, and the wall displacement. Figure 1.4 illustrates the research flow chart of the thesis, including the above introduction. The thesis is organized as follows:
Chapter 1 introduces the background, motivation, and objectives of this research.
Additionally, the layout of this research is provided herein.
Chapter 2 presents the literature review including the introduction of geosynthetic reinforced structures, the scaling laws for conducting model tests, and the investigation
Chapter 3 elaborates the testing of material properties, which involves the physical and engineering properties of the testing soil, and the material properties of the reinforcement used in this study.
Chapter 4 presents the reduced scale model tests, including the design of the experiments, the apparatus used in this study, and the detailed procedure of the model tests.
Chapter 5 discusses the results in terms of the volumetric water content, wall displacement, and the strain of the reinforcement. Comparison of the performance of GRS walls with marginal backfill under different reinforcement spacing is presented.
Chapter 6 provides the results of the improved design. Evaluation of the influence of different backfill materials and design configurations on the performance of GRS wall was also presented.
Chapter 7 draws to the conclusions of this research and proposes recommendations and suggestions for future study and practical application.
Chapter 2 Literature Review
2.1 History and Design Methods of GRS Structures
2.1.1 History
The concept of reinforced soil came into existence centuries ago in ancient China and western countries. The Great Wall which was built in 200 B.C. is a well-known example of geosynthetic reinforced structure. The geosynthetics used to build the Great Wall includes willow and reed. The conceptualization of geosynthetic reinforced structures was not discovered until Henry Vidal, an engineer from France, got inspired from observing how a bird builds its nest in the 1960s. He proposed a way of constructing GRS walls by using sandy soil as the backfill, steel sheets as the reinforcement, and concrete plate as the facing. Through unremitting efforts, the GRS wall system has been promoted successfully and has gained recognition among the geotechnical engineering field (Chou et al., 2016).
2.1.2 Basic Principles
Geosynthetic reinforced structures are combinations of soil and geosynthetics which have tensile strength. Because of the overburden pressure and the self-weight of the soil, there exists a frictional force between the soil and the geogrid when there is a relative displacement. The geosynthetic will thus be subjected to a tensile force. Therefore, the overall stability and the shear strength of the reinforced soil increase with the increase of the apparent adhesion and the confining pressure of the reinforced soil, which results from the geosynthetics’ resistance to tensile force. Additionally, the interlocking effect between the soil particles and the openings of the geosynthetics mobilizes the resistance force.
With the application of geosynthetics, the soil wall is able to resist much more tensile
2.1.3 Failure Mode and Design of GRS Structures
The failure mechanisms of the GRS structures, as shown in Figure 2.1, can be classified into two categories, namely, internal and external failure. Internal failure includes breakage, pullout, and connection of the reinforcement while external failure involves failure of sliding, bearing capacity, and overturning. The designing regulations for GRS structures, for example, FHWA, ASSHTO, and NCMA take the failure mechanisms into consideration. Breakage and pullout failure of the reinforcement are enunciated in the following sections. The failure mechanisms of external failure will not be elaborated since they are similar to that of the general retaining walls.
Figure 2.1 Failure mechanisms of GRS structures A. Reinforcement Breakage Failure
According to the designing regulations of the Federal Highway Administration (FHWA, 2009), the maximum tensile force that could be mobilized in a single layer can be estimated in Equation 2.1:
)
max k S ( z q
K
T K a v
a
r
(2.1)
5 . 1
max
T
FS Tal (2.2)
where Tmax = maximum tensile force that could be mobilized, Kr/Ka = normalized coefficient of lateral earth pressure, ka = coefficient of lateral earth pressure, Sv = spacing of the reinforcement, γ = unit weight of the backfill soil, z = depth from the crest of the wall, and q = surcharge. This equation is based on the assumption that the earth pressure behind the retaining wall and the mobilized maximum tensile force has reached static equilibrium. Moreover, the normalized coefficient of lateral earth pressure Kr/Ka varies with different types of reinforcement and the depth from the crest of the wall, as shown in Figure 2.2. If a reinforcement with high extensibility was used, and the deformation is large enough the cause active failure, Kr/Ka will keep a constant value of 1.0. Therefore, to prevent the geosynthetic from breakage failure, the allowable tensile force, Tal, has to be at least 1.5 times larger than the mobilized tensile force, Tmax, as shown in Equation 2.2:
Figure 2.2 Normalized coefficient of lateral earth pressure (FHWA, 2009) Kr/Ka
B. Reinforcement Pullout Failure
The pullout resistance of the reinforcement can be estimated using Equation 2.3, Equation 2.4, and Equation 2.5, given by the Federal Highway Administration (FHWA, 2009):
Pr = c F*α σv Le (2.3)
F* = 2
3tan ϕ (2.4)
5 . 1
max
T
FS Pr (2.5)
where Pr = pullout resistance force of the reinforcement, c = effective unit perimeter of the reinforcement, F* = pullout resistance factor of the reinforcement, α = correction factor of the reinforcement extensibility, σv = vertical overburden pressure above the reinforcement, and Le = embedded length of the reinforcement.
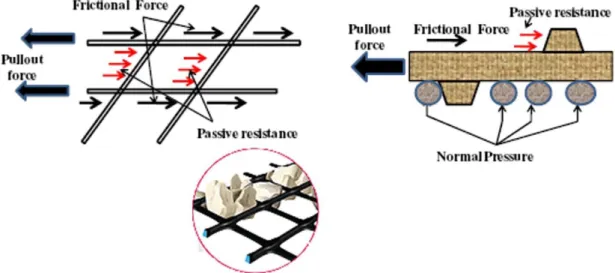
It can be clearly seen from Figure 2.3 that the pullout resistance force of the reinforcement, Pr , develops from the frictional force of both two sides (c = 2 ) of the embedded reinforcement Le . Additionally, the correction factor of the reinforcement extensibility α varies with different types of reinforcement and the values are summarized in Table 2.1. Regarding the coefficient of the pullout resistance of the reinforcement F*, the frictional force between the soil and the reinforcement along with the passive resistance between the soil particles and the reinforcement are what cause so.
Figure 2.4 presents the schematic picture of the mechanism of the interlocking effect. The value of F* can be obtained by conducting wide width tensile strength test or by Equation 2.4, where ϕ is the friction angle of the backfill soil. In order to prevent the reinforcement from pullout failure, the pullout resistance force of the reinforcement, Pr, should be larger than 1.5 times of the maximum tensile force that could be mobilized,
Table 2.1 Correction factor of the reinforcement extensibility of different materials (FHWA, 2009)
Reinforcement Type Correction Factor α
Metallic 1.0
Geogrid 0.8
Geotextile 0.6
Figure 2.3 Schematic view of the pullout resistance of the reinforcement
Figure 2.4 Schematic view of the interlocking effect
2.2 Performance of GRS Structures subjected to rainfall or seepage
Past studies indicated that intense rainfall is the primary natural cause for the observed failure cases (Table 2.2). Thus, various studies have been carried out to inspect
the performance of geosynthetic reinforced walls subjected to rainfall. Rainfall-induced pore water pressure accumulation and development inside the GRS structures caused excessive deformation, local, or overall failure. Aside from case studies, model tests have been conducted to evaluate the performance of GRS walls subjected to rainfall. Factors such as the rainfall intensity, rainfall duration, the quality of the backfill, and the reinforcement configurations are all critical to the stability of the wall. Details of the case studies and model tests are discussed in subsequent sections.
Table 2.2 Generic causes of mechanically stabilized earth failure (Wu et al., 2013)
Primary causes Subsets
Natural influences Intense rainfall Strong earthquake
Technical errors Inadequate project planning and site exploration
Erroneous analysis and design Material deficiencies
Poor construction quality
Improper service and maintenance
2.2.1 Case Study
Koerner investigated 171 failed mechanically stabilized earth (MSE) walls with geosynthetic reinforcement (Koerner and Koerner, 2013). It was noted that among all failed cases, 60% were caused by internal or external water. In addition, silt and clay soil types were used as backfill materials in 61% of the failure cases. The reason for the use of fine-grained soils is felt to be their availability at a low cost in comparison to the cost of sands and gravels which usually have to be imported to the site. The concern over and critical issue of using such fine-grained soils is that they have low to extremely low hydraulic conductivity. This can be properly handled by proper design; however, the research stated that water within, behind, or beneath the reinforced zone which can mobilize hydrostatic pressure are rarely accounted for in the design process. Figure 2.5
presents the failure mechanisms induced by internal and external water. More failure cases were investigated and were thoroughly discussed subsequently.
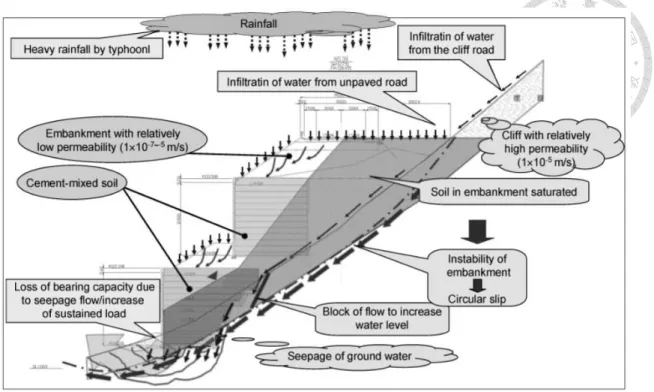
Figure 2.5 Failure mechanisms of GRS walls induced by water (Koerner and Koerner, 2013) The western part of Japan was struck by Typhoon No. 23 in October 2004.
Infrastructures over a wide area in Kansai were damaged severely. The accumulated rainfall was 226 mm while the maximum intensity was 10 mm/hr. Shibuya et al. (2007) investigated a failure of a large reinforced earth wall with a maximum height of about 23 meters that took place in a mountainous area. Figure 2.6 enunciates the scenario of the wall failure. The backfill material has a fines content larger than 25%. The wall failure may be attributed to simultaneous occurrence of several causes, including the concentration of in-soil seepage and surface water that flows into the failure zone, the relatively low permeability of the embankment, the poor drainage behind the wall, and the softening characteristic of the foundation soil as sheared undrained. It was concluded that drainage system should take care not only the wall but also the embankment behind and the wall should be placed on a foundation with larger bearing capacity (i.e., rock with SPT N-value larger than 50). Additionally, the short-term stability analysis of the wall should be employed considering the undrained condition upon designing.
Figure 2.6 Scenario of the wall failure (Shibuya et al., 2007)
An excavated steep slope reinforced by geogrids was studied by Liu et al. (2012). A section of the slope collapsed soon after July 2, 2004, when Typhoon Ming-Du-Li passed over Taiwan. Heavy rainfall with maximum intensity at 166.5 mm/hr and 503 mm accumulated rainfall was recorded at a nearby precipitation station. The field observations led to the conclusion that the failure was closely related to rainfall. An impermeable clay layer was found underlying the reinforced slope. Moreover, the backfill was identified to have fines content of up to 42%. When abundant rainfall infiltrated into the reinforced slope, the infiltration obstructed by the impermeable clay and fine contents began to generate significant transient water pressure. The research indicated that the continuous rainfall led to the accumulation of pore water pressure in the GRS slope, followed by the loss of matric suction and soil shear strength; failure commenced subsequently.
Yoo et al. (2006) analyzed a failure of a geosynthetic reinforced segmental retaining wall that collapsed during a monsoon season in Korea. The local meteorological study indicated that the total precipitation was approximately 780 mm, which was rather higher than normal. The rainfall intensity was registered with a maximum rate of 155 mm/day.
Laboratory tests pointed out that the backfill, completely decomposed granite soil, contains over 30% of fines. Finite element analysis was additionally conducted to examine pore water pressures in the soil. The results of the pore water pressure distributions during the rainfall period are presented in
Figure 2.7. The subsequent rather intense rainfall brought the matric suctions in the reinforced zone further down to single digit values upon the ceasing of rainfall. Also noted is the rise of the groundwater table above the wall base. The investigation revealed among other things that the low-quality backfill was mainly responsible for the wall failure, and the primary triggering factor was the rainfall infiltration.
Figure 2.7 Pore water pressure distributions at different dates during rainfall period (Yoo and Jung, 2006)
Yang et al. (2019) presented a comprehensive failure investigation of a GRS slope subjected to rainfall. The slope was 26-m high with four layers of geogrid reinforcement.
The backfill soil contains more than 60% of fines and is considered as silty clay. Excessive deformation induced by heavy rainfall after typhoons were observed. The slope was pushed by the deformed weathered sandstone at the back and eventually collapsed in 2013 due to the accumulation of the rainfall (600mm). Figure 2.8 presents the development of the PWP along with the rainfall patterns. It was concluded that PWP was able to accumulate in the slope owing to the low draining capacity of the marginal backfill.
Moreover, drainage system with flexible joints should be adopted in marginal backfilled GRS walls since excessive slope could occur upon the infiltration of rainfall.
Figure 2.8 Development of the pore water pressure (Yang et al., 2019) 2.2.2 Model Tests
A series of centrifuge model tests was performed to simulate the poor drainage condition of a GRS wall after several days of heavy raining (Chen et al., 2007). The configuration of the model wall is presented in Figure 2.9. Clayey soil from Linkou area and a combination of geotextile with polymeric grids are used as the backfill and the
23%, and 42%, respectively, and was classified as CL according to the USCS. The ultimate tensile strength of the reinforcement was 1.62 kN/m. Figure 2.10 shows the wall deformation modes found during the experiments. Various reinforcement arrangement was adopted to investigate the performance of the GRS wall under the worst climatic conditions. The results showed that GRS walls can be stable even in the worst climatic conditions if an appropriate reinforcement configuration is introduced. Specifically, decreasing the reinforcement spacing is much more effective than increasing the reinforcement length in terms of alleviation of wall displacements.
Figure 2.9 Configuration of the model wall (Chen et al., 2007)
Figure 2.10 Wall deformation modes: (a) tilting; (b) bulging (Chen et al., 2007)
Centrifuge model tests were further conducted to convince the statement that the loss of interfacial shear resistance due to wetting of backfill is one of the possible reasons responsible for GRS wall failures (Balakrishnan and Viswanadham, 2016). A marginal soil with 21% fines was chosen as the backfill in the study. The testing soil had a maximum dry unit weight of 17.3 kN/m3 and a friction angle of 34˚. Geogrid was used as the reinforcement; notably, a thin non-woven geotextile was stuck to geogrid in the facing portion to prevent soil particles coming out of geogrid openings. Figure 2.11 shows the instrumentation of the model tests. Excessive wall displacements were found and tension cracks were observed to take place right behind the reinforced zone if the reinforcement strength was not enough, as shown in Figure 2.12.
Figure 2.11 Cross-section view of the centrifuge model test instrumentation (Balakrishnan and Viswanadham, 2016)
Figure 2.12 Tension cracks inspected during the tests (Balakrishnan and Viswanadham, 2016)
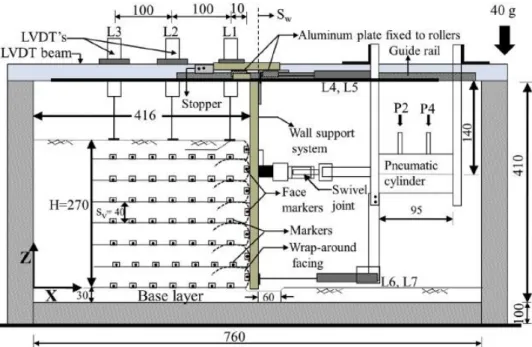
Gallage et al. (2012) conducted model tests of GRS slopes with different slope angles subjected to rainfall. The backfilled silty sand which contains 17% fines content had a maximum dry density and a specific gravity of 1.725 g/cm3 and 2.75, respectively.
The slopes were subjected to rainfall with an approximate intensity of 40 mm/hr. Figure 2.13 presents the location of the sensors and Figure 2.14 shows the change of the pore water pressure and the volumetric water content throughout the test. The results indicated that the slopes with the inclination larger than the friction angle of the backfill can be stable until the suction was decreased by the infiltration of the rainwater into the slope;
failures in slopes with gentler inclination were initiated by the development of the positive pore water pressure near the toe and is rather slow and progressive. Both results led to the conclusion that rainfall infiltration is a critical factor to the wall stability.
Figure 2.13 Sensor locations in the model tests (Gallage et al., 2012)
Figure 2.14 Change of PWP and VWC (Gallage et al., 2012)
Yoo et al. (2013) carried out a series of model tests to investigate the effect of rainfall in the performance of geosynthetic reinforced soil wall. The schematic sectional view and a photo of model GRS wall are shown in Figure 2.15. Decomposed granite soil (DGG) and non-woven geotextile were used as the backfill soil and
with a maximum unit weight of 19 kN/m3. A rainfall intensity of 56.2 mm/hr and total given precipitation of 450 mm were adopted. The results of the laboratory tests are presented in Figure 2.16; 1 mm wall displacement was measured while the pore water registered during the wetting period was as great as 4 kPa. The research suggested that the cycles of wetting and drying associated with a heavy rainfall may induce additional wall displacement and reinforcement strains in GRS walls. It can be concluded that the rainfall intensity is a governing factor for the performance of a GRS wall during rainfall infiltration.
Figure 2.15 A photo and the schematic sectional view of the GRS wall (Yoo et al., 2013)
(a) (b)
Figure 2.16 Results: (a) wall displacement; (b) pore water pressure (Yoo et al., 2013)
2.2.3 Full-scale Tests
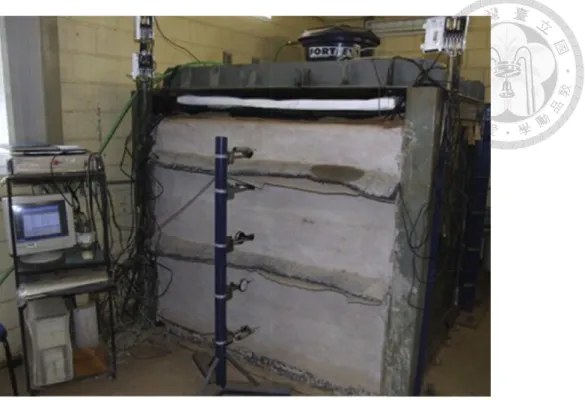
Full-scale laboratory model tests concerning the effect of rainfall infiltration were also carried out by Portelinha et al. (2013) and Portelinha and Zornberg (2017). Figure 2.17 presents the schematic view of the model wall and Figure 2.18 shows a full scale GRS wall test, done to monitor the hydraulic and mechanical responses. The model wall was 1.8 m and 1.55 m in height and width respectively. The backfill material includes 44% fines and has a saturated hydraulic conductivity of 4.9 10-7 m/s. A polyester needle- punched nonwoven geotextile was used as reinforcement to provide tensile strength and drainage. Vertical spacing of 30 cm was adopted in the study. The results illustrated that nonwoven geotextiles did provide internal drainage, which diverted approximately 25%
of the water volume. Additionally, the infiltration of the rainfall led to a significant increase in reinforcement strains and wall displacement. In particular, the increase was caused by pore water accumulation, which resulted in an increase in the unit weight of the backfilled soil.
Figure 2.18 Front view of the full-scale GRS wall (Portelinha and Zornberg, 2017)
2.2.4 Numerical Study
Bhattacherjee and Viswanadham (2015) discussed the effect of geosynthetic reinforcement to slopes under rainfall conditions. Numerical simulation was performed with the rainfall duration of 24 hours and the intensity of 2-80 mm/hr. Figure 2.19 presents the distribution of the PWP after rainfall in unreinforced and reinforced slope. The study concluded that reinforcement can provide drainage, restrain wall displacement, and enhance the wall stability.
Figure 2.19 Distribution of PWP after rainfall (Bhattacherjee and Viswanadham, 2015)
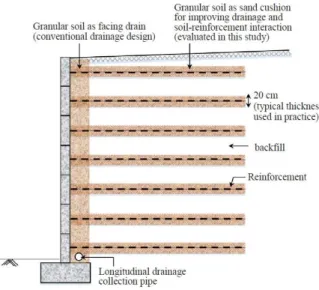
Consider the failure mechanisms of marginal backfilled GRS walls, Yang et al. (2018) and Thou et al. (2015) proposed sand cushion as the improved method for marginal backfilled GRS walls. The schematic view of sand cushion is shown in Figure 2.20. The application of sand cushion can increase the interface friction between the soil and the geogrid. Moreover, the sand cushion can provide drainage functions which can effectively enhance the slope stability of GRS walls. The system stability increased with the increase of sand cushion thickness; however, the function of sand cushion reached a maximum value when about 20% of marginal backfill was replaced with sand as sand cushions.
Figure 2.21 presents the effect of the adoption of sand cushions in a model GRS wall.
Figure 2.20 Schematic view of sand cushion (Yang et al., 2018)
Preceding studies, including field investigation and laboratory tests, drew to the conclusion that the behavior of GRS walls is closely related to the matric suction of the backfilled soil. Furthermore, rainfall infiltration led to the accumulation of the pore water pressure, followed by the loss of matric suction and soil shear strength. In addition, the decrease of the interface shear strength resulted from rainfall infiltration is one of the causes of GRS wall failures. However, the application of geosynthetics can provide effective reinforcement to the wall; meanwhile, the displacement of the wall is successfully alleviated. Most importantly, geosynthetics is capable of dissipating the pore water pressure, which is critical to the wall stability.
2.3 Model Tests and Scaling Laws
Model tests are purported to the understanding of the mechanical behavior in the prototype by investigating the results from small scale physical models with a reduced number of variables. Both similitude law and dimensional analysis play important roles in the reduced scale model tests; it assures the feasibility and reliability of the test results.
The similitude law and dimensional analysis will be introduced in the subsequent sections.
The use of dimensional analysis on important variables of this research is also discussed.
2.3.1 Similitude Law
Model tests are designed to understand the mechanical behavior of the prototype by constructing a reduced scale model of the prototype to simulate the true performance of the prototype. The similitude law defines the relationship between the physical quantities of the model and those of the prototype. The similitude law states that the relation between the model and the prototype should satisfy three similarities, namely, geometric similarity, kinematic similarity, and dynamic similarity (Langhaar, 1951).
The similarity of the shape of the model and prototype is considered as the geometric similarity. More specifically, all the corresponding parts of the model and the prototype should be the same. Geometric similarity can be expressed in Equation 2.6:
m p
L
L (2.6)
where L = length, subscript p is the prototype, subscript m is the model, and λ = scaling factor. Figure 2.22 is a schematic view of a slope in the prototype and its model.
The ratios of the slope height H in the prototype to that in the model and the ratio of the length of the slope L in the prototype to that in the model are constants λ. Besides, the slope angle θ is the same in both the prototype and the model. Thus, Figure 2.22 satisfies the geometric similarity.
The kinematic similarity indicates a status where the motion and the displacement in the prototype are similar to that in the model. Likewise, the dynamic similarity denotes the similarity of the forces acting on the prototype slope and the model slope. The dynamic similarity would be satisfied once the ratio of forces acting on corresponding points or surfaces of the prototype and the model remains constant. Figure 2.22 also meets dynamic similarity since the ratio of the driving forces, Fdp and Fdm, in the prototype and the model respectively, and the ratio of the resistance forces, Frp and Frm , are constant.
Figure 2.22 Schematic view of a prototype slope and its model (Chen and Chi, 2010)
2.3.2 Dimensional analysis
Dimensional analysis plays a vital role in the process of conducting a model test.
Variables needed for the analysis can be reduced to the target variables by decomposing them into several dimensionless products. The concept of the dimensional analysis is based on the Buckingham’s Theorem (Buckingham, 1914), which states that if there is a function independent to the basic unit dimensions, then it can be written into several dimensionless products. The theorem can be expressed as Equation 2.7 and 2.8:
Φ(Π1,Π2,⋯Πn-k) = 0 (2.7)
Π1 = ϕ(Π2,⋯Πn-k) (2.8)
where k = number of fundamental dimensions required to describe the n variables, Π
= independent quantities of groups that can be expressed. For example, assume Π1, Π2,⋯Πn-k are physical quantities, let Π1 be length, Π2 be mass, and Π3 be time. Π1, Π2, and Π3 are three independent basic unit dimensions (r = 3). In this case, the other (n - 3) variables (i.e., force and velocity) can be expressed by dimensionless products of Π1, Π2, and Π3 (Langhaar, 1951).
This research aims to understand the performance of GRS walls under rainfall condition. Thus, the scaling down of the rainfall, which is referred to as the quantity of flow, is considered as the most important issue. Let the quantity of flow, q (volume per unit time), be a function of several independent variables, as Equation 2.9 (Cargill and Ko, 1983):
) , , , , , ,
(
f l A H g
q (2.9)
where l = length over which the potential difference in head, ΔH, is dissipated, A = cross-sectional area of the soil mass conducting the flow, g = gravitational constant, κ
= soil physical permeability, ρ = mass density of the fluid and μ = fluid viscosity.
Subsequently, let the representative dimensions be ρ, l, and g for mass (M), length (L), and time (T) , respectively, using the recurring set of the equations we can obtain a relationship shown in Equation 2.10:
H A g
qul
(2.10)
For complete similarity between any model and its prototype, corresponding Π terms must be equal, as shown in Equation 2.11 and 2.12:
m
p
(2.11)
m
p g A H
qul H
A g
qul
(2.12)
Since the same porous material and fluid are used for both the prototype and the model test in this research, and the gravitational force is not scaled, we can get Equation 2.13:
ρp ρm = κp
κm = μp
μm = 1 (2.13)
From Equation 2.12 and 2.13, we can obtain the scaling factor of the flow, q, and the time, t, as shown in Equation 2.14 and 2.15:
ψq = Ap∆Hplm
Am∆Hmlp = N2 (2.14)
ψt = ρmgmκmμpxp
ρpgpκpμmxm = N (2.15)
The often used scaling factors for modeling of geosynthetic materials are summarized in Table 2.3 (Viswanadham, 2004). Notably, the strain in the model test and its prototype remains the same, the geometric parameters(i.e., height, width, and length) should be scaled down N times, and the tensile strength of the reinforcement, T, should be scaled down N2 times.
Table 2.3 Common scaling factors for modeling of GRS structures (Viswanadham et al., 2004)
Parameters Scaling factors
1g model Ng model
Geosynthetic stain εg (%) 1 1
Length a, b, t (m)a 1/N 1/N
Displacement δ (mm) 1/N 1/N
Cross-section area of rib A (m2)b 1/N2 1/N2c
Cross-section area of rib/unit length A' (m)b 1/N 1/N
Tensile strength Tg (kN/m) 1/N2 1/N2c
Secant modulus Jg (kN/m) 1/N2 1/N
Pull-out force P (kN) 1/N3 1/N2
Bond stress τb (kN/m2) 1/N 1
Soil-geosynthetic friction angle ϕsg (deg) 1 1
a a, b, t: Geometric dimensions in longitudinal and transverse directions for geogrid and in the case of geogrid t thickness of rib or thickness of geotextile
b Not valid for geotextiles c Am⁄Ap = 1 N⁄ 2; (Tg)
m (Tg)
⁄ p = 1 N⁄
Chapter 3 Material Testing and Properties
3.1 Test Layout
This research carried out a series of reduced scale model tests to investigate the performance of geosynthetic reinforced wall under rainfall conditions. Before conducting model tests, it is essential to understand the properties of the materials used in this research.
In this section, in addition to the elaboration of material testing procedures, the results of the material property tests are presented herein. Figure 3.1 shows the test methods to determine the properties of soil and reinforcement used in this study.
Figure 3.1 Material property tests layout
3.2 Soil Physical Properties
Vietnam quartz sand and silty sand (i.e. Vietnam quartz sand with twenty percent Kaolinite) were used in this study. In this study, the pycnometer test, sieve analysis, hydrometer test, and relative density test were conducted to obtain the physical properties of the testing soil. The grain size distribution curve and the soil classification were subsequently acquired. The appearance of the testing soil is shown in Figure 3.2.
(a) (b)
Figure 3.2 Testing soil: (a) Vietnam quartz sand; (b) Vietnam quartz sand with 20% Kaolinite
3.2.1 Specific Gravity Test
The specific gravity of the test soil was obtained by the specific gravity test according to ASTM D854. The value of the specific gravity was obtained from the average of three tests. Figure 3.3 shows the equipment of the specific gravity test, and the test results are presented in Table 3.1. The specific gravity of the pure sand and the silty sand is 2.65 and 2.62, respectively.
Table 3.1 Results of the specific gravity test
Soil type Test 1 Test 2 Test 3 Average Gs
Pure Sand 2.65 2.65 2.66 2.65
Silty Sand 2.63 2.60 2.62 2.62
Figure 3.3 Equipment of the specific gravity test 3.2.2 Sieve Analysis Test
Sieve analysis was conducted to obtain the soil grain size distribution curve in accordance with ASTM D293. Figure 3.4 shows the equipment used for the sieve analysis. Sieves No. 4, No. 10, No. 20, No. 40, No. 60, No. 100, and No. 200 were used in the test. Table 3.2 summarizes the test results, and Figure 3.5 shows the grain size distribution curve of the sand. Furthermore, the effective size (D10) of the testing soil is 0.16 mm while the coefficient of gradation (Cc) and the uniformity coefficient (Cu) is 0.89 and 0.66, respectively. Hence, one of the test soil, Vietnam quartz sand, is classified as poorly graded sand (SP) according to the Unified Soil Classification System (USCS).
The grain size distribution curve of the silty sand was obtained from the hydrometer tests.
Figure 3.4 Equipment for the sieve analysis
Figure 3.5 Grain size distribution curve of Vietnam quartz sand
Table 3.2 Results of the sieve analysis
Sieve No. Opening Size Percentage Retained Percent Finer
(mm) (%) (%)
4 4.75 0.00 100.00
10 2.00 0.00 100.00
20 0.84 0.06 99.94
40 0.42 2.78 97.16
60 0.25 40.27 56.89
100 0.149 51.90 4.99
200 0.074 4.75 0.24
Pan - 0.24 0.00
3.2.3 Hydrometer Test
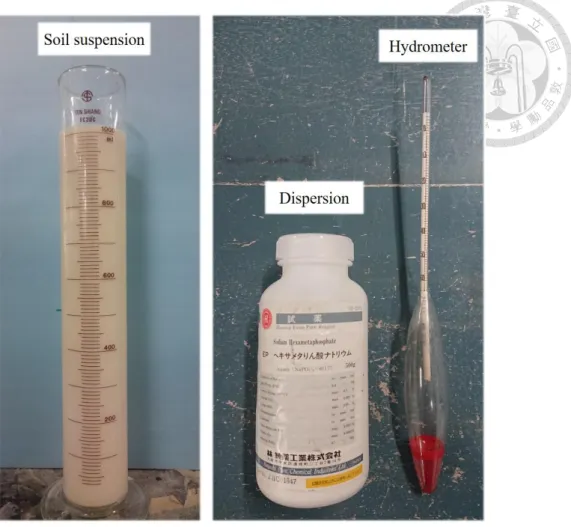
According to ASTM D7928, hydrometer test was carried out to determine the grain size distribution curve for the silty sand of which the particle size is smaller than No. 200 sieve. A hydrometer and a sedimentation cylinder, as shown in Figure 3.6, was used to perform the hydrometer test. Figure 3.7 shows the grain size distribution curve of the testing soil (i.e., Vietnam quartz sand with 20% Kaolinite). The segment that has a particle diameter smaller than 0.075 mm was obtained from the hydrometer test, whereas the remainder was obtained from sieve analysis. The test soil is classified as silty sand (SM) according to the Unified Soil Classification System (USCS).
Figure 3.6 Apparatus of the hydrometer test
Figure 3.7 Grain size distribution curve of silty sand
3.2.4 Relative Density Test
Relative density can be calculated from the maximum and minimum dry unit weight or void ratio, as shown in Equation 3.1:
d d,min d,max max
d,max d,min d max min
r
e e
D e e
(3.1)
where Dr relative density, γd,max maximum dry unit weight, γd,min minimum dry unit weight, γd dry unit weight at the target relative density, emax maximum void ratio, emin minimum void ratio, and e void ratio at the target relative density. The maximum
and minimum dry unit weight and void ratio were obtained using a vibrating deck according to ASTM D4523. Figure 3.8 shows the setup of the apparatus used for the relative density test. A mold with a volume of 2831 cm3 was filled with oven-dried testing soil by pluviation method to achieve the loosest state; the minimum dry unit weight and the maximum void ratio can be attained. The densest state was executed by mounting the mold on the vibratory table with a vertical surcharge (20.2 lb/in2). The volume at the densest state can thus be calculated by measuring the decrease of height after vibration; the maximum dry unit weight and the minimum void ratio can be known subsequently.
The study obtained the friction angle of sand by applying normal stress on samples at different relative density. The results indicate that the friction angle of sand slightly increases with the increase of relative density. Furthermore, the wetting process poses infinitesimal effect on the friction angle of sand with relatively high permeability.
Therefore, the target density of Dr 70% was selected for the GRS wall model using sand as backfill. Table 3.3 presents the results of the relative density test.
Figure 3.8 Apparatus for relative density test
Table 3.3 Results of the relative density test of sand
ASTM Loosest State Densest State Target State ( Dr = 70% )
Parameters γd,min emax γd,max emin γd e
(kN/m3) (kN/m3) (kN/m3)
Value 13.54 0.92 15.21 0.71 14.7 0.77
3.2.5 Compaction Test
Compaction test was carried out to determine the optimum water content and the maximum dry density of the testing soil (i.e., Vietnam quartz sand with 20% Kaolinite).
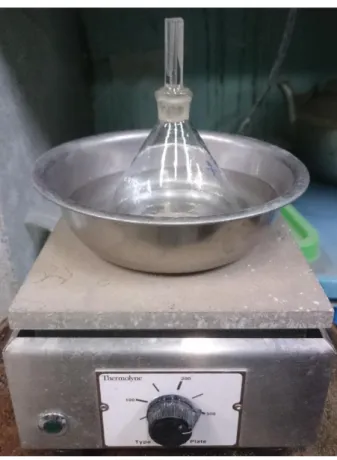
The standard Proctor compaction test was performed according to AASHTO T99, using a 5.5 lb hammer with a free-falling distance of 12 in, as shown in Figure 3.9 . The specimen was prepared by conducting three levels of compaction with 25 blows each layer. Figure 3.10 shows the results of the compaction curve of the testing soil. The maximum dry density is 18.1 kN/m3 while the optimum water content is 10.7%. In this study, the
specimen was compacted at the optimum water content (10.7%) to 90% of the maximum dry unit weight, on the basis of the construction regulation which specifies the compaction has to be at least 90% maximum dry density at 2% optimum water content.
Figure 3.9 Equipment for the compaction test
Figure 3.10 Compaction curve of the test soil
3.3 Engineering Properties of Testing Soil
In this study, permeability tests and triaxial tests were performed to determine the engineering properties, the permeability and shear strength, of the test sand and silty sand.
Specifically, constant head test and consolidated drained triaxial test were conducted for the testing soil with relatively large permeability (i.e., Vietnam quartz sand) while the falling head test and the consolidated undrained triaxial test were conducted for the testing soil with relatively low permeability (i.e., Vietnam quartz sand with 20% Kaolinite).
3.3.1 Constant Head Test
The permeability of the test sand was obtained from the constant head permeability test, conducted in accordance with ASTM D5084. The permeability can be determined by Darcy’s Law, as shown in Equation 3.2:
L Ak h Aki Av
q (3.2)
where q discharge, A cross-sectional area perpendicular to the flow of water, v velocity of the flow, k permeability of the testing soil, i hydraulic gradient, L length of the specimen which water seeps through, and h head difference.
Figure 3.11 shows the setup for the constant head permeability test. The specimen was mounted on a steel platform with an O-ring and Vaseline between the specimen and the platform to prevent the leakage of water. Two porous disks were capped at the top and bottom of the specimen, and non-woven geotextiles were also placed between the porous disk and the specimen to prevent soil particles from leaking out.
Figure 3.11 Apparatus for permeability tests
3.3.2 Falling Head Test
Falling head permeability test was conducted for silty sand. The permeability of the testing soil can be determined from Equation 3.3:
2 1 1 2
)ln
( h
h t
t A
k La (3.3)
Figure 3.11 shows the apparatus for the falling head permeability test, and the test was carried out according to ASTM D5084. The specimen was vacuumed to be saturated before the test started. The permeability of the silty sand can be determined by measuring the head loss of water between a certain time interval. The results of the permeability tests are