國立臺灣大學醫學院生理學研究所博士論文
Graduate Institute of Physiology,
National Taiwan University College of Medicine
Doctoral Dissertation
腸道葡萄糖授予缺氧上皮細胞抗死亡之 訊息傳遞路徑探討
Enteral glucose confers anti-death signaling in epithelial cells under hypoxic stress
黃菁英
Ching-Ying Huang 指導教授﹕余佳慧 博士
Linda Chia-Hui Yu, Ph.D
中華民國 102 年 5月
May 2013
口試委員會審定書 Acknowledgement ... I Acknowledgement ... II
Abstract in Chinese (中文摘要) ... 1
Abstract ... 3
Chapter 1 INTRODUCTION ... 5
1.1 Physiological hypoxia in the gut ... 5
1.2 Pathological hypoxia in the gut ... 6
1.3 Hypoxia in colorectal cancer ... 6
1.4 Modes of cell death ... 7
1.5 Role of glucose in death resistance ... 9
1.6. Aim of the study ... 11
Chapter 2 MATERIAL & METHODS... 12
Chapter 3 RESULTS ... 33
3.1 Part 1 ... 33
3.2 Part 2 ... 42
Chapter 4 DISCUSSION ... 49
Chapter 5 TABLE AND FIGURES ... 61
5.1 Table ... 61
5.2 Figures ... 62
Chapter 6 CONCLUDING REMARKS ... 89
REFERENCE ... 91
口試委員會審定書
Acknowledgement
這本論文的完成,首先要向恩師余佳慧老師致上最崇高的謝意,在余老師的引 領之下,讓我在腸胃道生理學的領域之中,享受科學研究的樂趣。在博士班的期 間,無論是研究方法的設計或論文撰寫與修改,總可以在老師的悉心指導之下獲 得新的啟發,愈加喜愛研究工作。也因為時常受到余老師以正面積極的態度鼓舞,
使我在研究的挫敗之中,能依舊擁有熱忱,而老師也一直是我所學習與景仰的典 範。對於余老師的感謝難以在三言兩語中表達,在學術研究的路上,將永遠感激 在心。
感謝口試委員林明燦老師、許秉寧老師、賴逸儒老師與梁碧惠老師。對論文的 細心匡正與指導,使論文更臻完整。謝謝參與兩篇畢業論文完成的蕭仲凱醫師、
盧彥臻、張哲堯、郭瑋庭、黃怡禎與李宗錞醫師,因為你們的幫助,讓研究得以 順利進行。謝謝所上老師平日的教導與協助;也感謝所上職員與助教在行政事務 與庶務上的幫忙和熱心提醒。感謝曾經共處在腸胃道生理所研究室的所有夥伴 們,無論是日常與實驗上的幫助,或是在你們身上學習與分享的事物,都令人感 激!
有太多未能一一道盡的感謝,謹在此謝謝所有一路相伴的友情、愛情與親情! 你 們是我生命中最珍貴的瑰寶。
Abstract in Chinese (中文摘要)
腸胃道受缺血或低氧壓力引發之上皮細胞死亡調節失常現象,與器官功能異常和
腫瘤生成有關。先前的研究發現,腸道葡萄糖可透過未知機制授予腸道上皮細胞
抗死亡之能力。活化第一型鈉-葡萄糖轉運蛋白(sodium/glucose transporter 1 ,
SGLT1)可避免腸道上皮細胞因微生物刺激而走向細胞凋亡。除此之外,有文獻記
載在人類大腸直腸癌細胞的壞死區域周圍,葡萄糖轉運蛋白(Glucose transporters,
GLUTs) 的異常表現會伴隨低氧誘發因子(Hypoxia inducicle factor (HIF)1α)共存,
推論葡萄糖攝取增加與缺氧區域之抗壞死有關。第一部份之研究目的,欲透過動
物實驗探討腸腔中葡萄糖對腸繫膜缺血造成之上皮細胞死亡與腸道屏障功能失常
之保護作用,並進一步研究葡萄糖所媒介之細胞生存訊息傳遞路徑。第二部分之
研究目的,則利用人類大腸直腸癌細胞株,探討缺氧誘發細胞計畫性壞死之訊息
傳遞路徑,以及葡萄糖代謝物丙酮酸在細胞死亡阻抗性中所扮演的角色。
在第一部份的實驗中發現,將上腸繫膜動脈夾閉造成缺血刺激,會快速引發
空腸上皮細胞凋亡。而缺血後再灌流,則造成凋亡蛋白酶依賴性之腸道通透性上
升,腸道細菌轉移增加,以及腸黏膜發炎。腸道葡萄糖經由SGLT1 攝取,降低缺
血再灌流引發之上皮細胞凋亡、屏障受損,以及黏膜發炎;其乃藉由活化抗凋亡
之PI3K/Akt 路徑及其下游訊息傳遞分子,包括磷酸化 mTOR 與 Bad 蛋白,去磷
酸化p38 MAPK 蛋白。
在第二部份的實驗中,將人類大腸直腸癌細胞暴露於缺乏氧氣與葡萄糖之環
境中,可誘發其發生計劃性壞死,包括receptor-interacting protein kinase (RIP)依賴
性乳酸去氫酶之滲漏與RIP1/3 複合體生成。缺氧刺激後亦誘發粒線體中超氧化物
產生;而給予抗氧化物之後則可抑制RIP 訊息與細胞壞死。RIP 依賴性之計畫性壞
死,在給予葡萄糖後消失;但若將葡萄糖以其他非代謝性醣類似物取代則無此效
果。缺氧細胞在給予葡萄糖後HIF1α 有轉移細胞核的現象,且與 GLUT1 與 GLUT4
之表現增加具關聯性。醣解代謝授予缺氧癌細胞對計劃性壞死之阻抗性,乃部分
源自於丙酮酸清除粒線體自由基的作用且不需依賴能量生成
總括而論,我們發現給予腸道葡萄糖可降低因缺氧壓力造成之細胞凋亡或計
畫性壞死,其抗死亡之作用乃分別透過活化抗凋亡之PI3K/Akt 訊息傳遞路徑;或
是經由丙酮酸對粒線體自由基之清除作用。
Abstract
Dysregulated epithelial cell death caused by ischemic or hypoxic stress is associated
with malfunction or tumorigenesis in gastrointestinal tract. Previous studies have shown
that enteral glucose uptake confers resistance to epithelial cell death via unknown
mechanisms. Activation of sodium/glucose transporter 1 (SGLT1) prevented epithelial
apoptosis caused by microbial products. In addition, abnormally expressed glucose
transporters (GLUTs) were found colocalized with hypoxia inducible factor (HIF)1α in
peri-necrotic regions in human colorectal carcinoma, suggesting that enhanced glucose
uptake may be linked with anti-necrotic resistance in hypoxic tumor core. The aim of
the first study was to explore whether luminal glucose uptake protects against
mesenteric ischemia-induced epithelial cell death and intestinal barrier dysfunction, and
to explore the glucose-mediated cellular survival pathways in vivo. The aim of the
second study is to investigate signaling pathways of hypoxia-induced necroptosis and
explore the role of glucose pyruvate metabolite in mechanisms of death resistance in
human colorectal cancer cells.
In the first part of study, ischemic challenge by occlusion of superior mesenteric
artery caused rapid onset of enterocyte apoptosis in rat jejunum. Ischemia-reperfusion
(I/R) triggered rise of intestinal permeability, augmentation of bacterial translocation
(BT) and mucosal inflammation in a caspase-dependent manner. SGLT1-mediated
enteral glucose attenuated I/R-induced epithelial apoptosis, barrier damage, and
mucosal inflammation via activation of anti-apoptotic PI3K/Akt signaling, including
phosphorylation of mTOR and Bad, and dephosphorylation of p38 MAPK.
In the second part of study, human colorectal carcinoma cells hypoxia exposed in
glucose-free media displayed signs of necroptosis, including receptor interacting protein
(RIP)-dependent lactodehydrogenase leakage and RIP-1/3 complex formation.
Generation of mitochondrial superoxide was noted after hypoxic challenge; its reduction
by antioxidants inhibited RIP signaling and cell necroptosis. Addition of glucose and
pyruvate derivative, but not non-metabolizable analogs, diminished RIP-dependent
necroptosis. Hypoxic cells with glucose showed HIF1α activation and hypoxia-targeted
gene (GLUT-1 and -4) expression. Glycolytic pyruvate scavenging of hypoxia-induced
mitochondrial superoxide was involved in anti-necrotic mechanisms in an
energy-independent manner.
In conclusion, we found that enteral glucose uptake attenuated both type of cell
death, apoptosis and necroptosis in gut epithelial cell under hypoxic stress via either
anti-apoptotic PI3K/Akt signaling pathway or through pyruvate scavenging of
mitochondrial free radical, respectively.
Chapter 1 INTRODUCTION
Human gut mucosa serves as a barrier between external environment and internal milieu.
The mucosal barrier includes a single layer of columnar epithelial cells connected by
apical tight junctional complex, a hydrated gel layer formed by mucin covering the
epithelial cells, and immune cells in lamina propria (Turner, 2009). The epithelial cells
that prevents abnormal influx of noxious luminal contents is also responsible for
nutrient uptake through apically expressed transporters (Laukoetter et al., 2006). In
physiological conditions, commensal bacteria (~100 trillions) are restricted in the gut
lumen and separated from the lamina propria by epithelial cells and mucus layers.
However, abnormal translocation of bacteria to sterile extraintestinal visceral organs
may occur under inflammatory situation and metabolic stress, resulting in sepsis and
life-threatening complications(Yu et al., 2012).
1.1 Physiological hypoxia in the gut
The gut epithelium is anatomically positioned between an anaerobic lumen and a highly
vascularized lamina propria. Despite rich blood supply to the intestine, a steep oxygen
gradient was found along the crypt-villus axis where low oxygen concentration was
seen at the villous tips. The term “physiological hypoxia” was used to describe gut
epithelial cells under an extremely low level of oxygenation acquire regulatory
mechanisms to adapt to the shifted oxygen gradient (Colgan et al., 2010).
1.2 Pathological hypoxia in the gut
Mesenteric ischemia/reperfusion (I/R) is seen in patients with mesenteric artery
embolism, strangulated hernias, and in neonatal necrotizing enterocolitis. It also seen in
the case of major abdominal and vascular surgery or collapse of systemic circulation
occurred by traumatic or hemorrhage shock (Mallick et al., 2004; Yasuhara, 2005; Yu,
2010). The disruption of blood supply during ischemia reduces oxygen and nutrient
supply to mucosal cells. The production of free radicals stimulated by subsequent
restoration of blood flow causes further oxidative stress, which increases inflammation
and aggravates tissue damage (Nilsson et al., 1994; Mallick et al., 2004; Yu, 2010). One
of the major consequences of mesenteric I/R is heightened mucosal cell death and gut
barrier damage, leading to enteric bacterial translocation and septic complications. Both
modes of cell death, apoptosis and necrosis, were observed in the gut mucosa upon
mesenteric I/R injury (Wu et al., 2004; Aban et al., 2005; Chang et al., 2005).
1.3 Hypoxia in colorectal cancer
Rapid cell growth and poorly formed vasculature characterized in malignant cancers are
often accompanied by a hypoxic microenvironment in the tumor core (Brown and
Giaccia 1998; Milosevic, Fyles et al. 2004). Necrotic cell death has been reported in the
hypoxic core in colorectal tumors due to depletion of oxygen and nutrients, However,
malignant cells may develop adaptive mechanisms by metabolic reprogramming to
survive under extremely deprived conditions, which is also related to tumor resistance
to anticancer drugs (Hawley et al., 1992).
1.4 Modes of cell death
Cell apoptotis (programmed cell death) is characterized by caspase-dependent signaling
pathways and nuclear DNA fragmentation. The signaling pathway of apoptosis may be
triggered extrinsically via Fas or TNF receptors, or intrinsically via mitochondrial
pathways, leading to caspase-3 cleavage and ultimately, endonuclease activation for
oligonucleosome formation (Ramachandran et al., 2000). The Bcl-2 family (e.g.,
anti-apoptotic Bcl-2, Bcl-XL, and pro-apoptotic Bax) are important regulators of
mitochondrial-dependent apoptosis (Mayer et al., 2003). The mitochondrial undergo an
increase in membrane permeability and a reduction of membrane potential accompanied
by cytosolic release of cytochrome c. The release of cytochrome c from mitochondria
can be blocked by anti-apoptotic protein Bcl-2, while the translocation of pro-apoptotic
Bax from cytosol bound to mitochondria induces cytochrome c release during apoptosis.
The released cytochrome c binding to an apoptosis binding factor-1 forms apoptosomes
to activate caspase-9. (Shimizu et al., 1999; Zheng et al., 2004). Morphological changes,
such as cell shrinkage, membrane blebbing, and chromatin condensation, are seen in
cells that undergo apoptosis (Ramachandran et al., 2000).
On the other hand, necrotic cell death has been traditionally regarded as an
uncontrolled form of cell death. Cell necrosis is characterized by morphological
alteration, i.e. cytoplasmic swelling, subcellular organelle breakdown, loss of plasma
membrane integrity and release of cellular contents. Most research of necrotic death in
enterocytes is based on morphological and biochemical analysis (Chakrabarti et al.,
2003; Jilling et al., 2006; Higa et al., 2007; Kalischuk et al., 2007; Hunter et al., 2008;
Vincenti et al., 2010). Recent data from human intestinal epithelial HT-29 cells,
lymphocytes, monocytes and fibroblasts have indicated that signaling molecules such as
receptor-interacting proteins (RIPs) are involved in necrotic mechanisms triggered by
cytotoxic agents such as tumor necrosis factor (TNF) (Meurette et al., 2007; Declercq et
al., 2009; He et al., 2009). The formation of RIP1-RIP3 complex followed by auto- or
mutual phosphorylation of RIP proteins is associated with mitochondrial bioenergetic
alterations and intracellular ATP decline in cells undergoing programmed necrosis
(Temkin et al., 2006; Cho et al., 2009; Zhang et al., 2009; Berghe et al., 2010). Reactive
oxygen species (ROS) derived from the mitochondrial respiratory chain has also been
implicated in necrotic mechanisms (Declercq et al., 2009; Zhang et al., 2009). To date,
the involvement and cascading order of these necrotic effectors in ischemic or hypoxic
enterocytes remain unclear.
1.5 Role of glucose in death resistance
Several lines of evidence indicated that presence of glucose may inhibit cell death in
intestinal epithelial cells. Previous studies demonstrated that sodium-dependent glucose
uptake protects intestinal cells against apoptosis caused by bacterial lipopolysaccharide
and parasitic products (Yu et al., 2005; Yu et al., 2006; Yu et al., 2008). Increased levels
of anti-apoptotic Bcl-2 and Bcl-xL were noted following activation of apically
expressed sodium-glucose transporter (SGLT)-1 (Yu et al., 2005). A more recent report
showed that initiation of Na+-glucose cotransport by SGLT1 triggered downstream Akt
signaling for regulation of cellular functions (Shiue et al., 2005). A critical role of
PI3K/Akt signaling in resistance to apoptosis has been reported in multiple cell types
(Chang et al., 2003; Bouchard et al., 2008). Studies have shown that PI3K/Akt
phosphorylates and thereby inactivates Bad (a pro-apoptotic mitochondrial Bcl-2 family
protein) or phosphorylates mTOR that then activates p70S6K to phosphorylate Bad
(Chang et al., 2003; Bouchard et al., 2008). Other downstream targets of Akt that are
involved in regulating cell survival and cell cycle progression include IκBα/NFκB,
glycogen synthase kinase 3 (GSK3), and Forkhead family of transcription factors
(FoxOs) (Liang et al., 2003; Urbich et al., 2005; Dan et al., 2008; Bai et al., 2009).
One of the pro-survival mechanisms in tumor cells is by metabolic reprogramming
for high levels of glycolysis. The term “Warburg’s effect” describes the phenomenon
that over fifty percent of cellular energy is produced by glycolysis in the tumor in
compared to that ninety percent of energy is produced by mitochondrial oxidative
phosphorylation in normal tissues (Warburg, 1956). Moreover, a large body of evidence
shows that upregulation of glycolytic enzymes and glucose transporters (GLUTs) are
linked to transcription activity of hypoxia inducible factor (HIF) 1α triggered by low
oxygen condition (Yeh et al., 2008; Chiacchiera et al., 2009; Marin-Hernandez et al.,
2009). Recent reports documented that HIF1α and GLUT-1 colocalize at peri-necrotic
regions in human colorectal tumors (Greijer et al., 2008; Airley et al., 2010), suggesting
that glucose metabolism may confer anti-necrotic resistance to hypoxic stress. Glucose
is catalyzed to ATP and pyruvate by a cascade of glycolytic enzymes, such as
glucokinase and glyceraldehyde-3-phosphate dehydrogenase (GPD)(Fleming et al.,
1997). The final glycolytic product pyruvate is also the starting substrate for
tricarboxylic acid (TCA) cycle after being transported across inner mitochondrial
membrane by mitochondrial pyruvate carrier (MPC) (Hildyard et al., 2005; Herzig et al.,
2012). Aside from its critical role as the link between glycolysis and mitochondrial
respiration, pyruvate also scavenges ROS through a non-enzymatic reaction (Kao et al.,
2010). Numerous studies have suggested that chemoresistance may be due in part to
glycolytic ATP as a preferential energy source for promoting cancer cell survival (Xu et
al., 2005), (Zhou et al., 2012).
To date, whether enteric glucose uptake prevents epithelial cell death caused by
mesenteric I/R or hypoxic stress remains unclear. Moreover, molecular mechanisms of
glucose-mediated resistance to cell apoptosis and necrosis have yet to be explored.
1.6. Aim of the study
In the current study, we explored whether enteral glucose confer anti-death signaling
against hypoxic stress in rat intestinal I/R or in human colorectal cancer line.
Chapter 2 MATERIAL & METHODS
Intestinal ischemia/reperfusion
Male Wistar rats (250–300 g) were raised in a temperature-controlled room with
12-hr light-dark cycles, and fed regular rat chow and water. Rats were fasted overnight
with free access to water, and subjected to sham operation or mesenteric I/R challenge.
In I/R rats, the superior mesenteric artery (SMA) was occluded with an atraumatic
microvascular clamp for 20 minutes and then released for up to 60 minutes. Ischemia of
the bowel was verified by the loss of mesenteric pulsations and bluish discoloration of
the jejunum. Sham controls rats received mock manipulation of SMA without occlusion.
All animals were placed on heating pads to maintain body temperature at 37°C during
the operation, and the heart rate was closely monitored. All protocols used in this study
were approved and monitored by the Institutional Animal Care and Use Committee,
National Taiwan University.
Experimental design
The experimental protocols were carried out under aseptic conditions. After
anesthetization with urethane (1.2 g/kg, intraperitoneal injection; Sigma-Aldrich, MO),
all rats were subjected to midline laparotomy and a 10-cm jejunal sac was created by
thread ligature at both ends, beginning 10 cm distal to the ligament of Treitz in each
animal. Care was taken not to occlude or puncture mesenteric vessels during the ligation.
A 1 ml syringe with a PE-10 catheter was intubated to one end of the jejunal sac and 0.5
ml of Krebs buffer with the pancaspase inhibitor ZVAD (EMD Chemicals Inc.,
Darmstadt, Germany) or glucose (Sigma) was carefully injected into the lumen. The
formula for Krebs buffer was 115 mM NaCl, 8 mM KCl, 1.25 mM CaCl2, 1.2 mM
MgCl2, 2.0 mM KHPO4, 25 mM NaHCO3, pH 7.33 - 7.37. Animals were then subjected
to sham operation or I/R challenge as described above.
Rats were randomly assigned to six groups (n = 6-8 / group): Group 1, sham
controls that underwent laparotomy and whose jejunal lumen was instilled with Krebs
buffer before sham operation; Group 2, sham+Z rats that underwent laparotomy and
whose jejunal lumen was instilled with 120 μM ZVAD in Krebs buffer 30 minutes prior
to sham operation; Group 3, sham+G rats that were enterally administered 25 mM
glucose in Krebs buffer immediately before sham operation; Group 4, I/R rats that were
enterally instilled with Krebs buffer before SMA occlusion for 20 minutes and
reperfusion for 60 minutes; Group 5: I/R+Z rats that were enterally instilled with 120
μM ZVAD in Krebs buffer 30 minutes prior to the same I/R procedure; and Group 6:
I/R+G rats that were enterally administered 25 mM glucose in Krebs buffer immediately
before I/R challenge. The concentrations of ZVAD and glucose used here have been
previously shown to inhibit cell apoptosis induced by microbial products in epithelial
cell cultures (Yu et al., 2005; Yu et al., 2008).
In some experiments, phloridzin (a SGLT1 inhibitor; 0.5 - 2.5 mM) and phloretin
(a GLUT2 inhibitor; 1.5 and 2.5 mM) were added to the glucose solution for enteral
instillation prior to the I/R procedure. In addition, to investigate the involvement of
PI3K in the signaling pathways of glucose-mediated rescue mechanism, LY294002 (10
mg/kg) and wortmannin (7.5 μg/kg) were administered intraperitoneally and
intravenously, respectively, 30 minutes before I/R challenge in the presence of luminal
glucose. At the end of the surgical procedures, the jejunal tissues, the liver, and the
spleen were collected for experimental analysis.
Histopathological scoring
Jejunal segments were fixed in 4% paraformaldehyde, and care was taken to ensure
proper orientation of the crypt to villus axis during embedding. Sections of 4 μm
thickness were stained with hematoxylin and eosin (H&E). The degree of intestinal
injury was evaluated using a light microscope and graded by two independent persons
blind to the actual treatment. Briefly, intestinal injury was scored from 0 to 5 according
to the following criteria: grade 0, normal mucosal villous structure; grade 1, presence of
subepithelial space at villous tips; grade 2, scattered epithelial denudation on villous tips;
grade 3, denuded tips with exposed lamina propria and villous blunting; grade 4,
epithelial shedding from both the apex and mid-region of the villi associated with
shortened and widened villous structure; grade 5, complete destruction of villi and
disintegration of lamina propria with ulceration.
TUNEL assay
Paraffin-embedded jejunal sections were deparaffinized and in situ detection of
cells with DNA-strand breaks was performed by the TUNEL labeling method using a
TdT-FragEL™ DNA fragmentation detection kit (Oncogene Research Products, Boston,
MA) following the manufacturer's protocol. Negative controls were performed by
substituting tris-buffered saline (TBS) for the TdT enzyme.
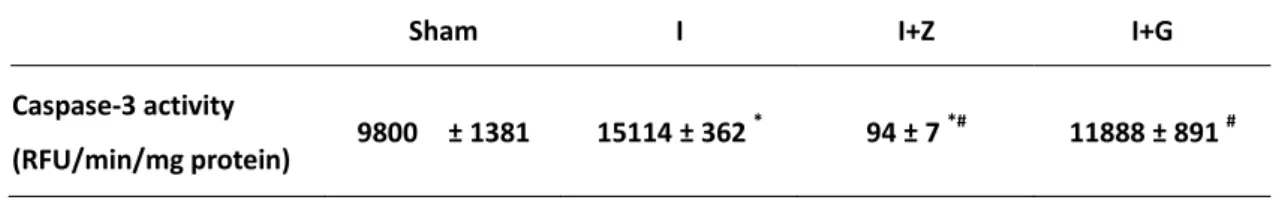
Caspase-3 activity assay
Scraped jejunal mucosa was lysed and the protein concentration of the lysate was
adjusted to 50 μg/ml to test for caspase-3 activity (Anaspec, San Jose, CA). The assay is
based on spectrophotometric detection of the chromophore rhodamine 110 (Rh110) after
cleavage from the labeled substrate DEVD-Rh110. The caspase-3 activity of samples
was measured in relative fluorescence units (RFUs) at Ex/Em = 496 nm/520 nm for 60
minutes in 5-minute intervals. The level of caspase-3 activity was expressed as
RFU/min/mg.
Ussing chamber studies and macromolecular flux assay
Intestinal segments were excised and immediately placed in warm Krebs buffer. The
external muscle layers were stripped off, leaving the submucosal plexus and mucosa
intact. From each rat, two pieces of the muscle-stripped tissues (cut longitudinally into
flat sheets along the mesenteric border) were mounted in Ussing chambers (WPI
Instruments, Sarasota, FL). Care was taken to avoid tissues containing Peyer's patches.
The opening area (2 cm2) of the chamber exposed the tissue to 5 ml of circulating
oxygenated Krebs buffer. The serosal buffer contained 10 mM glucose that was
osmotically balanced with 10 mM mannitol in the mucosal buffer. A circulating water
bath maintained the temperature of the buffer at 37°C. The serosal and mucosal tissue
baths were clamped at 0 V using a voltage clamp feedback amplifier (WPI Instruments).
The short-circuit current (Isc, μA/cm2) of the tissue was recorded continuously on line.
At 5-minute intervals, the voltage between the two baths was stepped to 1 mV for one
second, and the change in the Isc caused by the pulse was used to calculate the tissue
conductance (mS/cm2) according to Ohm's law (Yu et al., 2003).
The intestinal epithelial permeability was determined by the level of
mucosal-to-serosal flux of horseradish peroxidase (HRP type II, MW = 44 kD, Sigma).
Tissues in the Ussing chambers were allowed to equilibrate until the Isc stabilized
before HRP was added to the luminal buffer at a final concentration of 5 × 10⁻⁵ M.
Samples (300 μl) of serosal buffer were collected at 0, 30, 60 and 90 minutes after
luminal addition of HRP, and were replaced with Krebs buffer. The concentration of
HRP was determined by a kinetic enzymatic assay. Fluxes were calculated according to
standard formulae and were expressed as pmol/cm2/hr (Yu et al., 2003).
Fluorescein-based gut permeability assay
To assess gut permeability in vivo, a fluorescein-based assay was performed as
described previously with slight modification (Wang et al., 1998). The 4-kDa
fluorescein isothiocyanate-conjugated dextran (FD4, Sigma) dissolved in Krebs buffer
was administered into the lumen of ligated jejunal sac to a final concentration of 0.5
mg/ml immediately after the release of the artery clamp. The jejunal sac was placed
back into the peritoneal cavity, and the open abdomen was covered with a saline-wetted
gauze and foil to prevent evaporation and direct light. Arterial plasma from 0.5 ml of
blood was taken at 60 minute post-reperfusion. Fluorescence intensity in arterial plasma
was measured at Ex/Em = 496/520 nm using a plate reader. The concentration (μg/ml)
of FD4 in plasma was calculated using a standard curve.
Magnetic Resonance Imaging (MRI)-based gut permeability assay
To assess gut permeability in vivo, the contrast agent gadodiamide (Omniscan, GE
Healthcare) was instilled into the lumen of the ligated jejunal sac to a final
concentration of 0.25 M immediately after the release of the artery clamp, and the signal
intensity of this agent in the liver and kidney was quantified using abdominal MRI as
described previously (Hsiao et al., 2009). In sham controls, gadodiamide was injected
into the jejunal sac after mock manipulation. The rats were placed in a home-made
resonance coil with inner diameter of 6 cm, and abdominal MRI was performed at
various time points (0, 5, 10, 15, 30, 45 and 60 minutes) using a clinical 1.5 T MR
System (Signa Excite; GE Healthcare). Two dimensional T1-weighted fast spin echo
MRI pulse sequences were used, with the following parameter set: TR/TE = 140/4.2
msec, FOV = 12 × 8.4 cm2, and NEX = 4. The signal intensity produced by
gadodiamide in the region of interest (ROI), liver and both kidneys, was measured.
Signal-to-noise ratio (SNR) was calculated by dividing the signal intensity of the ROI
by that of the background. To quantify the gadodiamide delivered to the systemic
circulation, samples of plasma from 0.5 ml of blood taken before (t = 0 minutes) and 15,
30, and 60 minutes after injecting gadodiamide were prepared. A known concentration
(0.5 M) of gadodiamide solution was serially diluted with neat plasma to prepare
standard solutions for the calibration curve. Plasma and standard solutions were
subjected to MRI scan, and imaging parameters were: TR/TE = 550/67.50 msec, FOV =
14 × 0.5 cm2, and NEX = 4. The SNRs of the standard solutions of gadodiamide were
plotted against their respective concentrations to establish a standard curve. The plasma
gadodiamide concentrations were calculated from the standard curve (Hsiao et al.,
2009).
Analysis of bacterial translocation
The liver and spleen tissues were homogenized, sonicated and adjusted to a protein
concentration of 0.1 g/ml with sterile PBS. Each homogenate was inoculated onto fresh
blood agar plates (200 μl per plate; Scientific Biotech Corp., Taipei, Taiwan) and the
plates were incubated at 37°C overnight. The number of bacterial colony forming units
(CFU) was normalized per gram of tissue (CFU/g).
Myeloperoxidase (MPO) activity assay
Intestinal samples were homogenized and sonicated in 10 volumes of potassium
phosphate buffer (PPB, 50 mM, pH 6.0) containing 0.5% HTAB (Sigma). Lysates were
centrifuged and supernatants were diluted in PPB containing 0.167 mg/ml of
O-dianisidine dihydrochloride (Sigma) and 0.0005% of H2O2. The enzyme
concentration was determined from the absorbance at 460 nm measured every 30
seconds over a 5 minute period. One unit of MPO activity was defined as the quantity of
enzyme degrading 1 μmol of H2O2 per minute, and MPO activity of the gut was
expressed in U/mg of tissue.
ELISA for TNF α and MIP-1 α
Scraped jejunal mucosa were homogenized and sonicated in PBS and the lysate
was centrifuged. The protein concentration in the supernatant was quantified. The levels
of TNFα and MIP-1α in mucosal samples were measured by using ELISA development
kits (PeproTech, NJ) according to the manufacturer's instructions. To measure cytokine
levels, microplates were coated overnight with capture antibodies. The plates were
blocked with PBS containing 1% BSA for 1 hour and washed. The sample and standard
solutions were added and incubated for 2 hours. The biotinylated antigen-affinity
detection antibodies were incubated for another 2 hours. After washing, avidin-HRP
conjugate was added for 30 minutes followed by incubation with ABTS liquid substrate
for color development. Absorbance was measured at 405 nm with correction set at 650
nm. The cytokine levels in jejunal mucosa were expressed in pg/mg of protein.
Immunohistochemical and immunofluorescence staining for rat jejunal tissue
Tissue sections were incubated with 3 % H2O2 to block endogenous peroxidase for
immunohistochemical staining and were quenched with 50 mM NH4Cl in PBS for
immunofluorescence staining, and then blocked with 2% normal goat serum. Tissue
sections were incubated with anti-cleaved caspase-3 (1:1000 Cell signaling, Danvers,
MA), anti-proliferating cell nuclear antigen (PCNA) (1:100, Lifespan biosciences,
Seattle, WA), anti-SGLT1 (1:200, Millipore, Billerica, MA), anti-Akt (1:100, Cell
signaling), or isotype control antibodies. After washing with PBS, tissues stained for
SGLT1 were incubated with biotin-conjugated goat anti-rabbit IgG (1:1000, Molecular
Probes, Carlsbad, CA) for one hour, followed with a streptavidin-conjugated Alexa
Fluor® 488 fluorescent probe (1:1000, Molecular Probes) for one hour; tissues stained
for Akt were incubated with goat anti-mouse IgG conjugated to Alexa Fluor® 488
fluorescent probe (1:1000, Molecular Probes) for one hour. All tissues were stained with
Hoechst dye to visualize cell nuclei. Tissues stained for cleaved caspase-3 and PCNA
were incubated with HRP-conjugated SignalStain® Boost anti-rabbit IHC detection
reagent (Cell signaling) and developed with a DAB peroxidise substrate followed by
counterstain with hematoxylin. The slides were mounted with aqueous mounting media
and viewed under a Zeiss fluorescence microscope.
Western blotting for jejunal mucosa
Scraped jejunal mucosa was homogenized in ice-cold complete RIPA buffer, and
the lysate was sonicated and centrifuged. The protein concentration of the supernatant
was adjusted to 5 mg/ml and diluted at a 1:1 vol:vol ratio in 2× electrophoresis sample
buffer containing 2% (w/v) SDS, 100 mM DTT, and 62.5 mM Tris/HCl (pH 6.8).
Samples were then heated to 95°C in a heat block for 5 minutes, and stored at –20°C
until used for immunoblotting.
The extracted proteins were separated by SDS-PAGE, and the resolved proteins were
electrotransferred onto membranes. After blocking with 5% non-fat milk in TBS, the
membrane was incubated with anti-occludin (1:1000, Invitrogen), anti-Akt (1:500, Cell
signaling), anti-phospho-Akt (1:1000, Cell signaling), anti-IκBα (1:1000, Santa Cruz,
Santa Cruz, CA), anti-phospho-IκBα (1:1000, Santa Cruz), anti-phospho-Bad (1:500,
Cell signaling), anti-phospho-mTOR (1:500, Cell signaling), anti-phospho-GSK3α/β
(1:1000, Cell signaling), or anti-phospho-FoxO1/3a (1:1000, Cell signaling) at 4°C
overnight. A monoclonal mouse anti-β-actin (1:10000, Sigma) was also used to control
for equal loading in each sample. Membranes were washed with 0.1% Tween 20 in TBS
and incubated with either horseradish peroxidase-conjugated goat anti-rabbit or
anti-mouse IgG (1:1000, Cell signaling). The antigens were revealedand band density
quantified by photoimage analysis.
Akt kinase activity
The kinase activity of Akt was determined using a non-radioactive Akt kinase
assay kit (Cell signaling) according to the manufacturer’s instruction. Briefly, scraped
jejunal mucosa was homogenized in ice-cold lysis buffer, and the lysate was sonicated
and centrifuged. For immunoprecipitation, 20μl of immobilized antibody beads
conjugated to anti-phospho-Akt was added to 200μl of cell lysate (the protein
concentration was 2.25 mg/ml) with gentle rocking overnight at 4°C. After washing
with lysis buffer and kinase buffer, the pellet was incubated with ATP and GSK3 fusion
protein for 30 minutes for kinase reaction. Exogenous GSK3, a downstream target of
Akt, served as the substrate of phospho-Akt in this assay. The reaction was terminated
by addition of 2× SDS sample buffer. The Akt kinase activity was determined by
Western blot using anti-phospho-GSK3α/β antibody.
Cell culture models
Human colonic carcinoma Caco-2 and HT29 cells were grown in Dulbecco's
modified Eagle's medium (DMEM; Invitrogen, Grand Island, NY, USA) containing 5
mM glucose and without pyruvate (Kles et al., 2002; Yu et al., 2005). The media was
supplemented with 10% fetal bovine serum, 15 mM HEPES, 100 U/mL penicillin, and
0.1 mg/mL streptomycin (Sigma, St. Louis, MO, USA). Cells were seeded in 96- well
(105 cells/well) or 24-well (106 cells/well) tissue culture plates (Costar, Corning, NY,
USA). Cells were grown to confluency for one week at 37 °C with 5% CO2 and 96%
humidity. In all studies, cells were used between passages 21 and 27.
Hypoxic challenge and glucose deprivation
Cells were deprived of oxygen and glucose as previously described (Kalda et al.,
1998; Kles et al., 2002; Shahrzad et al., 2005). Hypoxic (Hx) challenge was conducted
using a modular incubator chamber (Billups-Rothenberg, CA, USA) by infusion of 5%
CO2 and 95% N2 at 10 L/min for 5 minutes; normoxic (Nx) controls were kept at 5%
CO2 and 95% air (Kalda et al., 1998; Kles et al., 2002; Shahrzad et al., 2005). In some
groups, cells were pretreated with necrostatin-1 (Nec-1; a specific RIP1 inhibitor), BHA
(200 μM; a free radical scavenger), apocynin (1 mM; an inhibitor to NADPH oxidase),
or vehicle controls prior to hypoxic challenge to examine cell death pathways.
In additional experiments, cells were incubated in glucose-free and pyruvate-free
DMEM media (Invitrogen) supplemented as above plus 0-25 mM glucose. To verify the
role of glycolysis in death resistance, cells were pretreated with inhibitors to the cascade
of glucose metabolic pathways such as IA (1 mM; a glycolytic inhibitor to GPD) and
UK (10 μM; a MPC inhibitor), or with vehicle controls prior to hypoxic challenge in the
presence of glucose. In another set of experiments, equimolar concentrations of
substances were apically instilled in place of glucose to verify cellular metabolic status,
such as 3-O-methyl-glucopyranoside (3-OMG; a non-metabolizable sugar analog taken
up by glucose transporters), mannitol (a non-absorbable and non-metabolizable sugar
used as an osmolarity control), or glutamate (an amino acid used as an oxidative fuel
control) before hypoxic challenge. The anti-necrosis effect of a cell-permeable pyruvate
derivative, ethyl pyruvate (25 mM), was also examined in hypoxic cells. All reagents
were purchased from Sigma.
Lactodehydrogenase (LDH) leakage assay
The leakage of intracellular enzyme LDH into the surrounding environment
indicates rupture of plasma membrane, which is a hallmark of cell necrosis. The cell
culture supernatant was collected after hypoxic challenge for the measurement of LDH
activity. Briefly, a reaction mixture of 0.2 mM NADH and 0.36 mM sodium pyruvate
was dissolved in Krebs-Henseleit (K-H) buffer containing 2% BSA. The K-H buffer is
composed of 118 mM NaCl, 4.8 mM KCl, 1.2 mM MgSO4, 1.25 mM CaCl2, 1.2 mM
KH2PO4, 24 mM NaHCO3 (pH7.4). Ten μl of cell supernatant and 190 μl of reaction
mixture were mixed well in 96-well plates prior to spectrophotometric kinetic readings.
Owing to the differences in the absorption spectra of NADH and NAD+, changes in the
NADH concentration can be detected at 340 nm. The decrease in absorbance measured
every minute over a 10-min period represents the activity of LDH. One unit of LDH
activity is defined as the quantity for oxidation of 1 μmole NADH per minute; the LDH
activity of cell supernatant was expressed in Units per liter (Unit/L).
Analysis of mitochondrial functions by time-lapse microscopy
Mitochondrial transmembrane potential changes and ROS production were
measured by using cell-permeant cationic fluorescent dyes, including
5,5’,6,6’-tetrachloro-1.1’,3,3’-tetraethylbenzimidazolylcarbocyanine iodide (JC-1)
reagents and MitoSOX (Invitrogen, CA, USA) . The JC-1 reagent emits red
fluorescence in its aggregated form when it accumulates in the negatively charged
mitochondrial matrix of viable cells. The monomeric form of JC-1 emits green
fluorescence when the dye is dispersed in the cytoplasm due to the loss of mitochondrial
transmembrane potential. MitoSOX Red, which selectively targets functional
mitochondria, exhibits red fluorescence after oxidization by superoxide. Cells grown on
96-well culture plates or 8-well chamberslides (2 x 10⁵ cells/well, Costar) were
incubated with JC-1 (10 μg/ml) or MitoSOX (5 μM) for 20 min, and washed twice prior
to hypoxic challenge, and then subjected to fluoremetric readings. Alternatively, cells
were analyzed by time-lapse microscopy using Application Solution Multi-Dimensional
Workstation (AS MDW) (Leica Microsystems, Mannheim, Germany). Cells were
loaded with JC-1 (10 μg/ml) for 30 min before infusion of 5% CO2 and 95% N2 into
the temperature-controlled moisture chamber of the AS MDW for live cell imaging.
Immunoprecipitation of RIP1-RIP3 complex and in vitro kinase assay
Cells lysates were immunoprecipitated with anti-human RIP1 (BD bioscience,
Franklin Lakes, NJ, USA) overnight, and then incubated with protein G agarose beads
for one hour at 4°C followed by centrifugation. The pellet was dissolved in
electrophoresis sample buffer for heat denaturation. The immune complexes were
subjected to reducing SDS/PAGE and the membranes were incubated with anti-RIP1
(1:1000, BD bioscience) or polyclonal rabbit anti-RIP3 (1:1000, Abcam, Cambridge,
UK) for immunoblotting. For in vitro kinase assays, the bead pellets were incubated in
kinase reaction buffer supplemented with 10 μM cold ATP and 1μCi γ-32P-ATP for 30
min at 30°C. The samples were resolved by SDS/PAGE and exposed to film for
autoradiography as previously described (He et al., 2009).
RNAi-mediated knockdown of RIP1
RIP1 siRNA and negative control were purchased from Dharmacon, Lafayette, CA,
USA. Cells were transfected with 100 nM siRNA oligonucleotides using
DharmaFECT® siRNA transfection reagents as per manufacturer’s protocol.
Knockdown efficiency of transfected cells was confirmed by western blotting 96 hrs
post transfection.
Measurement of transepithelial electrical resistance (TER) and paracellular
permeability
Cells grown to confluency underwent normoxia or hypoxia for the indicated times.
The monolayer TER was measured using an electrovoltohmeter (EVOM; World
Precision Instruments, Sarasota, FL, USA). Paracellular permeability was assessed by
apical-to-basal transport of a dextran probe (MW3000) conjugated to fluorescein
(Invitrogen) as described previously (Yu et al., 2005; Wu et al., 2011).
Immunofluorescent staining of tight junction structures
Cells were exposed to normoxia or hypoxia for 16 hrs, fixed with 4%
paraformaldehyde for one hour on ice, and quenched with 50 mM NH4Cl in PBS for 10
min at room temperature. After blocking with 0.1% bovine serum albumin (BSA) in
PBS for one hour, monolayers were incubated with a polyclonal rabbit anti-human ZO-1
antibody (1:100, Invitrogen) in a permeabilizing buffer (0.05% saponin, and 0.1% BSA
in PBS) for one hour. Cells were then incubated with secondary antibodies of goat
anti-rabbit IgG conjugated to Alexa 488 (1:1000, Invitrogen) for one hour in the dark,
and then stained with a Hoechst dye to visualize cell nuclei. The slides were mounted
with aqueous mounting media and viewed under a Zeiss fluorescence microscope.
Measurement of cell apoptosis
DNA fragmentation, which is a final stage of apoptosis, was measured using a cell
detection ELISA kit (Roche) for oligonucleosome amount as previously described (Yu
et al., 2005). The caspse-3 activity assay (Anaspec) was based on spectrophotometric
detection of chromophore rhodamine 110 (Rh110) after cleavage from the labeled
substrate DEVD- Rh110 according to the manufacturer’s instructions (Huang et al.,
2011).
RNA extraction and polymerase chain reaction (PCR) for GLUT transcripts
Total RNA was isolated using Trizol reagent (Invitrogen) according to the
manufacturer's instructions. For semiquantitative PCR analysis, the RNA (2 µg) was
reverse transcribed (RT) with oligo(dT) using RevertAid First Strant cDNA Synthesis
kit (Thermo) in 20 μL reaction volume. The RT product corresponding to 0.1 µg of
initial RNA was subjected to PCR amplification in a thermal cycler. The specific primer
pairs of human GLUTs 1-4 and β-actin and the thermal cycling procedures were
described previously (Noguchi et al., 2000). The amplification conditions were as
followed: denaturation at 95°C for 30 sec, annealing at 60°C for 30 sec and extension at
72°C for 50 sec in a total of 30 cycles. The PCR products were separated onto 1%
agarose gel containing ethidium bromide, and visualized by ultraviolet
transillumination.
Quantitative real-time PCR analysis was carried out using an Applied Biosystems
7500 Real-Time PCR system (Applied Biosystems). The PCR reaction mixture
consisted of 50 ng of RT product, 10 μL of Power SYBR Green PCR Master Mix
(Applied Biosystems) and 500 nM specific primer pairs in a final reaction volume of 20
μL. The specific primer pairs of human GLUT1, GLUT4 and β-actin were described
previously (Matsushita et al., 2012; Torres et al., 2012). The PCR conditions were 95
°C for 10 min, followed by 40 cycles of denaturation at 95 °C for 15 sec, and annealing
and extension at 56 °C for 1 min. Amplification plots were obtained by using a
Sequence Detection Software (Applied Biosystems).
Western blotting for GLUT proteins in human colonic carcinoma cells
Extracted protein samples were subjected to SDS/PAGE (4–13% polyacrylamide) as
described (Huang et al., 2011; Wu et al., 2011). Briefly, the resolved proteins were
electrotransferred onto PVDF membranes and blocked with 5% (w/v) nonfat dry milk in
Tris-buffered saline (TBS) for 1 hr, washed three times with TBS-T (0.1% (v/v)
Tween-20 in TBS), and then incubated with primary antibodies at 4°C overnight. After
washing with TBS-T, the membrane was incubated with a secondary antibody for 1 hr
and then washed again. The membranes were incubated with chemiluminescent solution
(ECL, Millipore) and signal was detected on an UVP AutoChemi system (UVP, Upland).
Band density was determined using the software Gel-pro Analyzer 4.0 (Media
Cybernetics).
The primary antibodies used for blotting included anti-GLUT1 (1:2000, Millipore),
anti-GLUT2 (1:1000, Millipore), anti-GLUT3 (1:1000, Millipore), anti-GLUT4 (1:1000,
Millipore), and anti-β-actin (1:10000, Sigma). The secondary antibody used were
horseradish peroxidase-conjugated goat anti-rabbit IgG (1:1000, Cell Signaling).
Measurement of intracellular redox enzyme activities
The activities of catalase, superoxide dismutase (SOD), glutathione reductase (GR),
or glutathione-S-transferase (GST) were measured in cell lysates using commercial
assay kits (Cayman Chemical, MI, USA) following the manufacturer’s instructions.
Measurement of intracellular pyruvate, ATP, and lactate contents
Cell lysates were used for the assessment of intracellular pyruvate (Biovision, CA,
USA), ATP (Invitrogen) and lactate (Biovision) levels using commercial assay kits. To
measure the pyruvate concentration in the cell, pyruvate is served as a substrate
oxidized by pyruvate oxidase via enzyme reaction to generate color and analysis at OD
570 nm by plate reader. The ATP assay is based on requirement of ATP by luciferase for
light production, and the luminescence is measured using a luminometer. To quantify
lactate content, a chromogenic assay utilizing cellular lactate as a substrate oxidized by
lactate dehydrogenase was measured at 450 nm by a plate reader.
Statistical analysis
All values except for bacterial CFU/g were expressed as mean ± SEM and the means
were compared by one-way analysis of variance followed by a Student-Newman-Keul
test. For the data of BT, pairwise ranking of the median of CFU/g values was conducted
using the nonparametric Mann-Whitney U test. Significance was established at P <
0.05.
Chapter 3 RESULTS
The results of part 1 and part 2 were adopted from Ching-Ying Huang’s papers in
Laboratory Investigation (Huang et al., 2011) and Cell Death and Disease (Huang et al.,
2013).
3.1 Part 1
Mesenteric I/R triggers intestinal epithelial apoptosis that accompanies villous destruction
Compared with non-ischemic tissues in sham controls, rats subjected to mesenteric
I/R showed villous blunting and epithelial denudation in the jejunum (Figure. 1A).
Mucosal destruction was associated with increased number of TUNEL(+) epithelial
cells and enhanced immunoreactivity to cleaved caspase-3 at regions close to the
denuded villous tips in intestines of I/R rats (Figure. 1B and 1C). Decreased
immunoreactivity of PCNA was found in the intestinal crypts in I/R rats compared to
sham controls (Figure. 1D). The severity of mucosal damage caused by I/R was
quantified by histopathological scoring (Figure. 1E).
Enteral instillation of the pancaspase inhibitor ZVAD reduced the degree of
mucosal injury and epithelial apoptosis caused by I/R (Figure. 1A-C, and 1E). Normal
intestinal histology was seen in sham-operated rats enterally administered ZVAD
(Figure. 1A). The mucosal caspase-3 activity was significantly increased after ischemia
(Table 1). Luminal pretreatment with ZVAD inhibited both baseline and
ischemia-induced mucosal caspase-3 activity (Table 3-1). This parameter was not
measured post-reperfusion owing to the marked destruction of the villous structure.
To assess the changes in the tight junctional structure, the level of occludin was
evaluated by Western blot. Increased cleavage of occludin was seen in the intestinal
mucosa of ischemic intestines compared to that of sham operation (Figure. 2).
Pretreatment with ZVAD diminished the level of occludin cleavage caused by ischemic
challenge (Figure. 2). Occludin levels were not examined post-reperfusion due to severe
epithelial denudation.
Increased intestinal permeability caused by I/R is dependent on epithelial apoptosis
The intestinal permeability changes caused by I/R were first evaluated using an ex
vivo assay that measured the luminal-to-serosal flux of a macromolecular probe HRP in
Ussing chambers (Yu et al., 2003). The transmural HRP flux rate in the intestine of I/R
rats was twice that of sham controls. The increase of HRP flux in I/R tissues compared
to sham controls was evident at 30-60 and 60-90 minutes after luminal addition of HRP
to the chambers (Figure. 3A).
In consideration of the time frame required to detect increased HRP flux and the
extracorporeal setting of high oxygen and glucose supply needed to maintain the
viability of tissues ex vivo ⎯ which may produce artificial results of the extent of I/R
injury ⎯ we also measured gut permeability changes in vivo by using ligated loops
administered with fluorescein-conjugated dextran (Wang et al., 1998) or a contrast agent
gadodiamide for the newly-developed MRI-based assay (Hsiao et al., 2009). A
significant increase of the lumen-to-blood passage of FITC-dextran was seen in I/R rats
compared to sham controls (Figure. 3B).
The novel MRI-based intestinal permeability assay monitors the portal drainage of
an enterally-administered contrast agent (gadodiamide) by quantifying the signals in the
liver and kidney as the areas of interest (Hsiao et al., 2009). Representative abdominal
images of sham and I/R rats were taken at various time points after the start of
reperfusion (Figure. 3C). The signals in liver and kidney in I/R rats were brighter than
in sham controls (Figure. 3C). The signal-to-noise ratio (SNR) of the areas of interest
was quantified from the MR images (Figure. 3D). The liver SNR values in sham
controls was consistently low throughout these time points, whereas in I/R rats the liver
signals were significantly elevated over time and remained high up to 60 minutes
post-reperfusion (Figure. 3D). The signal intensity in liver was 14 times higher in I/R
rats (SNR = 4.97 ± 0.45) than in sham controls (SNR = 0.35 ± 0.07) as early as 5
minutes post-reperfusion (Figure. 3D). The kidney SNR values in I/R rats were
significantly higher than that of sham controls within 15 minutes post-reperfusion
(Figure. 3D). The plasma gadodiamide concentration was 68 times higher in I/R rats
than in sham controls (Figure. 3D).
Pretreatment with intraluminal ZVAD partially decreased the gut permeability rise
triggered by I/R, as evidenced by lower fluorescein intensity in plasma samples (Figure.
3B), as well as lower SNR in the liver, kidney, and plasma in I/R+Z rats (Figure. 3C and
3-3D). The gut permeability in sham+Z rats was comparable to that of sham controls
(data not shown).
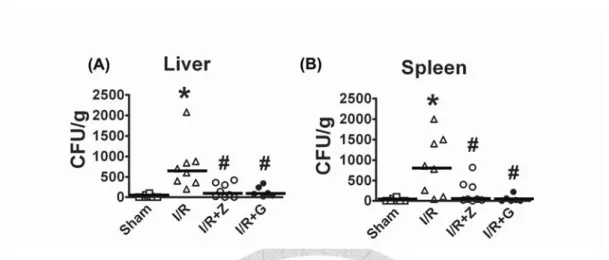
I/R-induced enteric bacterial translocation and mucosal inflammation are diminished by pretreatment with a caspase inhibitor
The bacterial counts in liver tissue in I/R rats were significantly higher than sham
controls (Figure. 4A). A similar increase of bacterial CFUs was demonstrated in the
spleen upon I/R insult (Figure. 4B). Intraluminal pretreatment with ZVAD abolished the
increase in bacterial CFUs in the liver and spleen of I/R rats (Figure. 4A and 4B).
The intestinal MPO activity (Figure. 5) and the mucosal levels of TNFα and
MIP-1α (Figure. 6) were higher in ischemic intestines compared to those with sham
operation, suggesting activation of inflammatory cells. Enteral instillation of ZVAD
diminished the rise of MPO activity (Figure. 5) and the increase of TNFα and MIP-1α
production induced by ischemia (Figure. 6). The inflammatory parameters in sham+Z
rats were comparable to those of sham controls (data not shown).
Luminal glucose decreased I/R-induced intestinal pathology Mucosal pathology and epithelial apoptosis
Enteral instillation of glucose significantly alleviated I/R-induced mucosal injury,
whereby the jejunal villi showed better structure and were covered by intact epithelial
layers without cell apoptosis, and the crypt regions showed PCNA immunoreactivity
(Figure. 1A-D). Normal intestinal histology was seen in sham+G rats (Fig. 1A).
Luminal glucose also reduced the increase in mucosal caspase-3 activity caused by
intestinal ischemia (Table 1).
Tight junctional integrity and epithelial permeability
The effect of glucose on intestinal barrier function was examined further. Enteral
instillation of glucose reduced the level of occludin cleavage in ischemic guts (Figure.
2).
Moreover, the presence of luminal glucose during I/R challenge diminished the
lumen-to-blood passage of FITC-dextran (Figure. 3B), as well as the gadodiamide
signals and SNR in the liver, kidney, and plasma samples (Figure. 3C and 3D).
Bacterial translocation and mucosal inflammation
The I/R-triggered increase of BT was abolished by luminal glucose. The bacterial
counts in liver and spleen were significantly lower in I/R+G rats than in I/R rats (Figure.
4A and 4B). The bacterial counts in sham+G rats were comparable to those of sham
controls (data not shown).
The intestinal MPO activity in I/R+G rats was decreased compared with I/R rats
(Figure. 5). Reduced mucosal levels of TNFα and MIP-1α were seen in ischemic
intestines instilled with enteric glucose (Figure. 6A and 6B). The intestinal
inflammatory parameters in sham+G rats were comparable to those of sham controls
(data not shown).
Phloridzin blockage of SGLT1 sugar uptake nullifies glucose protection in a dose-dependent manner
To verify the role of SGLT1 in the protective mechanism, pharmacological
inhibitors of specific transporters were instilled into the ligated sac in the presence of
glucose and the gut permeability changes were measured by MRI-based assay. We
found that luminal pretreatment with phloridzin (a specific SGLT1 inhibitor; 0.5-2.5
mM) dose-dependently increased the liver SNR values of I/R+G rats to levels
comparable to those of I/R rats (Figure. 7A). Phloridzin (2.5 mM) also inhibited the
glucose-mediated reduction of BT (Figure. 7B). On the other hand, pretreatment with
phloretin (an inhibitor of GLUT2; 2.5 mM) did not diminish the protective effect of
glucose on gut permeability (Figure. 7A) and BT (Figure. 7B). Moreover, apical
expression of SGLT1 was confirmed in the jejunal epithelium in sham controls (Figure.
7C). A lack of SGLT1 staining accompanied the epithelial sloughing seen in I/R rat
intestines; the presence of luminal glucose abolished this decrease (Figure. 7C).
PI3K/Akt signaling are involved in the glucose-mediated cell survival mechanism
To verify the involvement of PI3K/Akt signals in the glucose-mediated
cytoprotective mechanism, I/R+G rats were administered LY294002 (LY) or
wortmannin (W), which partially eliminated the glucose protection against I/R-induced
cell apoptosis and villous destruction (Figure. 8A) as well as permeability rise (Figure.
8B).
The activation status of Akt in gut mucosa was investigated by measuring the
kinase reaction of immunoprecipitated phospho-Akt to phosphorylate exogenous GSK3
in an in vitro assay. Decreased Akt activity in the intestinal mucosa of I/R rats was
evidenced by the lower levels of phosphorylated GSK3 in I/R samples than in sham
groups (Figure. 9A). Enteral instillation of glucose increased the mucosal Akt activity in
both sham and I/R tissues (Figure. 9A). The GSK3 phosphorylation levels in samples
from I/R+G+LY rats was lower than I/R+G rats (Figure. 9B), indicating that specific
inhibition of PI3K by LY294002 partly diminished the glucose-mediated activation of
Akt. Furthermore, immunofluorescent staining demonstrated the cytosolic expression of
Akt in jejunal epithelial cells in sham controls (Figure. 9C-a). Enteral instillation of
glucose induced the translocation of cytosolic Akt to the brush border and subcellular
organelles of enterocytes in sham+G rats (Figure. 9C-b). The loss of Akt expression was
correlated with the sloughing of intestinal epithelium in I/R rats (Figure. 9C-c), in which
these changes were attenuated by the addition of luminal glucose (Figure. 9C-d). The
phenomenon of Akt translocation to the brush border and to subcellular organelles in
epithelial cells was also seen in I/R+G rats (Figure. 9C-d).
The phosphorylation levels of Akt and downstream signals such as IκB, mTOR, Bad,
and FoxO1/3a in the mucosa of ischemic tissues were investigated by Western blot.
These parameters were not measured post-reperfusion due to severe mucosal denudation.
A significant decrease in phosphorylated Akt level was seen in ischemic tissues
compared to sham controls (Figure. 10A). Increased phosphorylation of Akt was seen
after enteral instillation of glucose in both sham and ischemic tissues (Figure. 10A).
Recent data indicate a link between Akt and IκBα/NFκB signals in promotion of cell
survival and resistance to apoptosis in enterocytes (Dan et al., 2008; Bai et al., 2009).
On the other hand, IκBα/NFκB signals also play key roles in proinflammatory cytokine
production in monocytes/macrophages and intestinal epithelial cells (Funda et al., 2001;
Suzuki et al., 2003; Selvaraj et al., 2005; Murphy et al., 2010). Our data showed that the
mucosal level of phospho-IκBα was significantly increased after ischemic challenge
compared to sham controls (Figure. 10B). Enteral instillation of glucose diminished the
increase of IκBα phosphorylation caused by ischemia (Figure. 10B). Lastly, the
phosphorylation of Akt correlated with the phosphorylation of mTOR, Bad, and
FoxO1/3a in ischemic tissues with glucose instillation (Figure. 10C).
3.2 Part 2
Hypoxic challenge triggers RIP-dependent necroptosis in human colorectal carcinoma cells
Human colorectal carcinoma Caco-2 cells were exposed to normoxia (Nx) or hypoxia
(Hx) in glucose-free media (Φ) for various time points, and a time-dependent increase
of LDH leakage was observed in Hx+Φ but not Nx+Φ cells (Figure 12A). Live images
revealed cytosolic vacuolation, widening intercellular space, and cell detachment in a
timely order following hypoxic challenge, whereas no morphological change was
observed in normoxic counterparts (Figure 12B). No sign of apoptosis was found after
hypoxic challenge as evidenced by the lack of oligonucleosome formation and
caspase-3 activation (Figure 13). Similar results of hypoxia-induced cell necrosis were
seen in another human colorectal tumor cell line HT29 (Figure 14A and B).
The mitochondrial transmembrane potential was determined by using a cationic
JC-1 dye. Exposure to hypoxia resulted in a transient increase and then decline in red
fluorescence intensity (the aggregated form of JC-1) followed by a display of green
fluorescence (the monomer form of JC-1) in the cytoplasm at later time points (Figure
12C). Quantification results indicated that the ratios of J-aggregate/monomer in cells
after 8- and 24-hr hypoxia were 221.1 ± 49.0% and 20.5 ± 2.8%, respectively, of that of
the normoxic controls (Figure 12D), suggesting that hypoxia caused a transient
hyperpolarization and a final collapse of mitochondrial transmembrane potential.
Furthermore, plasma membrane disintegration paralleled with loss of tight
junctions in hypoxic cells, evidenced by reduction of transepithelial electrical resistance
(TER), increase of apical-to-basolateral dextran flux, and structural disruption of zonula
occluden-1 (ZO-1) (Figure 12E-G).
Pretreatment with necrostatin-1 (a specific RIP1 inhibitor) and gene silencing of
RIP1 reduced the level of LDH leakage caused by hypoxic challenge (Figure 15A and
3-2B). A ~50% knock down of RIP1 protein by siRNA was confirmed by Western blots
(Figure 15B). Using immunoprecipitation and 32P kinase assays, formation of RIP1/3
complex and phosphorylation of RIP1 were found in Hx+Φ but not Nx+Φ cells (Figure
16A), indicating the activation of RIP1/3 signaling. The hypoxia-induced morphological
damage and cell detachment were also inhibited by necrostatin-1 (Figure 15C).
However, the mitochondrial transmembrane potential change was not reverted by
necrostatin-1 (Figure 15D), suggesting that RIP1 activation may not be upstream of
mitochondrial dysfunction. In hypoxic cells treated with necrostain-1, a transient
increase in red fluorescence was seen after 8 hrs followed by a switch to green
fluorescence after 24 hrs (Figure 15D), of which the quantification results of JC-1
staining were 277.2 ± 25.2% and 40.2 ± 13.6%, compared to normoxic controls with
necrostain-1 at respective time points.
Glucose uptake abolishes hypoxia-induced RIP signaling and necroptosis
Administration of glucose (25 mM) reduced the RIP1/3 complex formation and
phosphorylation (Figure 16A) and decreased LDH leakage in hypoxic cells in a
dose-dependent manner (Figure 16B). Non-metabolizable sugar analogs (i.e. 3-OMG
and mannitol) or glutamate did not reduce the LDH activity (Figure 17). Moreover,
glucose addition also ablated hypoxia-induced morphological damages (data not shown),
mitochondrial transmembrane potential damage (Figure 16C), and tight junctional
disruption (Figure 16D-F). Addition of glucose did not modify the apoptotic levels in
hypoxic cells (data not shown).
To confirm that cells still perceive hypoxic stress after glucose addition, activation
of HIF1α and hypoxia-targeted genes were examined. Nuclear translocation of HIF1α
(Figure 18A) correlated with increased expression of GLUT-1 and -4 at the
transcriptional and translational levels in hypoxic cells given glucose (Figure 18B-D).
The experiment was not carried out on hypoxic cells in glucose-free media due to cell
necrosis (i.e. plasma membrane disintegration and release of cellular contents).
Moreover, similar results of glucose-mediated death resistance, HIF1α activation, and
GLUT upregulation were also seen in HT29 cells under hypoxic stress (Figure. 19A, C,
D).
Anaerobic glycolytic metabolism is involved in anti-necrotic resistance to hypoxia stress
To verify the metabolic process that is involved in death resistance, cells were pretreated
with iodoacetate (IA, a glycolytic inhibitor to GPD) and UK5399 (UK, a MPC inhibitor)
prior to hypoxic challenge in the presence of glucose. Blockade of glucose-mediated
resistance was noted in cells pretreated with IA, whereas no inhibitory effect was seen
with UK (Figure 20A), suggesting that glycolytic products unrelated to TCA cycles
were involved in anti-necrotic mechanisms. For hypoxic cells in glucose-free media, IA
and UK had no effect on LDH activity (data not shown).
The intracellular ATP, pyruvate, lactate contents were next quantified to examine
the bioenergetic status of cells. A significant reduction of intracellular ATP and pyruvate
levels were seen in hypoxic cells compared to their normoxic controls in glucose-free
media (Figure 20B and C), whereas comparable lactate production was noted between
the two groups (Figure 20D). Addition of glucose partially prevented the drop of ATP
and pyruvate caused by hypoxia, and significantly increased the lactate contents (Figure
20B-D). The effect of IA was confirmed by lower levels of ATP, pyruvate, and lactate
production compared to those given glucose without inhibitors in both normoxic and
hypoxic conditions (Figure 20B-D). In contrast, UK had no effect on these parameters
(Figure 20B-D).
Pyruvate is involved in death resistance through mitochondrial superoxide scavenging without restoration of cellular energy
The specific role of pyruvate in the mechanisms of death resistance was examined by
replacing glucose with cell-permeable ethyl pyruvate derivative in hypoxic cells.
Addition of pyruvate derivative significantly reduced the LDH leakage, RIP1/3 complex
formation, and morphological damage in hypoxic cells (Figure 21A-C). However, the
ATP levels in cells given pyruvate were comparable to those without supplementation
(Figure 21D). Presence of pyruvate neither altered cellular ATP contents nor suppressed
dextran flux in hypoxic cells (Figure 21E), indicating that death resistance by pyruvate
was uncoupled with ATP production and energy-dependent processes (e.g. tight
junctional restoration). Unlike glucose, pyruvate did not suppress hypoxia-induced
mitochondrial transmembrane potential changes (Figure 21F). These results suggest that
pyruvate confers resistance to necroptosis through an alternative, energy-independent
mechanism.
Generation of mitochondria-derived oxidative free radicals has been implicated in
the cell necrotic pathways triggered by cytotoxic agents (Declercq et al., 2009; Zhang et
al., 2009), and we sought to examine its role in hypoxic necrosis. Increased mean
fluorescence of MitoSox (an indicator of mitochondrial superoxide production) was
observed in hypoxic cells compared to normoxic controls in glucose-free media (Figure
22A). Decreasing the mitochondrial superoxide levels with butylated hydroxyanisole
(BHA, a free radical scavenger) and apocynin (an inhibitor to nicotinamide adenine
dinucleotide phosphate (NADPH) oxidase) (Figure 22A) led to partial inhibition of
LDH leakage in hypoxic cells (Figure 22B). Moreover, pretreatment with BHA also
diminished the RIP1/3 complex formation (Figure 22C). These results indicate that ROS
production which is upstream of RIP signaling is involved in hypoxia-induced
necroptotic pathways.
The modulatory effect of glucose and pyruvate on free radical levels was next
addressed. Addition of glucose decreased hypoxia-induced mitochondrial ROS levels
(Figure 22D), but did not alter the redox activities of catalase, superoxide dismutase,
glutathione reductase, or glutathione-S-transferase (Figure 23), suggesting a
non-enzymatic scavenging mechanism. The glucose-mediated reduction of
mitochondrial ROS may be inhibited by pretreatment with IA but not UK (Figure 22D).
Lastly, replacing glucose with cell-permeable pyruvate derivative also significantly
suppressed the mitochondrial ROS levels in hypoxic cells (Figure 22D). Similar results
of pyruvate-mediated resistance were seen in HT29 cells under hypoxic stress (Figure
19B, E).