Abstract—In wind energy conversion systems, most of the system parameters vary during the self-excitation process of induction generator at different values of wind velocity. This makes the analysis and control of the wind energy conversion system, a difficult proposition. This paper presents a robust control strategy based on quantitative feedback theory for a squirrel cage induction generator operating in variable speed mode using back-to-back converter. The controller architecture is developed through a singular perturbation decomposition of the system dynamics. The system is multi-input multi-output with non-minimum phase dynamics. This makes the voltage tracking a major challenge in this system. The quantitative feedback theory based control offers the possibility to track the dc-link voltage with reduced impact of wind fluctuation on the grid. All the details of the work are included.
I. INTRODUCTION
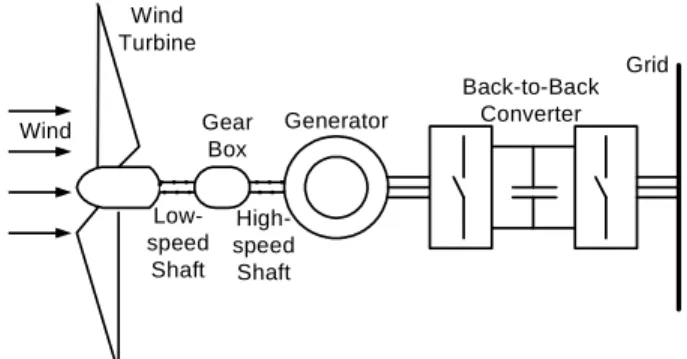
IND Energy Conversion Systems (WECS) are becoming more popular with increased penetration in overall power generation. Squirrel Cage Induction Generator (SCIG) is the most favored generator for a WECS due to its obvious advantages over other options [1]. But the amount of energy harnessed by SCIG from wind is limited due to its inherent, fixed speed operating characteristics. To take the advantage of higher energy capture and increase in system compliance resulting from variable speed operation of SCIG, a back-to-back Pulse Width Modulation (PWM) converter is used between SCIG and the grid [1, 2], as shown in Fig. 1. The random fluctuation in wind velocity brings variation in system parameters. These variations results in fluctuations in power delivered to the grid. This contributes to the transients in voltage amplitudes and therefore may excite the resonant modes of the system. Hence, a robust control strategy is required for the tip-speed regulation, shaft damping and dc-link voltage regulation [3, 4]. As per the convention, the system under study is divided into slow and fast dynamics sub-systems [1- 4]. Accordingly, the study of slow sub-system is done with steady-state characteristics whereas fast sub-system is dealt with dynamic characteristics with singular perturbation decomposition in the system [1, 5]. The system is multiple input multiple output with non- Manuscript received August 12, 2008.
R. K. Thakur is with the College of Military Engineering, Pune, India and is presently pursuing Ph.D. in System & Control Engineering, IIT-Bombay, Powai, Mumbai-400 076, India (e-mail: [email protected]).
V. Agarwal is with the Department of Electrical Engineering, IIT-Bombay, Powai, Mumbai-400 076, India (e-mail: [email protected], F a x : + 9 1 - 2 2 - 2 5 7 2 3 7 0 7 ) .
minimum phase dynamics in low speed region and constrained by speed limit in high speed region. This further complicates the control tasks at various levels. The system is constrained by many fundamental limitations [1]. This warrants a robust control structure in the system.
This paper presents a robust control structure based on Quantitative Feedback Theory (QFT) [6, 7] for a WECS which provides power tracking property with desired filtering mechanism, including the disturbance rejection ability. The control design is based on frequency response and takes into account the variation in dc-link voltage, speed of generator, sensor gain and amplification factors. This also allows the option of dynamically changing the reference signals such as turbine speed, machine torque, flux of the machine and power delivered.
Wind Turbine
Wind Gear
Box
Low- speed Shaft
High- speed Shaft
Generator
Back-to-Back Converter
Grid
Fig. 1 Schematic diagram of wind energy conversion system
The paper is organized as follows:
Section II provides the modeling of a WECS. Section III describes the quantitative feedback theory. Section IV presents a controller design based on quantitative feedback theory. Simulation and result analysis are included in section V. The major conclusions of the work are included in Section VI.
II. MODELING OF WECS
Modeling of wind energy conversion system is developed in this section [1-4].
(a) Wind model
Wind speed simulates the real-time wind speed profile and is approximated as the superposition of a slowly varying mean speed V and sinusoidal component having amplitudes, Ai and periods, i.
cos( ) 1
n
V V i Ai it
(1)
A Quantitative Feedback Theory Based Control of a Variable Speed Squirrel Cage Induction Generator Driven by Wind Turbine
R.K. Thakur
1, and V. Agarwal
2, Senior Member, IEEE
W
PEDS2009
1577
(b) Wind turbine
The wind power is converted into mechanical power as per the aerodynamic power-speed characteristics of the wind turbine. The mechanical power is a function of wind speed (V), rotor speed (T) and the tip-speed ratio (ë), and is given by the following equation:
1 ( )
3mech
2
d pP A RC V
(2) The wind speed varies drastically and so is the mechanical power. Hence, there is large fluctuation in the mechanical power of the turbine. This has adverse effect on the regulation of induced voltage in induction generator.Tip-speed ratio (ë) is a function of linear velocity of tip of the blade and the wind velocity and is given by the following equation:
T
R
V
(3) The tip-speed ratio is a function of wind velocity and speed of the tip of the blade and so this parameter will vary as per the variation of wind speed and with the variation in the speed of tip of the blade. Thus, there is uncertainty in the value of tip-speed ratio.
The power co-efficient (Cp) is a non-linear function of the tip-speed ratio (ë), pitch angle (â) and blade design. It is given by the following equation:
( 3)
(0.44 0.0176 ) sin 0.00184( 3)
15 0.3
Cp
(4)
In most of the studies, it is regarded as a constant for all rotor speeds which is aerodynamically not true and its variation at different rotor speeds must be accounted for during investigations. Hence, there is uncertainty in the power co-efficient value also.
Electric power,
P
el P
mech (5) where, is function of T(c) Mass inertia model of Wind turbine generator system The mechanical component of a wind turbine generator system is represented by two-mass-inertia system. The flexible shaft between the wind turbine rotor and the generator is represented by a spring-damper link as shown in Fig. 2.
Fig. 2 Diagram of wind turbine and generator as two-mass-inertia system coupled with spring
The dynamics of this system are represented by the
following equations [1, 8-10]:
(6)
(7) ( )
T
T T D
G
G D G
D s T G
J d T T
dt
J d T T
dt
T K
G
(8) (9)
G ref
dc
dc dc
T P
dV
dt C V
Re-defining the state variables to obtain a state-space model of the wind turbine - generator system, we get [1],
1 2 3
T G
T G
dc dc
x x
x V V
(10)1 2
2 1
2 3
3
1 ( )
( )
s G
G
G
dc dc
x x
x K x T
J
x x T
C V x
(11)
Setting,
3
1 3 2 2
0 2
( )
dc G
V x
T K x K x
x
(12)Using (11) and (12), we obtain the system state model of the wind turbine - induction generator.
1 1
2 2 1 2
0 0
3 3
2 1
2
2 2 3 1 3
0 0
2
2 2 1 2 3
0 0
0 1 0
1 1
1 1
0
0
1 1
1 1
s dc dc
G G G
dc dc
G G
dc dc
x x
K V V
x K K x
J J J
x x
K K
C C
K x x K x
J J
K x K x x
C C
(13)
The system model (13) includes perturbation, g(x) as:
x = Ax + g(x)
(14)where,
PEDS2009
2 1
0 0
2 1
0 1 0
1 1
1 1
0
s dc dc
G G G
dc dc
K V V
A K K
J J J
K K
C C
and,
2
2 2 3 1 3
0 0
2
2 2 1 2 3
0 0
0
1 1
( )
1 1
G G
dc dc
g x K x x K x
J J
K x K x x
C C
The order of the perturbation, g(x) is two and so it doesn’t affect the linearization. Hence, if the linear part of the system is stable through appropriate choice of feedback gain K1 and K2, then the origin of the boundary system is locally exponentially stable [1, 5]. Thus, the system under study is given by
x = Ax
(15) Equation (15) is a linear model of the system representing the dynamic behaviour of the turbine and induction generator under structured uncertainty caused by the variation in the wind speed. This equation is used for further investigations into the robustness of the system. Influence of the torsion dynamics and dc-link voltage dynamics on the grid through the delivered active power is eliminated by using the generator torque TG to achieve damping by controller design based on quantitative feedback theory.III. QUANTITATIVE FEEDBACK THEORY (QFT) QFT deals with the design of feedback control system based on frequency response of the system transfer function [6, 7] for robust performance under parameter uncertainty.
The block diagram representation of QFT is shown in Fig. 3.
It comprises a filter, F(s) and a controller, G(s).
F(s) G(s) P(s)
+ -
R + + Y
+ +
D1 D2
+ +
N
Fig. 3 Block diagram of a quantitative feedback theory based control system
Design of filter, F(s) enhances the smooth tracking of the system output within user defined specifications with desired disturbance rejection. Design of controller, G(s) improves the stability of the system and makes the system robust against parameter variations and uncertainty. It also facilitates reduction in the effects of disturbances D1 and D2
and noise N. It has applications in non-linear and multiple- input multiple-output (MIMO) systems. To implement QFT, a MIMO system is mapped onto a number of single loop feedback systems in which the parameter uncertainty, cross coupling effects and system performance tolerance are derived from the original MIMO system [7]. The solution of each single loop system together represents a solution to the MIMO plant. The wind energy conversion system is a highly interacting, non-linear MIMO system [7, 8]. Thus, quantitative feedback theory provides a platform for robust control strategy for WECS. The plant transfer function, P(s) is obtained from (15).
2 2
0 2 2
0
2 1 0
..
...
1 ( )
( ) 3 1 1
(1 ) (
( 1))
dc s
dc G G
dc dc
s
dc G G
dc s
dc G dc
V K K
s s
C J J
P s V K C
s s K
C J J
V K K
K s
C J C
(16)
The system represented by (16) has three poles and two zeroes. The zeroes are located in the right half of the s-plane and hence the system has non-minimum phase dynamics [9, 10]. Therefore, the feedback gain values, K1 and K2 of the system need to be designed in such a way that the system performance is stable at all operating conditions [11, 12].
The parameters considered for the design are same as used by Novak, et al., [13].
The system parameters are as follows:
0
4 2
600 ; 1200 ; 6.1
85 /sec; 1.27 /
dc dc G
s
V Volts C F J e kgm
rad K e N m
The open loop plant transfer function, P0(s) is obtained from (16),
[ 2 1 196.7231]
( )
0 3 2
1 1
K s a s P s
s a s b s
(17) where,
Vdc 2 Vdc 2 1
1 1
K= ; a =1 ; b1 ( )
0 0
K K K
J Ks
Cdc JG G Cdc
PEDS2009
1579
IV.QFTCONTROLLER DESIGN
The range of parameters, K, a1 and b1 considered are K = [800 700 600]; a1 = [0.11572 0.5786 1.1972]; b1 = [294 500 1170]. The variations in parameters as well as in operating conditions considered in this design are shown in table1 in terms of coefficients of polynomials.
TABLE 1
VARIATION AS PER THE CHANGE IN PARAMETERS OF THE SYSTEM AND OPERATING CONDITIONS
Parameters Minimum value Maximum value
Plant gain, K 600 800
Coefficients, a1 0.11572 1.1972
Coefficients, b1 294 1170
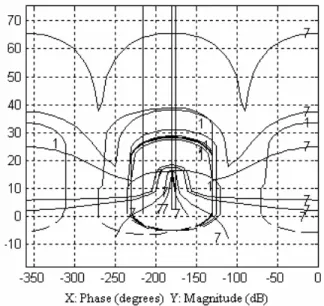
Based on the quantitative feedback theory, the constrains in stability and disturbance rejection are analyzed. Considering the variation of parameter as listed in table 1 and taking the frequency range from 0.001 – 20 rad/sec, the margins and tracking bounds of the system (17) are obtained. The margins and tracking bounds and loop shaping are shown in Figs. 4 and 5.
Fig. 4 Diagram showing Margins and Tracking bounds
Fig. 5 Diagram showing bounds and loop shaping
The open loop system frequency response plot of the nominal plant is contained in the instability region of the stability bounds. The graphical method of employing the quantitative feedback control strategy is used to develop the control structure for stability bounds.
The design of controller and filter are carried out for tracking the dc-link voltage in wind energy conversion system with structured parameter variations and disturbance rejection graphically. The graphical plots are shown in Figs. 6 and 7.
Fig. 6 Diagram showing controller design
Fig. 7 Diagram showing filter design
The controller transfer function is obtained from Figs. 6:
( ) 0.25
( 25)
G s s
(18) The filter parameter as obtained from Fig. 7 is as follows:
( ) 1
( 0.05)
F s s (19) PEDS2009
V. SIMULATION AND ANALYSIS
The block diagram representation of the system with and without QFT controller in MATLAB/SIMULINK software is shown in Fig. 8.
Fig. 8 Block diagram representation of the system with and without QFT controller
A random signal is used at the input to investigate the dynamics of both with and without the QFT controller feedback system. The simulation results are obtained for the two values of ‘b’ which are shown in Figs. 9 (a) and (b) and two values of gain ‘K’ which are shown in Figs. 10 (a) and (b). It is observed that the amplitude of the output response of the system without the QFT controller is larger in comparison to
Fig. 9 Variation in output dc-voltage with random variation in input with (a) b1=1122 and (b) b1=1160.
that with the QFT based controller. Also, there is no variation in the magnitude of the output response with QFT controller on varying the value of ‘b’, while it changes in the case when QFT controller is not used. Fig. 10(a) is obtained without using the QFT controller whereas Fig. 10(b) is obtained with QFT controller. There is an under-damped
response in Fig. 10(a), which indicates the non-minimum phase dynamics of the system. and also the system response is oscillatory for K=800 whereas for K=600, it is damped.
Thus, it is concluded that the system response is dependent significantly on the parameter K. The response in Fig. 10(b) is smooth and same for both the values of K. Therefore, it validates that the use of QFT makes the system robust to parameter variation. Thus, it is verified through simulation that the use of QFT based controller reduces the variation in the output response significantly and improves the system performance considerably.
(a)
(b)
Fig. 10 Simulation results with value of Gain K=600, 800 for (a) without (b) with QFT controller
Thus, the robustness in case of the system with QFT controller to the variation of parameters, b1 from 1122 to 1160 and K from 600 to 800 is established. This indicates that the variation in the value of turbine torque will have reduced impact on the grid side. The regulation of the dc- link voltage will be smoother which, in turn, will improve the power quality at grid.
VI. CONCLUSION
A quantitative feedback theory based design of control system for a variable-speed squirrel cage induction generator driven by wind turbine has been presented. It has been
PEDS2009
1581
shown that the stability increases over a wide range of coefficient values. The impact of variations in the input on the output response has shown to be reduced considerably.
The simulation of the proposed control strategy has validated the possibility to regulate torsion and dc-link voltage dynamics. This means the reduction in the influence of the internal modes on the grid. Thus, the system is robust to the structured parameter uncertainty.
ACKNOWLEDGMENT
The authors wish to thank Prof. P. S. V. Nataraj, IIT- Bombay, for his help during the course of this work.
REFERENCES
[1] G RBarry, W L Peter and M Manfredi, “A control methodology to mitigate the grid impact of wind turbines”, IEEE Trans. Energy Conversion, vol. 22, no. 2, 2007, pp. 431-438.
[2] R. Pena, R. Cardenas, R. Blasco, G. Asher and J. Clare, “A cage induction generator using back-to-back PWM converters for variable speed grid connected wind energy system”, IECON’01, 2001, pp. 1376-1381.
[3] B. Connor and W. E. Leithead, “Control of variable speed wind turbines: dynamic models”, International Journal of Control, vol. 73, no. 13, 2000, pp. 1173-1188.
[4] B. Connor and W. E. Leithead, “Control of variable speed wind turbines: design task”, International Journal of control, vol. 73, no.
13, 2000, pp. 1189-1212.
[5] H. Khalil, Nonlinear Systems, Prentice Hall, New York, 2002 [6] C. H. Houpis, S. J. Rasmussen and M. Garcia-Sanz, Quantitative
Feedback Theory Fundamentals and Applications, 2 ed, CRC Taylor
& Francis, New York, 2006.M. Young, The Technical Writers Handbook. Mill Valley, CA: University Science, 1989.
[7] C. H. Houpis, S. J. Rasmussen and M. Garcia-Sanz, Quantitative Feedback Theory Fundamentals and Applications, 2 ed, CRC Taylor & Francis, New York, 2006.
[8] Z. Cen and E. Spooner, “Grid power quality with variable speed wind turbines”, IEEE Trans. Energy Conversion, vol.
16, no. 2, Jun., 2001, pp. 148-154.
[9] M. Molinas, B. Naess, W. Gullvik and T. Undeland, “Control of wind turbines with induction generators interfaced to the grid with power electronics converters”, Proceedings of IECON’01, Dec., 2001 [10] R. Teodorescu and F. Blaabjerg, “Flexible control of small wind
turbines with grid failure detection operating in stand-alone and grid- connected mode”, IEEE Trans. Power Electronics, vol. 19, no. 5, Sept. 2004, pp. 1323-1332.
[11] H. H. El-Tamaly, M. A. A. Wahab and A. H. Kasem, “Simulation of directly grid-connected wind turbines for voltage fluctuation evaluation”, International Journal of Applied Engineering Research, vol. 2, no. 1, 2007, pp. 15-39.
[12] W. E. Leithead and S. Dominguez, “Controller design for the cancellation of the tower fore-aft mode in a wind turbine”, proc. of the 44th IEEE Conf. on Decision and Control, and the European Control Conf., Spain, Dec., 2005, pp. 1276-1281.
[13] P. Novak, T. Ekelund, I. Jovik and B. Schmidtbauer, “Modeling and control of variable speed wind turbine drive system dynamics”, IEEE Control Systems, Aug. 1995, pp. 28-38.
List of symbols:
,
,
, -
-
i i
m e c h d
p
V W in d sp e e d V W in d m e a n sp e ed n N u m b e r o f co m p o n en ts
A A m p litu d e fre q u en c y P M e ch a n ic a l p o w e r
A D isc a rea A ir d e n sity
T ip sp e ed ra tio
R R a d iu s o f th e w in d tu rb in e C P o w er c o ef
,
,
, , ,
e l
T G
T G
T D G
d c
fic ien t
B la d e p itc h a n g le P E le c trica l p o w e r
E ffic ie n c y
J J In e rtia o f tu rb in e a n d g e n e ra to r S p ee d o f tu r b in e a n d g e n e ra to r
T T T T o rq u e o f tu rb in e sh a ft a n d g e n e ra to r V d c L in k
0
1 2
,
, R e
ta n
, ,
d c s
s
T G
r e f d c
v o lta g e V M ea n d c L in k v o lta g e K S tiffn ess o f sh a ft
B D a m p n ess o f sh a ft
A n g le o f tu rb in e a n d g e n era to r P fe re n ce p o w e r a t g r id
C D C lin k c a p a c i ce M e a n g e n e ra to r sp ee d
K K K G a in
1 2
va r
( )
, ,
( ) ( ) ( ) ,
S ta te ia b le s A J a c o b ia n m a trix g x P e rtu rb a tio n
R In p u t Y O u tp u t N N o ise
F s F ilte r T ra n sfe r F u n ctio n G s C o n tro lle r T ra n sfe r F u n ctio n P s P la n t T ra n sfe r F u n ctio n
D D D istu rb a n ce
x
1, 1 -
a b P la n t c o effic ien ts
PEDS2009