國立臺灣大學生農學院生物產業機電工程學系 碩士論文
Department of Bio-Industrial Mechatronics Engineering College of Bioresources and Agriculture
National Taiwan University Master Thesis
對稱電極與指叉狀晶片電化學阻抗模型建立與適體感測應用 Electrochemical Impedance Modeling of Symmetric Electrodes
and Interdigitated Array Chips for Aptasensing Applications
賴知佑 Chih-Yu Lai
指導教授:陳林祈 博士 Advisor: Lin-Chi Chen, Ph.D.
中華民國 108 年 7 月 July 2019
誌謝
時光飛逝,遙想大三進實驗室,曾對眼前一片迷茫的我,轉眼間四年已過,
將面對下一段挑戰。研究如人生,這段路途時而艱辛、時而喜悅,如此珍貴的經歷 無以言喻,於回憶的畫本上描繪雋永的色澤。
感謝陳林祈老師多年來的教導,除了許多的想法與建議,還提供我空間得以 發展許多感興趣的研究,讓我有自信拓展不同的領域,更鼓勵我參與許多國內外研 討會,讓我體會學術界的深廣並開拓我的視野。感謝陳倩瑜老師於升大三至大三時 在生醫資訊方面和機器學習方面技能的增長,還有在相關競賽上學長們的協助。感 謝侯詠德老師於大二下教授生化概論以及給我的肯定,帶領我踏入一個全新的領 域。感謝口試委員何國川老師、周家復老師、鄭宗記老師及魏培坤老師撥冗參與碩 論口試,肯定我的研究以及給予多方面的建議,感謝數不清引導我至今的師長。
感謝噹噹帶領我做許多實驗與製程技術,每當有疑問時總是能一起討論個水 落石出。感謝登凱在生化技術上的指點與建議,總讓我感覺中研院比想像中還更熟 悉!感謝誠專、Ella、珮瑋、修瑋、靜容、婉茹、裕夫、奇翰、伊敏、柔宣、禮丞、
惟甄、唯里、聖丰及亭萱所有學術上的支持與研究上的鼓勵,帶給我多采多姿的實 驗室生活。感謝實驗室每一位學長姐與學弟妹,給予 403 實驗室豐富歡樂的氣氛。
我想要特別感謝我的家人與惟甄,在風雨交加的夜晚,你們帶給我希望與關 懷,讓我知道我並不孤單,且世上是有如此溫暖與美好。尚未到這趟旅程的終點,
我將攜帶滿滿回憶前往下一站,期望能將所獲所學啟發無數殷勤弟子,奉獻予公益、
回饋予社會。
摘要
腫瘤標誌之偵測與抑制成為近年癌症預防及治療的新趨勢,此類標誌常利用 操作簡易及低成本之電化學阻抗頻譜法(electrochemical impedance spectroscopy,簡 稱 EIS)、配合靈敏度及專一性高的適體感測(aptasensing)技術進行量測,於近年之 生物分析應用蓬勃發展。然而三極式電化學系統之微小化面臨設計與製程複雜、高 成本與低製作良率等問題,且近年廣泛應用於電化學感測技術之二極式指叉狀電 極(interdigitated array electrodes,簡稱 IDA electrodes)因幾何特性複雜,尚未有根據 其帶寬(bandwidth)與間距(gap width)推導其擴散阻抗(diffusion impedance)之文獻。
因此本論文以對稱二極式阻抗感測模型之建立為主軸,推導不同幾何之指叉狀電 極擴散阻抗公式,發展對稱二極式電極等效電路模型並進行阻抗式適體感測,主要 以兩個部分進行探討並分述如下:第一部分著重於指叉狀電極擴散阻抗的理論推 導與驗證。利用共形變換(conformal mapping)及圓柱有限長度近似方法(cylindrical finite length approximation)推導不同幾何之指叉狀電極擴散阻抗積分型公式解,並 且套用在現今之指叉狀電極電化學系統中。此部分之研究導出能夠針對不同電極 帶寬、間距、擴散係數…等參數而直接計算出其擴散阻抗之理論公式,九種不同帶 寬與間距之指叉狀電極利用微製程技術製作而成。時間相依(time-dependent)二維擴 散之模擬結果證實理論中假想等濃度邊界的存在與理論之可行性,理論所計算之
0Hz 擴散阻抗與前人研究所推導之極限電流計算公式的倒數有高度線性相關(R2 =
0.992),實驗所得極限電流倒數與計算之0Hz 擴散阻抗具高度相關性(R2 = 0.970),
所推導的公式能夠精準預測其電化學阻抗頻譜量測結果(R2 ≥ 0.948),且已驗證可透
過此理論進行等效電路匹配(equivalent circuit fitting)並成功預測其電極幾何。此部 分可提供指叉狀電極於低頻量測區間阻抗變化之解釋,有助於相關領域之學者對 於此種系統的擴散行為更進一步的認知與等效電路模型之建立。第二部分推導對 稱二極式電極等效電路模型並利用標準金電極(standard Au electrode,簡稱 SGE)及
指叉狀電極驗證模型可行性與應用於凝血酶(thrombin)及腫瘤標誌 MUC1之量測。
若利用單一 Randles 電路進行對稱電極系統之等效電路匹配,則其參數 Rct與 Rs會
是實際值的兩倍、Q0與 Y0會是實際值的一半、且 n 會與實際值相同。此理論利用
兩種不同幾何之對稱電極晶片進行驗證,應用於適體感測器之初步概念驗證利用
凝血酶(thrombin)作為感測標的且 KD為129.4nM。MUC1與其硫醇基修飾過之 DNA
適體(5’SH-(CH2)6-S2.2)透過三極式適體感測器量測之 KD為15.11nM,根據專一性
結合模型計算之最大阻抗變化(Bmax)為7.91kΩ,接著發現 MUC1之對稱二極式適體
感測器量測之 KD為15.92nM 且 Bmax為17.08kΩ,此兩組 KD結果相近,而 Bmax約 為兩倍關係,與推導的模型所得到的結果一致,證明此理論模型應用於生物感測的 正確性。利用指叉狀電極製作的凝血酶適體感測器,其電化學阻抗頻譜結果可利用 第一部分根據理論所製作的等效電路匹配程式得到準確的參數,且此感測器具有 可重複測量六次之再生性(regenerability)以及專一性(specificity)。對稱二極式金電 極系統簡單、低成本與適體之高度穩定性極有助於商業化過程之大量生產與客製 化。藉由上述之研究成果,期望在未來可利用指叉狀電極進行微小化發展並應用於 相關醫療診斷,更甚能實現於個人化醫療與定點照護中。
關鍵字:指叉狀電極、電化學阻抗頻譜、有限擴散、對稱電極、適體感測
Abstract
The inhibition of tumor markers has been a popular research object among the academic society. They are often detected using simple and low-cost techniques such as electrochemical impedance spectroscopy (EIS), which aptamers are occasionally used as the sensing element for achieving high sensitivity and selectivity. This integrated method has flourished in recent years. However, for electrochemical methods, a three electrode setup faces fabrication complexity, high cost and low yield rates during miniaturization. Two electrode impedimetric detection using interdigitated array (IDA) electrodes also faces a problem. Due to its geometry, there hasn’t been any studies that derive its diffusion impedance according to different bandwidths and gap widths. Therefore, this study makes a basis on impedimetric modeling of symmetric two electrode systems. The first part focuses on the derivation and verification of an integral form of solution for IDA diffusion impedance. Conformal mapping and cylindrical finite length approximation methods are used in theory. Simulations are performed for confirming assumptions such as the imaginary constant concentration boundary (ICCB). Nine electrodes of different bandwidths and gap widths are fabricated with their heights and symmetric electrochemical characteristics verified. The calculated zero-frequency impedance showed high correlation with the reciprocal of limiting current calculated from previous studies (R2 = 0.992) and from chronoamperometry experiments (R2 = 0.970). Further evidence for the correctness of theory is established due to the fact that experimental EIS data and calculated impedances are highly consistent (R2 ≥ 0.948 for real and imaginary part). This sheds some light on explaining the phenomenon of diffusion impedance using IDA electrodes in the low frequency spectrum. An equivalent circuit fitting program succeeded to accurately fit the EIS data and parameters such as the ratio of electrode bandwidth to gap width and diffusion coefficient can also be obtained by fitting the data from a single EIS experiment. This can aid
researchers in relevant fields model their systems more accurately. In the second part, a symmetric equivalent circuit model is developed, and it is applied it for impedimetric detection of thrombin and a tumor marker MUC1 with a fabricated aptasensor using standard Au electrodes (SGE) and IDA chips. If a single Randles circuit is used for equivalent circuit fitting on a symmetric electrode system, Rct and Rs would be double the real value, Q0 and Y0 would be half the real value, and n would be the same. This relationship is proven using experimental data from two kinds of micro-fabricated symmetric electrode chips. Thrombin is used for the proof of concept and a KD of 129.4nM is obtained using the symmetric electrode setup. MUC1 is detected by the thiolated S2.2 aptamer using a three electrode setup and the KD is 15.11nM.
The calculated max binding value (Bmax) according to one-site specific binding model is 7.91kΩ.
Using a two electrode setup, the KD is 15.92nM and the Bmax is 17.08kΩ. The calculated KD values for two and three electrode setups are consistent, and the ratio between Bmax is about 2, which corresponds to the developed model. This proves the correctness of the model applied for bio-detection. IDA chips are used for aptasensor fabrication for thrombin detection. The program designed in the first part is used for circuit fitting of EIS data, and accurate parameters are obtained. This sensor has the regenerability for six times of detection and the specificity is also confirmed. Symmetric Au electrode systems have simple and low fabrication cost characteristics. Its integration with highly stable aptamers can contribute to mass production and customization in product commercialization. According to the above results, the author anticipates future developments in relevant medical diagnosis and point-of-care applications.
Keywords: interdigitated array (IDA) electrodes, electrochemical impedance spectroscopy (EIS), finite diffusion, symmetric electrodes, aptasensing
Table of Contents
誌謝…... ... i
摘要……… ... ii
Abstract……….. ... iv
Table of Contents ... vi
List of Figures ... x
List of Tables ... xiv
Frequent Abbreviations ... xv
Major Symbols ... xvi
Chapter 1 Introduction ... 1
1.1 Preface ... 1
1.2 Research Motivation ... 3
1.3 Research Aims ... 5
1.4 Research Framework ... 6
Chapter 2 Literature Review ... 8
2.1 EIS in Affinity-Based Biosensors ... 8
2.1.1 A Brief Introduction of EIS ... 9
2.1.2 EIS Applied in Affinity-Based Measurements ... 10
2.2 Impedimetric Biosensors using IDA Electrodes ... 12
2.2.1 A Brief Introduction of IDA Electrodes ... 12
2.2.2 Issues in Low Frequency Domain ... 14
2.3 Equivalent Circuit Fitting for Symmetric Electrode Systems ... 18
2.4 Miniaturized Electrochemical Systems ... 19
2.4.1 Implementation Issues of Two and Three Electrode Setups ... 20
2.4.2 Miniaturized Impedimetric Detection Systems ... 22
2.5 Affinity-Based Detection using Aptasensors ... 25
Chapter 3 Diffusion Impedance Modeling for IDA Electrodes ... 28
3.1 Brief Introduction ... 28
3.2 Theory ... 31
3.2.1 Unit Cell and Imaginary Constant Concentration Boundary (ICCB) ... 32
3.2.2 Finite Diffusion Length Derivation ... 35
3.2.3 Cylindrical Finite Diffusion Inside Differential Area ... 41
3.2.4 Dimensionless and Parameterized Form of IDA Diffusion Impedance ... 44
3.2.5 Limiting Cases with Geometrical Parameters ... 46
3.3 Materials and Methods ... 48
3.3.1 Reagents and Materials ... 48
3.3.2 Design and Fabrication ... 48
3.3.3 Electrochemical Characterization ... 50
3.3.4 Simulation of Concentration Profile ... 51
3.3.5 Impedance Calculation and Circuit Fitting Program ... 53
3.4 Results and Discussion ... 54
3.4.1 Interpretation of Normalized IDA Diffusion Impedance ... 54
3.4.2 Characterization of IDA Electrode Microwell Chip ... 56
3.4.3 Simulation of Time-Dependent 2D Concentration Profile in Unit Cell ... 60
3.4.4 Comparison of Limiting Current and Calculated Impedance as ω→0 ... 65
3.4.5 Comparison of Experimental EIS Data and Theoretical Impedances ... 69
3.4.6 EIS Data Fitting using Different Diffusion Impedance Elements ... 74
3.5 Summary ... 81
Chapter 4 EIS Modeling of Symmetric Electrodes for Aptasensing ... 82
4.1 Brief Introduction ... 82
4.2 Theory ... 84
4.2.1 Impedance Calculation for the Randles Circuit ... 84
4.2.2 Calculations for a Symmetric Randles Circuit ... 88
4.3 Materials and Methods ... 90
4.3.1 Reagents and Materials ... 90
4.3.2 Instruments and Equipment ... 91
4.3.3 Fabrication of Symmetric Au Electrode Chips ... 92
4.3.3.1 Electrode Design ... 93
4.3.3.2 S1813 Photolithography ... 93
4.3.3.3 E-beam Au Evaporation ... 94
4.3.4 Experimental Proof of Theory ... 95
4.3.5 Fabrication of Impedimetric Aptasensor using Two Standard Au Electrodes ... 98
4.3.6 Fabrication of Regenerable Impedimetric Aptasensor using IDA Chips ... 99
4.4 Results and Discussion ... 100
4.4.1 Proof of Theory ... 100
4.4.2 Optimizing the Operating Sensing Voltage (Einit) ... 103
4.4.3 Proof of Concept by Thrombin Aptasensing ... 104
4.4.4 MUC1 Aptasensor using a Three Electrode Configuration ... 106
4.4.5 MUC1 Aptasensor using Two Symmetric Au Electrodes ... 107
4.4.6 DNA Sequence Specificity Towards MUC1 and BSA ... 109
4.4.7 Regenerability and Specificity of Thrombin IDA Aptasensor ... 111
4.5 Summary ... 118
Chapter 5 Conclusion ... 119
5.1 Conclusion ... 119
5.2 Future Work ... 121
References……… ... 122
Appendices (Supplementary Material) ... 131
S.1 Detailed Derivations of Equations in Theory ... 131
S.1.1 Equation (10) to (12) ... 131
S.1.2 Equation (12) and (13) to (20) ... 132
S.2 The Potential Symmetry of IDA Electrodes ... 133
S.3 Diffusion Coefficient Calculation using Randles-Sevcik Equation ... 134
S.4 Limiting Current of IDA Electrodes ... 135
S.5 Comparison of Electrode Compositions in Two and Three Electrode Systems ... 136
S.6 IDA Diffusion Impedance Calculation Program ... 138
S.7 Real-time Impedimetric MUC1 Aptasensor using Microfluidic IDA Chips ... 140
S.7.1 Microfluidic System Integration ... 140
S.7.2 Impedimetric Aptasensing of Target Protein ... 142
S.7.3 Characterization of IDA Electrode Microfluidic Chip ... 143
S.7.4 Real-Time EIS Detection Frequency Optimization ... 144
S.7.5 Real-Time Impedimetric Aptasensing of MUC1 ... 146
S.8 Portable Devices for Integrated Bio-Sensing Platforms ... 148
S.8.1 Generation α (Z_GENα) ... 149
S.8.1.2 Schematic Design ... 150
S.8.1.3 LabVIEW Data Analysis Design ... 150
S.8.1.4 Stability Test for Impedance Detection using Z_GENα ... 152
S.8.2 Generation β (Z_GENβ)... 153
S.8.2.1 Preface and Concepts ... 153
S.8.2.2 Schematic Design ... 154
S.8.2.3 Data Processing ... 155
S.8.2.4 Website Server... 157
S.8.3 Preliminary Results for Z_GENβ ... 158
S.8.3.1 Fabrication and Setup Results ... 158
S.8.3.2 Microfluidic Impedimetric Detection of Bare IDA Electrodes ... 160
List of Figures
Figure 1-1 The research framework for this thesis. ... 7 Figure 2-1 (a) Redox mediator (species) associated binding event and its (b) ΔRct vs
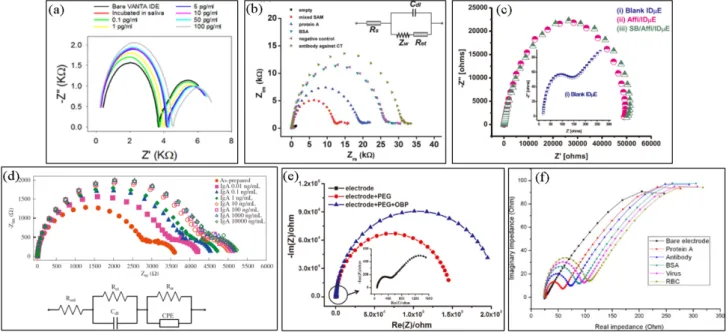
concentration signal relationship on an Au electrode. ... 11 Figure 2-2 Studies exhibiting IDA diffusion phenomenon. (a) (Ding et al., 2018) (b) (Chiriaco
et al., 2011) (c) (Zhurauski et al., 2018) (d) (Ohno et al., 2013) (e) (Lu et al., 2015) (f) (R. Wang et al., 2009). ... 17 Figure 2-3 Issues in three electrode system miniaturization. ... 21 Figure 2-4 Typical process for aptamer immobilization on Au electrodes. ... 26 Figure 2-5 Schematic representation of the electrochemical aptasensor for the detection of
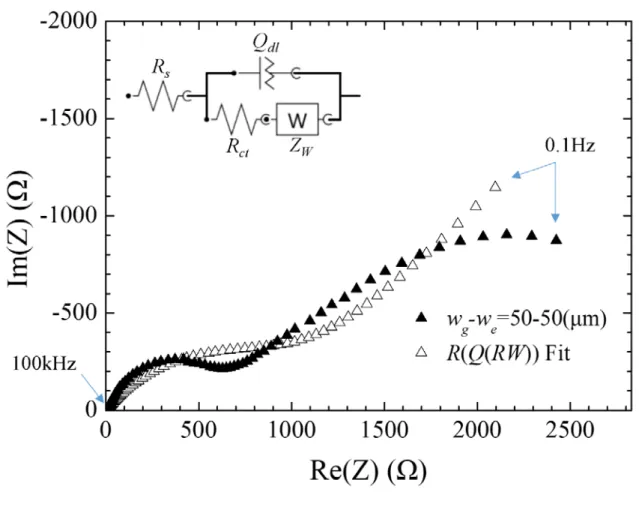
MUC1 (Liu et al., 2015). ... 27 Figure 3-1 Nyquist plot of EIS data of a bare Au IDA electrode (▲) and its fitted data (△). The
electrode bandwidth (we) and gap width (wg) are 50μm. The equivalent circuit used is shown at the upper left corner, which is a Randles circuit that uses a constant phase element (CPE or Q) for modeling the double layer capacitance. The solution contains 0.1M KCl and 5mM Fe(CN)63-/4-. The frequency range of the data is 10-1~105Hz. ... 30 Figure 3-2 (a) Geometric definition of a unit cell (red translucent region). (b) Open finite-length
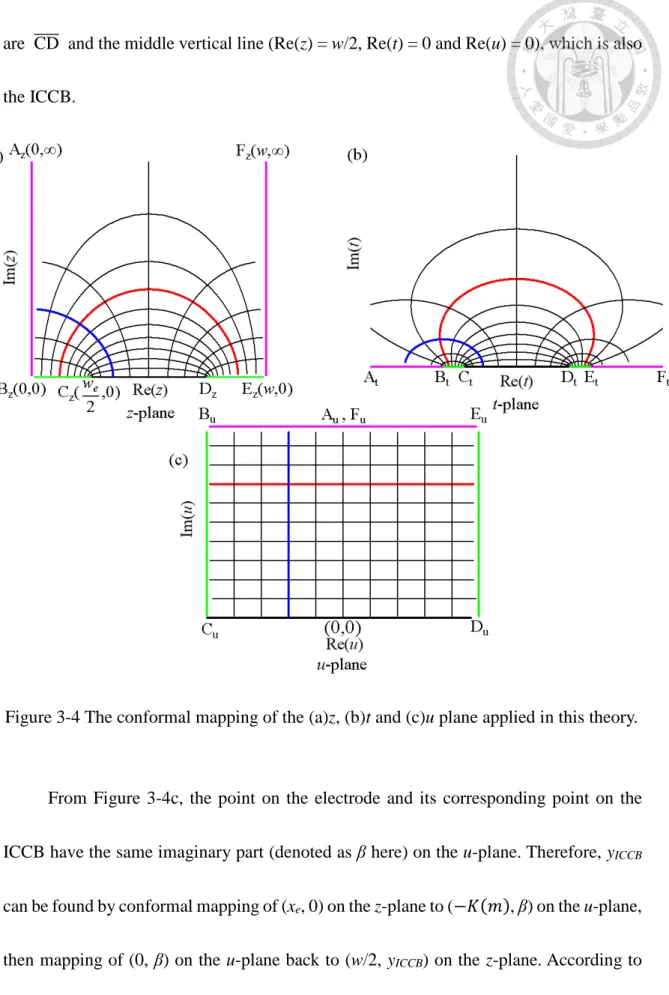
diffusion elements link between the ICCB and the electrode surface within the left half of a unit cell. ... 33 Figure 3-3 Path of redox species that finitely diffuse between the ICCB and the electrode within a unit cell. The finite diffusion length at xe is determined by the elliptic arc length. ... 36 Figure 3-4 The conformal mapping of the (a)z, (b)t and (c)u plane applied in this theory. ... 38 Figure 3-5 The finite diffusion length against the position on the electrode. ... 40 Figure 3-6 The diffusion region (gray area) of redox species between a certain length derivative
of a point on the electrode (dxe) and its corresponding length derivative on the ICCB (–
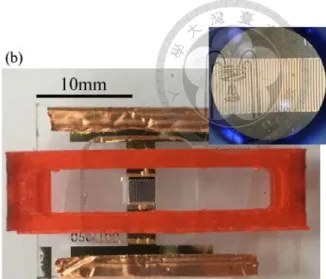
dyICCB). ... 43 Figure 3-7 (a) Illustration and (b) photograph of the IDA electrode chip clipped with a
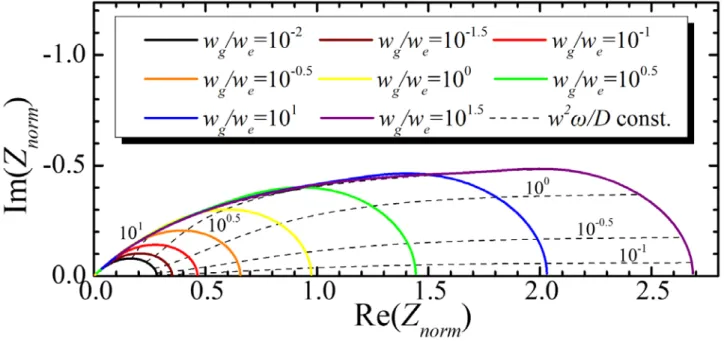
microwell. ... 50 Figure 3-8 Theoretical normalized IDA diffusion impedance for different values of wg/we and
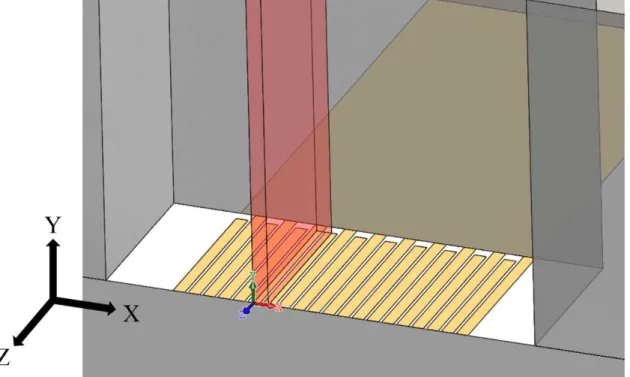
constant number of bands (N). The numbers beside the equi-frequency (dashed) lines indicate the reduced frequency w2ω/D. ... 55 Figure 3-9 Sectional view of the microwell chip with the red translucent region as the defined
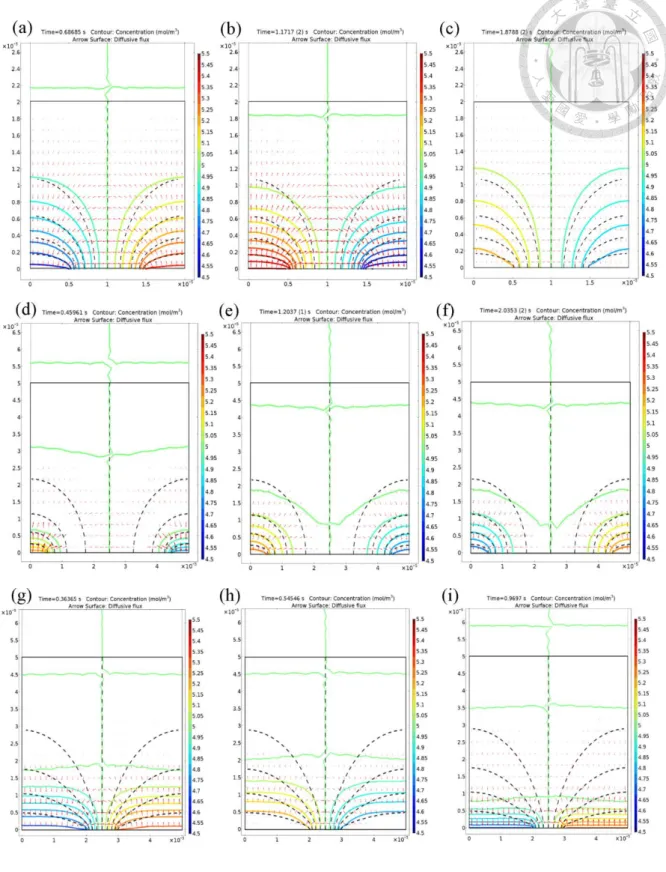
unit cell with coordinates... 56 Figure 3-10 1D height (y) profile of IDA electrodes. ... 58 Figure 3-11 Simulation of time-dependent 2D concentration profile in an IDA unit cell. we-wg =
(a)~(c) 10-10, (d)~(f) 40-10 and (g)~(i) 10-40 (μm). The colored lines are simulated constant concentration contours and the black dashed lines are the predicted contours. 62 Figure 3-12 The reciprocal of limiting current plotted against the calculated real part of IDA
diffusion impedance at ω→0. |Ilim| is (a) the absolute value of limiting current calculated from eqn. (38) in Aoki et al.’s work (Aoki et al., 1988), or the current at 10s when applying a voltage of –0.2V (vs CE/RE) in a solution containing 0.1M KCl and (b) 5mM Fe(CN)63-/4- or (c) 5mM Fe(CN)63- in a chronoamperometry experiment. ... 65 Figure 3-13 (a) Nyquist plot of experimental EIS data of an IDA electrode (wg-we = 100-
50(μm)) and its equivalent circuit fitted data. The frequency range of the experimental data is 10-2 ~ 105Hz and the frequency range used for fitting is 1 ~ 105Hz. The subfigure at the top-left is the circuit being fitted and is equivalent to R(Q(RQ)), which is a typical Randles circuit using a CPE for characterizing the diffusion impedance. (b ~ d) Nyquist plot of experimental (solid) and calculated (hollow) IDA diffusion impedances at (b) wg
= 100, (c) wg = 50 and (d) wg ≤ 25. The frequency range of all the data is 10-2 ~ 105Hz.
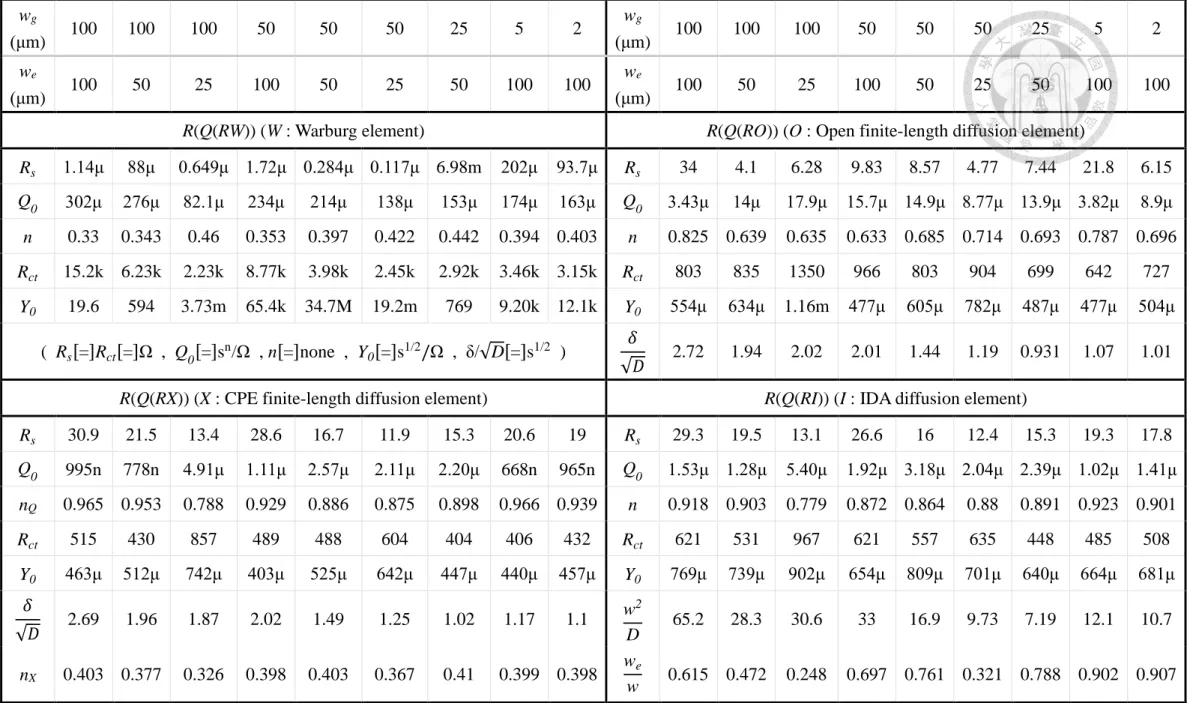
The unit for widths is μm. ... 71 Figure 3-14 Raw and fitted EIS data of three bare IDA electrode chip with the Randles circuit
using different elements for diffusion impedance modeling. (a) Warburg element, (b) open finite-length diffusion element, (c) CPE finite-length diffusion element and (d) IDA diffusion element. The frequency range of all the data is 10-2 ~ 105Hz. (units:
μm) ... 77 Figure 3-15 (a) S/Nf (or MSE) of the fitting results for the nine IDA electrode chips using
different diffusion impedance elements. (b) Calculated and fitted values of Y0 from the nine chips. (c) Fitted value of w2/D against its calculated value. (d) Fitted value of we/w against its calculated value. ... 80 Figure 4-1 (a) Structure of MUC1. PDB ID: 1SM3 (b) Final conformation of the MUC1-G
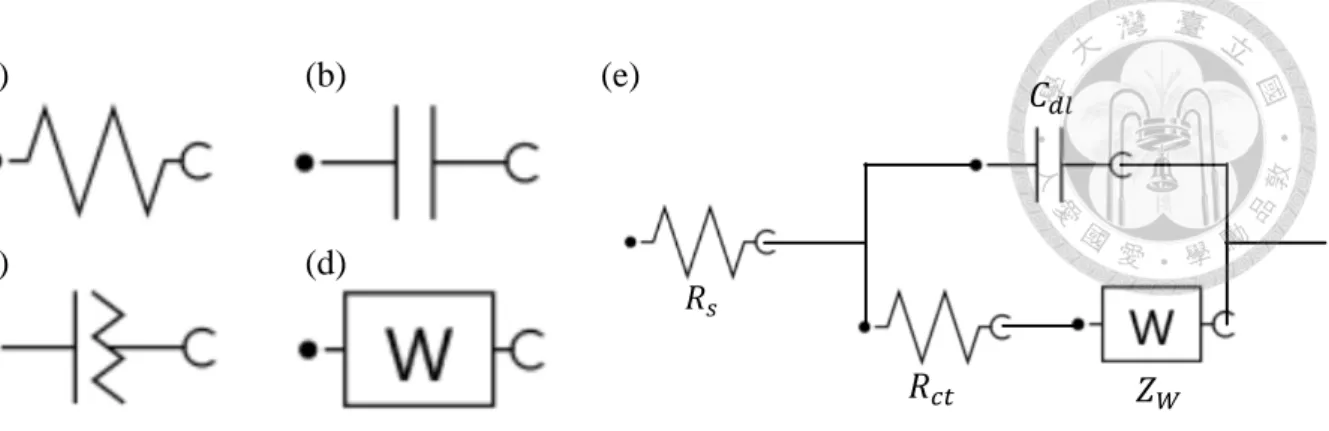
peptide and S2.2 aptamer interaction (Rhinehardt et al., 2015). ... 83 Figure 4-2 A typical Randles circuit and its components. (a) Resistor, (b) capacitor, (c) constant
phase element, (d) Warburg element and (e) the Randles circuit. ... 85 Figure 4-3 Equivalent circuit model for a symmetric electrode system. ... 88 Figure 4-4 Fabrication process of symmetric Au electrode chips. ... 92 Figure 4-5 Setup for proof of symmetric equivalent circuit. (a) Two and three electrode setups.
(b) Dimensions for two different electrode geometries. (c) Illustration and photograph of electrode chips clipped with microwells. (not indicated units: mm) ... 97 Figure 4-6 Fabrication of impedimetric aptasensor using two standard Au electrodes. ... 98 Figure 4-7 Comparison of two and three electrode setups using SER electrode chip. (a) Bode
plot (ϕ) (b) Bode plot (|Z|) (c) Nyquist plot. ... 101 Figure 4-8 Comparison of two and three electrode setups using IDA electrode chip. (a) Bode
plot (ϕ) (b) Bode plot (|Z|) (c) Nyquist plot. ... 101
Au electrodes. (b) Nyquist plot of symmetric bare Au electrodes at different Einit. (c) Sectional view of (a) and its corresponding Rct with E = Einit. The solution contains 10mM Fe(CN)63- and 0.1M KCl. ... 103 Figure 4-10 (a) Nyquist plot of symmetric Au electrode aptasensor bound with different
concentrations of thrombin. (b) ΔRct vs thrombin concentration and fitted curve using one-site specific binding model. ... 105 Figure 4-11 Nyquist plot of three electrode setup aptasensor bound with different
concentrations of (a) MUC1 and (b) BSA. (c) ΔRct vs target concentration and fitted curve using one-site specific binding model. ... 106 Figure 4-12 Nyquist plot of two symmetric electrode setup aptasensor bound with different
concentrations of (a) MUC1 and (b) BSA. (c) ΔRct vs target concentration and fitted curve using one-site specific binding model. ... 107 Figure 4-13 Nyquist plot using different detection targets and sensing elements. Target: (a), (b)
BSA and (c), (d) MUC1. Sensing element: (a), (c) Random 25mer sequence and (b), (d):
S2.2 aptamer. ... 110 Figure 4-14 ΔRct vs target concentration and fitted curve using one-site specific binding model
for DNA sequence specificity towards MUC1 and BSA. ... 110 Figure 4-15 Nyquist plot for characterizing the fabrication, detection and regeneration process
of thrombin impedimetric aptasensor using IDA chips. (a) Chip #1 and (b) chip #2. The first six steps are shown in the sequence from “Bare” to “2M NaCl 2nd” in the
legend. ... 113 Figure 4-16 (a) Rct vs procedure steps for regenerability test using the IDA chips. (b) ΔRct (=Rct
– Rct,baseline) for specificity comparison of thrombin and HSA. ... 116
List of Tables
Table 2-1 Comparison of microfluidic and microelectrode impedimetric chip systems. ... 24
Table 3-1 Equivalent circuit elements for diffusion impedance. ... 76
Table 3-2 Equivalent circuit fitting results for nine IDA chips using four different diffusion impedance elements... 78
Table 4-1 Commonly used equivalent circuit elements. ... 86
Table 4-2 Parameter comparison of symmetric electrode systems using single Randles circuit fitting ... 89
Table 4-3 List of reagents and materials used in Chapter 4 ... 90
Table 4-4 List of instruments and equipment used in Chapter 4 ... 91
Table 4-5 Fitting results using a single Randles circuit as the equivalent circuit. ... 102
Table 4-6 Comparison of aptasensors using three and two (symmetric) Au electrode setups. . 108
Frequent Abbreviations
WE: working electrode CE: counter electrode RE: reference electrode
EIS: electrochemical impedance spectroscopy CV: cyclic voltammetry
CA: chronoamperometry IDA: interdigitated array
SER: series (used for explaining electrode geometry) ICCB: imaginary constant concentration boundary CPE: constant phase element
MSE: mean square error SGE: standard Au electrode RT: room temperature DIW: deionized water MCH: 6-mercaptohexanol MUC1: mucin-1
BSA: bovine serum albumin HSA: human serum albumin LOD: limit of detection
Major Symbols
we: electrode bandwidth ( [=] m )
wg: the gap width between two band electrodes ( [=] m ) w: unit cell width ( = we + wg )
N: total number of bands in an IDA electrode ( dimensionless )
yICCB: corresponding point of xe (a certain point on the electrode) on the ICCB ( [=] m ) Ld(xe): diffusion length at a certain point (xe) on the electrode ( [=] m )
Y0: proportional coefficient for diffusion impedance element ( [=] s1/2/Ω ) Rct: charge transfer resistance ( [=] Ω )
Rs: solution resistance ( [=] Ω )
Cdl : double layer capacitance ( [=] F or s/Ω )
Qdl (or Q0): CPE for double layer capacitance ( [=] sn/Ω )
n: exponent for CPE ( dimensionless ) (※Not to be confused with number of electrons.) ZW: Warburg diffusion impedance ( [=] Ω )
ZI or Zdiff-IDA: IDA diffusion impedance ( [=] Ω )
S: weighted sum of squares of error ( [=] Ω ) (※One of many definitions of S.) Einit: initial voltage ( DC voltage applied between WE and RE, [=] V )
KD: dissociation constant ( [=] M )
Bmax: max change of Rct caused by binding ( [=] Ω )
1
Chapter 1 Introduction
1.1 Preface
A bio-detection system is involved with one or several detection techniques such as such as optical, electrochemical and mechanical detection methods and the correspondent equipment and material. Electrochemical techniques are advantageous compared with others within bio-detection methods due to its low-cost and easy-to- integrate features. There is also no need for complex signal transduction processes because the subsequent data acquisition unit after the sensing event can usually directly attain an electrical signal (A.J. Bard and Faulkner, 2000).
Electrochemical impedance spectroscopy (EIS) is a powerful electrochemical method for bio-analyte detection in affinity-based biosensors and can be integrated into miniaturized devices due to its label-free and sensitive characteristics (Daniels and Pourmand, 2007). This trait is attractive because electrodes can easily be fabricated into a miniaturized device which the sample usage can be lowered down to a few micro-liters.
Among various electrode configurations, interdigitated array (IDA) electrodes are symmetric electrodes and have the advantages of enhanced sensitivity, increased active area and miniaturized sizes (Mazlan et al., 2017). They have been widely used in various applications (Yan et al., 2011). Their steady-state current and concentration behaviour
have been extensively researched using analytical and numerical approaches (Aoki et al., 1988).
Aptamers are artificially synthesized DNA or RNA that can be selected in vitro. This is another growing field of interest for the affinitive and selective tendency towards their target (Hianik and Wang, 2009). Their robustness allows them to survive harsh conditions and remain functional over an extended period of time (Y. C. Lim et al., 2010). This important feature can contribute to the bio-detection system, permitting them to be immobilized as sensing elements on a biosensor chip (aptasensors), packed up in miniaturized chips and delivered to remote regions. Researches on aptasensors using IDA electrode chips along with EIS bio-detection has recently gained high popularity due to several combined advantages (Arya et al., 2018; Ding et al., 2017; Zhurauski et al., 2018).
These chips have a large potential in the development of portable, real-time, multiplex and smart device integrated sensing applications.
3
1.2 Research Motivation
Novel sensing architectures are presented frequently without having a strong and powerful enough model in accordance to their detection methods. This may lead to valuable resources being eventually abandoned due to the lack of ability for its interpretation.
Taking EIS detection of IDA electrodes for example, the periodic-steady-state diffusion impedance of IDA electrodes has never been tackled using an analytical approach. A Warburg element is still often used in equivalent circuit modeling of EIS data.
However, it fails at low frequencies due to the arising steady-state current (Allen J. Bard et al., 1986; Niwa et al., 1990). In order to obtain a general method for interpreting EIS data using an IDA electrode, a model must be constructed to better evaluate the diffusion phenomenon exhibited. If that is achieved, then parameters such as wg (gap width) or we
(electrode bandwidth) can be accurately determined.
For miniaturization of electrochemical systems, symmetric electrode setups are often used due to its fabrication simplicity and high yield rate. The shape of EIS plots using these setups are known to be identical to a typical three electrode setup, and thus a single Randles circuit can be used for equivalent circuit fitting. However, to the best of the author’s knowledge, there hasn’t been any study that derives the relationship between
the parameters of the fitted data and the real parameters if a symmetric Randles circuit in series is used. In order to find the real parameters of a symmetric electrode setup using a single Randles circuit, a relationship must be established.
To sum up, the thesis is divided into two parts. The former part aims to develop a theory for finding a solution to model the diffusion impedance of IDA electrodes. The solution can be degraded for calculating the limiting current, and an equivalent circuit element is constructed for fitting the EIS data obtained. The latter part focuses on impedimetric aptasensing using symmetric electrodes. The parameter relationship between a single and symmetric Randles circuit is derived and verified, and is used in application for detection of thrombin and the tumor marker mucin-1 (MUC1).
5
1.3 Research Aims
This research is dedicated to modeling IDA and other symmetric electrodes which can for be applied for impedimetric aptasensing of proteins including tumor markers. For derivation of the diffusion impedance of IDA electrodes, not only can the theory help researchers fit their data and obtain parameters more accurately, but also assist them understand the underlying phenomenon more correctly. For relationship establishment of parameters between a single Randles circuit and symmetric electrode setups, it can simplify the fitting model used for characterization. For fabrication of impedimetric aptasensor, it has label-free and simple advantages, and can be monitored during each stage. The individual objectives for this thesis are listed as below:
1. Solution derivation for the diffusion impedance of IDA electrodes.
2. Equivalent circuit fitting using the IDA diffusion element.
3. Relationship establishment of Randles circuit parameters between three and symmetric electrode setups.
4. Impedimetric aptasensor fabrication using symmetric SGEs.
5. Fabrication of a regenerable and target specific impedimetric aptasensor using IDA electrodes.
1.4 Research Framework
This thesis consists of theoretical and applied stages. Due to incomplete fundamentals for impedimetric biosensors using symmetric electrodes, the derivations for the IDA diffusion impedance and the symmetric equivalent circuit analyzing method is carried out. Moreover, the IDA diffusion impedance is firsthand derived, and is used to make complete the theory of symmetric equivalent circuits, which derives the relationship of Randles circuit parameters between three and two symmetric electrode setups. The theory thereafter is applied for MUC1 detection using an impedimetric aptasensor made from symmetric electrodes. Parameters of two and three electrode setups for MUC1 detection are compared to verify the derived relationship, and specificity between the aptamer and target is also confirmed using a two electrode setup. At last, the two theories are used for analysis of an impedimetric aptasensor fabricated on IDA chips for thrombin detection. The whole framework is architected as in Figure 1-1.
7
Figure 1-1 The research framework for this thesis.
Chapter 2 Literature Review
2.1 EIS in Affinity-Based Biosensors
Affinity-based biosensors are analytical devices which can characterize the interactions between a bio-analyte and its corresponding recognition element with the dissociation constant (KD) serving as an important parameter for comparing the affinity strengths (Rogers, 2000). Electrochemical biosensors have been developed and studied for several decades and have prospered in a variety of different sensing methods (e.g.
potentiometric (Ivnitskii and Rishpon, 1994; Marchenko et al., 2015), amperometric (Arslan et al., 2011; Romero et al., 2010), conductive (Chaubey and Malhotra, 2002) ) and applications (Grieshaber et al., 2008; Thévenot et al., 2001). In the following section, electrochemical impedance spectroscopy (EIS) is briefly introduced and its applications in affinitive detection are discussed.
9
2.1.1 A Brief Introduction of EIS
The impedance of an electronic component is measured by applying a sinusoidal voltage wave across its two end points and measuring the resulting sinusoidal current wave. By complex analysis, the absolute impedance (|Z|) is calculated by dividing the
amplitude of the voltage wave by that of the current and the phase angle (Φ) is calculated from the phase shift between the two waves. By changing the frequency (ω) of the applied
voltage, the calculated absolute impedance and phase angle may also vary. A Bode plot can be drawn by plotting the absolute impedance or the phase angle with frequency. Still, a Nyquist plot can be drawn by calculating the real and imaginary part of impedance (Re(Z) and Im(Z)) and plotting them onto a complex plane (Hambley, 2011).
Bode plots and Nyquist plots are essential for interpreting and analyzing bio- reactions using EIS. In affinity-based impedimetric biosensors, bio-recognition elements, which can be antibodies (Daniels and Pourmand, 2007), RNA (Y. C. Lim et al., 2010), DNA (Radi et al., 2005) … etc., are immobilized onto the electrode surface and can specifically react with the bio-analyte. Upon reaction, electrochemical impedimetric properties may change and can be successfully detected by EIS. Redox species (e.g.
Fe(CN)63-/4-) can be added to increase the faradaic current across the electrode surface to increase sensitivity, while there are other capacitive biosensors which measure only the non-faradaic current induced at the electrode surface.
2.1.2 EIS Applied in Affinity-Based Measurements
Impedimetric affinitive sensing methods including EIS are label-free, which means the sample doesn’t need to undergo certain modifications for detection (Daniels and Pourmand, 2007). They are also non-destructive compared with other electrochemical techniques due to the small voltage amplitude applied on the electrochemical cell, while others including cyclic voltammetry (CV) or chronoamperometry (CA) may harm the electrode surface by significantly polarizing it (Groeber et al., 2015).
A method for KD measurement using EIS is by immobilizing the recognition element onto an electrode surface and afterwards making it contact with different concentrations of the target analyte in a solution containing redox species (e.g. Fe(CN)63- /4-). The charge transfer resistance (Rct) will be affected by interactions between the
recognition element and the analyte. Thus, by plotting the charge transfer resistance difference (ΔRct) to analyte concentration, the KD value can be calculated using Langmuir
isotherm binding models (Daniels and Pourmand, 2007).
The electrochemical setup of an EIS measurement is a direct influence to the equivalent circuit used in data fitting for obtaining component values including Rct (Yuan et al., 2010). For the before-mentioned KD measurement, a three electrode setup can be used to achieve accurate control of potential and the Randles circuit is typically
11
implemented as the equivalent circuit (Chesney, 1996). Usually, the control of potential over the working electrode (WE) isn’t critical, so a two electrode setup can also be implemented in EIS by connecting the counter (CE) and reference (RE) electrode. In two electrode setups, a voltage across the WE and CE/RE is applied (Cho et al., 2009).
To sum up, applications of EIS in KD measurement are simple, rapid, label-free, low-cost, non-destructive and sometimes even reusable (Radi et al., 2005), which is a very favorable subject regarding point-of-care needs (Rasooly, 2006; Rasooly and Jacobson, 2006; J. Wang, 2006).
Figure 2-1 (a) Redox mediator (species) associated binding event and its (b) ΔRct vs concentration signal relationship on an Au electrode.
2.2 Impedimetric Biosensors using IDA Electrodes
2.2.1 A Brief Introduction of IDA Electrodes
Electrochemical devices using interdigitated array (IDA) electrodes are gaining wide interest and are being extensively studied in a variety of fields (Mazlan et al., 2017;
Yan et al., 2011). These devices can be miniaturized on chips, have low fabrication costs, are simple to handle and have largely improved sensitivities (Barnes et al., 2012). In the past few decades, they have been applied in voltammetric (Y. Xu et al., 2016), amperometric (Weng et al., 2019), capacitive (L. Wang et al., 2017) and impedimetric (de la Rica et al., 2006; Valera et al., 2007) sensing methods.
An IDA electrode consists of a pair of electrode with numerous microarray bands interlocked (Barnes et al., 2012). Usually, each electrode band and the gap between then have the same width, making it symmetric. In electrochemical experiments using an IDA electrode, two electrode setups are often used by connecting the WE to one side and the CE/RE electrode to the other (Yan et al., 2011). In this configuration, the potential of the WE cannot be controlled easily and the CE/RE acts as a pseudo reference. This makes interpretation of CV data somehow more difficult than typical three-electrode setups.
However, if equal concentration of both a certain pair of redox species is added, there might be a consequence that the standard potential of both electrodes are the same (Weng
13
et al., 2019). This is a particularly obvious advantage for impedance biosensors: There is no need to further add a voltage bias between the two electrodes. One only need to apply an oscillating small voltage at 0V bias to obtain impedance data and he or she can be sure that both the electrode potentials shift to exactly the standard potential of the reaction of the redox species.
IDA electrodes have been widely used for impedimetric bio-detection. The gap width has shown to have a significant effect on the sensitivity of these kinds of impedimetric biosensors. The smaller the width, the larger the impedimetric response (Y.
Wang et al., 2012). Very low limit of detection have been also reported (Shoute et al., 2018). The concentration of the bio-analyte can shift the properties of the solution (e.g.
the solution resistance (Rs) or the dielectric capacitance (Cdi)). They can also be bound to the sensing element immobilized on the electrode, varying Rct or the double layer capacitance (Cdl) (Yan et al., 2011). They have also been integrated with different applications including microfluidic systems.
2.2.2 Issues in Low Frequency Domain
A problem of using IDA electrodes for impedimetric detection arises in the low frequency region. Due to its geometry, redox species finitely diffuse between two lateral electrode bands. The semi-infinite diffusion assumption used for common three-electrode systems is invalid and the Warburg element used for modeling of these systems would fail (Allen J. Bard et al., 1986; Niwa et al., 1990). Moreover, it is clear that a non-zero limiting current (or steady-state current) will exist in an IDA electrode system (Aoki et al., 1988). From the above reasons, it can be sure that as the frequency decreases, the imaginary part of impedance would also eventually approach zero. This would consequently result in a bending of impedance towards the real axis at low frequencies in a typical Nyquist plot (cf. section 3.1). Therefore, an element for calculating the diffusion impedance of IDA electrodes must be developed for modeling of such phenomenon. The appearance of this bending phenomenon at low frequencies can be found by simply performing EIS on a bare IDA electrode with both redox species present.
Unfortunately, there are barely any studies that directly confront this issue and propose an adequate or general solution. In order to find the exact value of diffusion impedance, 2D time-dependent partial differential equations are needed to be solved along with heterogeneous boundary conditions at the electrode surface (A.J. Bard and
15
Faulkner, 2000). This makes it almost impossible to find the exact solution. Even if the periodic-steady-state solution are to be derived, it could be expected that the function would become too complicated for practical implementation.
Several appearances resembling the finite diffusion phenomenon of IDA electrodes have occurred in previous published literatures. Lu et al. fabricated an IDA electrode olfactory biosensor for detecting interactions between odorant-binding proteins (OBPs) and different semiochemicals emitted from host plants (Lu et al., 2015). The impedance spectra of the bare electrode clearly exhibited the diffusion nature of an IDA electrode, which is, the decrease of phase angle at low frequencies (Figure 2-2e). However, when the electrode is immobilized, the Rct became large and dominated over diffusion effects.
In that way, the diffusion impedance could be neglected and it would make little difference whether or not to use a Warburg element. Chiriacò et al. developed a flow- injection impedimetric immunosensor using IDA electrodes for detection of cholera toxin (Chiriaco et al., 2011). Despite the large Rct, down bending of impedances in their Nyquist plots (Figure 2-2b) can merely be seen. Zhurauski et al. developed an affimer- functionalized IDA electrode-based biosensor for detection of Her4, a protein tumor biomarker (Zhurauski et al., 2018). Though no bending of impedance can be seen in the Nyquist plot of their blank electrode, the phase angle is obviously lower than the typical
45° of Warburg elements (Figure 2-2c). Different kinds of circuits other than the Randles circuit are also used for explanation of the phase angle depletion phenomenon of impedances. Ding et al. grew vertically aligned carbon nanotube array (VANTA) coated IDA electrodes for detection of human cancerous inhibitor PP2A (CIP2A) (Ding et al., 2018). Their equivalent circuit consists of a geometric capacitance induced constant phase element (CPE) and Rct in parallel, another CPE and R in parallel representing film and solution interface, and a Rs in series (Figure 2-2a). That interpretation for the film and solution interface is questioned because at low frequencies, the impedance for the CPE might become so large that the current only passes through R, making the CPE lose its effect. Another reason is that the shape of the imperfect semi-circle on the right of Fig. 4b and S2a in their work appears to be made up of something else caused by another phenomenon. Ohno et al. utilized IDA electrodes for immunosensing of human immunoglobulin A (IgA) (Ohno et al., 2013). They assumed that the organic layer formed on the IDA electrode can be divided into the interfacial and inner part. These two parts respectively result in one semi-circle composed of a parallel Rct and Cdl, and another imperfect semi-circle composed of a parallel CPE and constant resistance (Rα) (Figure 2-2d). Wang et al. developed an IDA electrode based immunosensor for detection of avian influenza virus H5N1 (R. Wang et al., 2009). Their Nyquist diagram clearly showed down
17
bending of impedances at low frequencies. For correction of the fitting error, they added another capacitor and resistor in parallel to the original model (Figure 2-2f).
Figure 2-2 Studies exhibiting IDA diffusion phenomenon. (a) (Ding et al., 2018) (b) (Chiriaco et al., 2011) (c) (Zhurauski et al., 2018) (d) (Ohno et al., 2013) (e) (Lu et al., 2015) (f) (R. Wang et al., 2009).
2.3 Equivalent Circuit Fitting for Symmetric Electrode Systems
Symmetric electrochemical systems implement a two electrode setup with the WE and CE/RE having the same material and are often used in energy‐storage systems (L.
Zhang et al., 2016). These systems are also used in impedimetric bio-sensing applications, where electrodes of different geometries such as IDA electrodes can be used. However, for equivalent circuit fitting of these systems with redox species present, two Randles circuit in series must be used for characterizing the system parameters because both electrodes are involved in reaction. This might cause overfitting of parameters and may slow down the fitting process. A way to solve this problem is to set equal parameter values between the two circuits, so that the number of parameters should equal to a single Randles circuit. Should the fitting results be effective if one used only a single Randles circuit in symmetric systems? Previous literatures on bio-detection using IDA electrodes have shown it is possible (Yan et al., 2011). However, a detailed derivation of why it can be done hasn’t yet been carried out. In Chapter 4, the relationship of Randles circuit parameters (e.g. Rct or Rs) between three and symmetric electrode setups is derived. Using this relationship, one is able to calculate parameters of symmetric setups by using a single Randles circuit.
19
2.4 Miniaturized Electrochemical Systems
Electrochemical methods may seem attractive, but when dealing with samples which are mostly liquid, one has to prepare bulky containers with large volumes of test buffers for the electrochemical setup. Moreover, over dilution of a sample into the bulk solution may result in a low detection signal, making accurate data acquisition hard to perform. Regarding point-of-care diagnostics, measurements using bulky systems such as a typical three electrode electrochemical setup are almost impossible to accomplish.
Portable and miniaturized sensing devices and methods must be developed in order to cater to the market and medical needs such as home applications or on-site measurements (da Silva et al., 2017; Vashist, 2017). Microfluidic systems also take up the role of achieving several features in a miniaturized system. Here the advantages of miniaturized electrochemical systems and problems that will be faced in practical implementation are discussed.
2.4.1 Implementation Issues of Two and Three Electrode Setups
A miniaturized electrochemical system manipulates small volumes of fluids in order to let them react, mix up, flow through, enter, leave or stay at a certain place in a formulated manner. The geometry is constrained to approximately sub-millimeter range, enabling it to deal with samples with little volume and environments where detection scales are crucial (Kirby, 2010). The development of these biosensors is a technology that exhibit low cost and integrable natures (Punter-Villagrasa et al., 2017; J. Wang, 2006).
They could also employ other features like microfluidic real-time detection (D. Zhang et al., 2016), multiplex (Pursey et al., 2017) and smart phone controlled applications (Jiang et al., 2014; Zhang et al., 2015). Asymmetric and symmetric two electrode setups are often embedded within these sensors.
While potent as it seems, a typical three electrode setup is hard to implement in a miniaturized system due to its complexity, design difficulties and low yield rate. The serious obstacles limit its ability for further miniaturization and integration developments in point-of-care applications. In microfabrication, a two electrode setup is more simple, easy to fabricate and can be made more robust. The configuration of the WE and the CE/RE can be categorized as asymmetric and symmetric. Asymmetric electrodes such as an Au WE and Pt CE/RE are simple in analysis but more complicated in fabrication (T.
21
Lim et al., 2017), while symmetric electrodes are of the opposite (Chiriaco et al., 2011).
Two electrode setups are more difficult to interpret compared with three electrode setups since the current flows through both the CE and RE, resulting in a voltage drop on the RE that may lead to serious inaccurate control of potential, thus the signal may rather be compositions of reactions of both the WE and CE/RE.
Figure 2-3 Issues in three electrode system miniaturization.
2.4.2 Miniaturized Impedimetric Detection Systems
EIS takes the advantage of two electrode miniaturized systems since only a small voltage amplitude would be applied (< 50mV), which results in little penetrating current that runs through the RE. Nevertheless, three electrode setups can also be applied. Three electrode setups are stable in potential control and only the WE is concerned for analysis, making it easier to interpret. However, the fabrication process usually faces obstacles since different materials are needed to be evaporated or coated onto the electrode surface.
Moreover, in order to arrange the different electrode materials using metal heat or electron-beam evaporation, alignment of photomasks must be accurate in order to obtain product parameter reproducibility, which would be quite a tough skill to master in microfabrication and requires precise machinery.
On the other hand, symmetric two electrode setups are a lot easier to fabricate and can be reproduced easily even with simple manually controlled aligners during microfabrication process, though potential control in these systems may shift and analysis of electrochemical data would most likely be the summation of the WE and CE/RE.
Microfluidic impedimetric two electrode setup studies have also been published in recent years with wide ranges of applications. There are three electrode setups though not as widely discussed as two electrode setups. Subjects using three electrode setups include
23
cell detection (Manczak et al., 2016), while others using two electrode setups also involve disease diagnosis (T. Lim et al., 2017), virus detection (Lum et al., 2015), microparticle sensing (Z. Zou et al., 2008) … etc.
Publications comparing recent studies using microfluidic or microelectrode impedimetric chips are systematically listed in Table 2-1. Parameters such as electrode geometry, independent variables, electrode material, location (in solution or on electrode) and detection of limit (LOD) are compared.
Table 2-1 Comparison of microfluidic and microelectrode impedimetric chip systems.
Electrode material (main / adhesive layer)
Independent variable or principle Location Electrode geometry LOD Reference
Au/Cu (0.15/35μm) concentration of Cry1Ab/aptamer immobilized on magnetic beads
in solution circular plate 15pM (Jin et al., 2017) Au/Ti (200/15 nm) bacteria concentration in solution interdigitated array 10cells/mL (Jiang et al., 2014)
Au/Ti (100/10 nm) NaCl concentration between electrodes in solution rod 0.1μM (Ashish et al., 2011)
Au/Ti/W (100/10/10 nm)
thrombin/aptamer concentration immobilized on
magnetic beads in solution interdigitated array 10pM (Y. Wang et al., 2014) Au/COC (100nm / NA) dielectrophoresis aroused microparticle entrapment around electrode interdigitated array NA (Z. Zou et al., 2008)
Au/Ti (150/5 nm) ssDNA base pairing on electrode interdigitated array NA (Nadja E Solis-Marcano, 2016)
Au/Ti (80/20 nm) DNA/miRNA Hybridization on electrode circular plate 1pM (Capaldo et al., 2016)
Au/COC (50nm / NA) concentration of IgG1/Protein A binding on electrode rectangular NA (Vandenryt et al., 2013) Au concentration of cholera toxin/antibody binding on electrode interdigitated array 10pM (Chiriaco et al., 2011) Au/Ti (100/10 nm) concentration of myoglobin/antibody binding on electrode board NA (Tweedie et al., 2006) Au/Cr (200/10 nm)
Au/COC (100nm / NA) concentration of IgG/antibody binding on electrode interdigitated array NA (Zhiwei Zou et al., 2007) Au/Cr (200/5 nm) concentration of IgE/antibody binding on electrode square 0.1nM (D. Xu et al., 2005) Au/Cr (80/20 nm) concentration of thrombin/aptamer binding on electrode interdigitated array NA This research Au/Cr (80/20 nm) concentration of MUC1/aptamer binding on electrode interdigitated array NA This research (Appendix)
2.5 Affinity-Based Detection using Aptasensors
Aptamers are artificially synthesized DNA or RNA that can be selected in vitro to obtain affinity and selectivity to its binding target such as proteins, ions, small molecules, cells or viruses and have emerged as an innovative interest of study in the past two decades (Keefe et al., 2010; Zhou and Rossi, 2016). In order for aptamers to specifically bind to a target analyte, a technique called systematic evolution of ligands by exponential enrichment (SELEX) can be implemented, which is a molecular biological method for the evolution of aptamers (Tuerk and Gold, 1990).
DNA aptamers are robust and stable due to its constructive nature compared with antibodies and can also serve as the recognition element in affinity-based biosensors (Hianik and Wang, 2009; Y. C. Lim et al., 2010). Impedimetric aptasensors are biosensors that use aptamers as the sensing element for detecting a specific analyte and use EIS for target measurement. Radi et al. took the lead of designing and developing a reusable impedimetric aptasensor that can detect thrombin (Radi et al., 2005). The thrombin binding aptamers are thiolated at 3’ end, which lets them form a self-assembled monolayer (SAM) on a smooth, clean Au electrode surface when being immobilized (Vericat et al., 2010), and Fe(CN)63-/4- is used as the redox species for EIS measurement.
The general process for thiolated aptamer immobilization on an Au electrode surface with 6-mercaptohexanol (MCH) as the blocking reagent and Fe(CN)63-/4- as the redox couple (species) is illustrated in Figure 2-4.
Figure 2-4 Typical process for aptamer immobilization on Au electrodes.
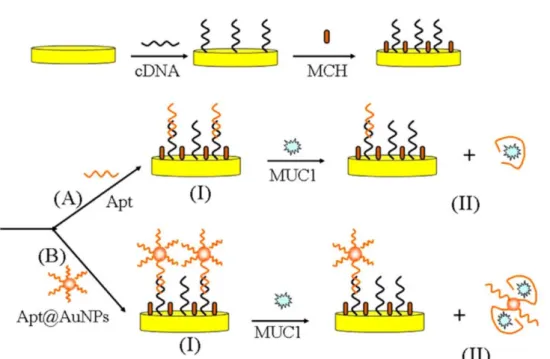
Liu et al. realized a sensitive impedimetric MUC1 aptasensor by immobilizing a partially complementary S2.2 aptamer sequence onto an Au electrode using thiol-gold interaction followed by partial base pairing of S2.2 sequences that are immobilized on gold nanoparticles (Figure 2-5). Different concentrations of MUC1 in the solution competed with the complementary S2.2 and broke apart the partial base pairing, resulting in a decreasing Rct value as the MUC1 concentration increases (Liu et al., 2015). There are also other label-free impedimetric aptasensors that are dedicated to pathogen detection (Brosel-Oliu et al., 2018; Reich et al., 2017), food safety (Malvano et al., 2017) and other
Figure 2-5 Schematic representation of the electrochemical aptasensor for the detection of MUC1 (Liu et al., 2015).
Chapter 3 Diffusion Impedance Modeling for IDA Electrodes
3.1 Brief Introduction
In the present study, an integral equation for approximating the diffusion impedance of an IDA electrode is proposed. To the best of the author’s knowledge, this is the first approach for derivation of its diffusion impedance regarding relevant parameters such as the electrode bandwidth (we) and gap width (wg). Conformal mapping methods for calculating the finite diffusion length of every point on the electrode and cylindrical finite diffusion approximations in a differential area are implemented. The solution is able to calculate IDA diffusion impedances of different geometries and frequencies, constructed into an element for equivalent circuit fitting, and even degenerated to obtain the limiting current. A command line program for calculating the IDA diffusion impedance is provided in supplementary material. This can help researchers model their IDA electrode system more accurately for a variety of applications.
To make a clearer view of the finite diffusion phenomenon using IDA electrodes, an experimental EIS data is demonstrated in Figure 3-1 (solid triangles). At high frequencies, an imperfect semi-circle can be seen. This is caused by faradaic charge transfer processes on non-uniform metal surfaces, which the surface roughness or other
factors can be accounted for (Lasia, 2002). Extensive studies have been researched in this area (Mulder et al., 1990; Orazem and Tribollet, 2011), which are beyond the scope of this work. Therefore, this work focuses on the phenomenon of diffusion at the low frequency area. (For the double layer capacitance, a constant phase element (CPE or Q) in place of a capacitor (C) is used. Qdl is a common element for equivalent circuit fitting when using a Randles circuit (Shoar Abouzari et al., 2009).) At low frequencies, a decrease of phase angle can be seen, making the impedance bend towards the real axis.
This is caused by finite diffusion of redox species between the electrodes. The whole spectrum is fitted using the Randles circuit with a Warburg element modeling the diffusion impedance (Figure 3-1 top-left subfigure), but failed to achieve a good enough result (Fig. S1 hollow triangles). Obviously, there are large errors between the real and fitted value of certain parameters such as the charge transfer resistance (Rct) or double layer capacitance (Qdl). The problem of erroneous fitting can be fixed if a frequency range where the diffusion effect doesn’t exist is arbitrarily selected. Also, if the Rct had been bigger, the significance of the diffusion impedance would be smaller and can eventually be neglected. However, neither can provide methods for parameterizing the diffusion nature within these systems. If a more general equivalent circuit element for replacing the Warburg element is needed to obtain accurate enough results, then a theory should be developed for calculating the diffusion impedance of an IDA electrode. There are three
unique parameters in a symmetric IDA electrode with a certain geometry: electrode bandwidth (we), gap width (wg) and length of electrode (l). All these are taken in account for the derivation of the theory.
Figure 3-1 Nyquist plot of EIS data of a bare Au IDA electrode (▲) and its fitted data (△). The electrode bandwidth (we) and gap width (wg) are 50μm. The equivalent circuit used is shown at the upper left corner, which is a Randles circuit that uses a constant phase element (CPE or Q) for modeling the double layer capacitance. The solution contains 0.1M KCl and 5mM Fe(CN)63-/4-. The frequency range of the data is 10-1~105Hz.
3.2 Theory
The goal of this theory is to derive a solution for approximating the diffusion impedance of an IDA electrode. The electrode is assumed to have a gap width of wg and a common bandwidth of we. In the first section of this theory, the unit cell is introduced for simplification of calculations. An imaginary constant concentration boundary inside the cell is deduced, and redox species can diffuse between this boundary and the electrode.
In the second section, the equations for calculating finite diffusion lengths of every point on the electrode is derived. In the third section, cylindrical finite diffusion approximations are performed within a differential area of the diffusion path. By combining these derivations, an integral form of solution is presented. One is able to calculate the diffusion impedance of an IDA electrode with arbitrarily defined we and wg at any frequency. In the fourth section, the solution is transformed into a dimensionless form, yielding two unique dimensionless parameters and another commonly known parameter. This form can be used in equivalent circuit fitting, which the parameters can be predicted from a single EIS experimental data. In the last section, a limiting case of the diffusion impedance with geometrical parameters is explored and the reduced impedance equation is deduced. For derivation of this theory, the following assumptions are made:
I. Edge effects, either at the horizontal or vertical edge of the IDA electrode, can be neglected.
II. Both redox species have the same diffusion coefficient D and bulk concentration C*. III. The pair of electrodes have a common bandwidth we and a total number of bands N.
IV. The concentration throughout has reached a periodic-steady-state, which can be expressed as a phasor C� (Lasia, 2002).
V. The solution above the electrode extends infinitely.
VI. The height of the electrode is sufficiently small and can be assumed as zero.
VII. Due to the small voltage amplitude applied, presence of supporting electrolyte and static measurements, migration and convection effects are neglected.
3.2.1 Unit Cell and Imaginary Constant Concentration Boundary (ICCB)
The unit cell is a well-known representation for calculation simplification of IDA electrode geometries (Aoki et al., 1988; Bhuiyan et al., 2015; Morita et al., 2014). In brief, it consists of two halves of a pair of electrode band and the above semi-infinite strip of
solution (Figure 3-2a). The cell width w has the relationship:
𝑤𝑤 = 𝑤𝑤𝑒𝑒+ 𝑤𝑤𝑔𝑔
By neglecting edge effects (assumption I), the relationship between the impedance of an IDA electrode and its corresponding unit cell is
(1)
𝑍𝑍𝑑𝑑𝑑𝑑𝑑𝑑𝑑𝑑−𝐼𝐼𝐼𝐼𝐼𝐼 =𝑍𝑍𝑢𝑢𝑢𝑢𝑑𝑑𝑢𝑢 𝑐𝑐𝑒𝑒𝑐𝑐𝑐𝑐
𝑁𝑁
, which is quite obvious because the whole electrode can be thought of geometrical repeats of N unit cells. For the convenience of the following derivations, the unit cell is put onto a complex plane (z-plane), where the left boundary is on Re(z) = 0 and the right boundary is on Re(z) = w. The reaction is identical at every point along any axis perpendicular to this plane.
Figure 3-2 (a) Geometric definition of a unit cell (red translucent region). (b) Open finite- length diffusion elements link between the ICCB and the electrode surface within the left half of a unit cell.
(2)
If one considers the possibility of applying any equivalent circuit element on an IDA electrode, there exists a problem that no clear boundary condition from which a certain redox concentration can be defined. However, if a small perturbing voltage is applied between the two electrodes of a symmetric IDA electrode, the potential should be equally distributed among the two electrodes (Chen and Ho, 2001). Moreover, by assumption II, the oxidization rate at a certain point on one electrode should equal the
reduction rate of the other electrode at the point symmetrical about the line Re(z) = w/2.
This leads to the result of the concentration change of oxidized species (ΔCO = CO – C*) and reduced species (ΔCR = CR – C*) being symmetrical about Re(z) = w/2 everywhere at
any time. Also, the increase of oxidized species should equal the decrease of reduced species at any point on the electrode. Therefore, due to geometrical symmetry, it can be
conceived that at any point z within the unit cell,
Δ𝐶𝐶𝑂𝑂(𝑧𝑧) = Δ𝐶𝐶𝑅𝑅(𝑤𝑤 − 𝑧𝑧) = −Δ𝐶𝐶𝑅𝑅(𝑧𝑧) Substituting the definition of ΔCO and ΔCR, one can obtain
𝐶𝐶𝑂𝑂(𝑧𝑧) + 𝐶𝐶𝑂𝑂(𝑤𝑤 − 𝑧𝑧) = 2𝐶𝐶∗ and 𝐶𝐶𝑅𝑅(𝑧𝑧) + 𝐶𝐶𝑅𝑅(𝑤𝑤 − 𝑧𝑧) = 2𝐶𝐶∗
According to eqn. (4), it can be derived that CO = CR = C* at Re(z) = w/2. This can be thought of as a fixed concentration boundary condition for diffusion impedance calculation of the unit cell, and is named the imaginary constant concentration boundary
(3)
(4)