行政院國家科學委員會專題研究計畫 成果報告
病態性肥胖者接受不同減重方式與程度對肥胖相關細胞激
素及代謝症候群變化的影響
計畫類別: 個別型計畫 計畫編號: NSC94-2314-B-006-119- 執行期間: 94 年 08 月 01 日至 95 年 07 月 31 日 執行單位: 國立成功大學醫學系家庭醫學科 計畫主持人: 吳至行 共同主持人: 張秦松,馬瀰嘉,吳晉祥 計畫參與人員: 張尹凡,黃文蔚,陳全裕 報告類型: 精簡報告 處理方式: 本計畫可公開查詢中 華 民 國 95 年 10 月 31 日
研究計畫報告 (
NSC 94-2314-B-006 –119) (一) 計畫報告中文摘要。(五百字以內) 關鍵詞:病態性肥胖、新陳代謝症候群、減重、脂肪細胞激素 眾所皆知,肥胖已是臺灣地區重要的公共衛生問題。病態性肥胖會大幅增加許多慢性 病的罹病率,如糖尿病、高血壓、心血管疾病及某些癌症,尤其是與胰島素阻抗及血脂異 常相關的腹部肥胖,更是心血管疾病及第二型糖尿病的重要危險因子。2001 年美國國家膽 固醇教育計畫(NECP)的 ATPⅢ(the Adult Treatment Panel Ⅲ)定義出代謝症候群(Metabolic syndrome)。若將腰圍的標準降低至男性>90 公分,女性>80 公分,則亞洲人的代謝症候 群的盛行率則和西方族群相符。研究也顯示肥胖,尤其是病態性肥胖,更是代謝症候群的 主要危險因子之一,而減重是第一線治療。 體重控制之相關門診雖已普遍存在,其介入方式卻五花八門,莫衷一是。約有30%的 減重民眾會採用藥物來進行減重。目前國內合法可以長期使用的減重藥物為羅氏鮮與諾美 婷兩種藥物。經長期使用六個月以上,兩種藥物均能減輕病患10%以上的體重,並能顯著 改善各項代謝指標。90 年代研究發現經改良式的極低熱量飲食(通常為每日 400~800 千卡) 治療後的減重成果平均在3~4 個月治療後,女性可下降 18~22 公斤,男性可下降 22~27 公 斤,亦即約減少最初體重的20 至 25﹪。除了體重減輕以外,VLCD 更能有效降低血漿總 膽固醇與三酸甘油脂、改善血糖耐受性及第二型糖尿病患者的血糖值。對於身體組成及基 礎代謝率也有正面的影響。然而在台灣卻因顧忌傳統VLCD 的副作用而鮮少有醫師採用現 代的改良式的極低熱量飲食來治療肥胖,尤其是病態性肥胖者(BMI> 35 kg/m2),殊為可惜。 脂肪組織不僅只是擔任儲存能量的角色,還會分泌很多種荷爾蒙,稱做脂肪細胞激素 (adipocytokines)
。其中尤以Adiponectin、leptin 最常被提及研究。除此之外,許多與腦部 食慾變化及飲食中樞相關的荷爾蒙如Ghrelins、Neuropeptide Y、PYY3-36皆可能與肥胖的形 成及減重時的變化有關。例如Ghrelin
是一種消化道分泌的荷爾蒙,主要由胃分泌,會增 加食慾。注射PYY3-36則會抑制食慾。肥胖造成adiponectin
的降低會在減肥後回升,並伴 隨血壓、血糖或血脂的改善。 本研究共收集減重特別門診的113 位肥胖個案,其中 BMI 超過 35 以上的病態性肥胖 者有50 位。個案接受低熱量飲食、極低熱量飲食以及藥物(羅氏鮮或諾美婷)為主等不同方 式與減重速度之正式減重24 週後,平均體重減輕 10.6 公斤(11.9%)。各項生化指標與生活 品質指標(SF36)均有顯著改善,肥胖相關激素(脂締素上升、瘦素下降、C 反應蛋白下降) 均有改善,代謝症候群比例也降低。同時這種改善以減輕初始的減重≧10% 以上時最為顯 著。(二) 計畫報告英文摘要。(五百字以內)
Key words: Morbid obesity, Metabolic syndrome, Weight reduction, Adipocytokins
It is well-known that obesity is the important public health problem in Taiwan.
Morbid obesity (defined as BMI > 35 kg/M
2for Asians) will result in many kinds of
cardiovascular diseases, such as diabetes, hypertension, coronary heart disease and even
cancers. Abdominal obesity is the main risk factor for the above comorbidities, especially.
In 2001, the NCEP ATP III defined the so-called metabolic syndrome (MetS). In Asian, the
prevalence of the MetS would be as high as the Caucasians if the waist circumference
cutoff be lowered to 90 cm for men and 80 cm for women. However, the weight reduction
is the mainstream method for the obesity, especially for the morbid obesity.
Several methods have been proposed for weight reduction. In Taiwan, there were
nearly 30% of the dieting people had used anti-obesity drugs. Up to now, orlistat and
sibutramine is the only two legal drugs in Taiwan. Both drugs could provide over 10%
weight reduction in average for a 6-months program. The new VLCD regimen (400-800
Kcal/day) could promise a 20-25% weight reduction in 3-4 months program, along with
the improvements of cholesterol, triglyceride, glucose intolerance and blood glucose level
of the diabetics. However, none or few physicians had provided this method for obese,
especially morbid obese subjects, in Taiwan.
Adipose tissue is not only for the energy storage but also the adipocytokins producers.
The adiponectin and leptin are studied mostly. Several satiety-related peptides such as
ghrelin, neuropeptide Y and PYY
3-36have all been mentioned in the pathogenesis of
obesity and the changes of weight reduction. For instance, the ghrelin was secreted from
stomach which may increase the eating behavior, but PYY
3-36might decrease the appetitie.
Adiponectin was reduced in obese individuals but increased after weight reduction.
In this study, a total of 113 obese subjects, included 50 morbid obesity, were collated.
Subjects will receive one of the four kinds of weight reduction methods (low calorie diet,
xenical, reductil and VLCD) for a standardized program. After 24 wks of intervention, the
mean weight change is 10.6kg (11.9%). The metabolic parameters, metabolic syndrome
and life quality ( SF36) are significantly improved. The obesity-related cytokins are also
improved ( increased adiponectin, decreased CRP and leptin). The improvement of MetS
and adipocytokins will be more significant when the weight loss ≧10%.
(三)研究方法、進行步驟及執行進度。請分年列述:1.本計畫採用之研究方法與原因。 2.預計可能遭遇之困難及解決途徑。3.重要儀器之配合使用情形。4.如為整合型研究 計畫,請就以上各點分別說明與其他子計畫之相關性。5.如為須赴國外或大陸地區 研究,請詳述其必要性以及預期成果等。 A.研究對象: 本研究對象募集113 位具有強烈減重動機之自願病態性肥胖者,其身體質量指 數為25 kg/m2以上,有/無合併慢性疾病如高血壓,糖尿病等。年齡介於 20 至 64 歲 之男女性為收案對象。其中有50 位其身體質量指數為 35 kg/m2以上。依據立意取樣 與整塊隨機分派(Blocked randomization)方式將個案分為以下各組配合不同減重模式 進行減重計劃。所有個案均需同意並簽署同意書,並經本院人體試驗委員會同意通 過。 1. 極低熱量飲食組+規律運動/低衝擊有氧運動:33 位 2. 羅氏鮮藥物組+規律運動/低衝擊有氧運動: 41 位 3. 諾美婷藥物組+規律運動/低衝擊有氧運動: 27 位 4. 低熱量飲食組+規律運動/低衝擊有氧運動: 18 位 B.研究方法: 所有研究對象均將接受完整六個月的減重計劃指導,並於減重前(v1),減重中(v6, 約為開始減重時間滿3個月時)及六個月減重後(v9)進行各項評估測量。 一、 基本減重模式 (低熱量飲食): 基本減重治療模式共計為期28週,10次回診。基 本回診間隔週次依序為0,1,2,4,8,12,16,20,24,28週,但會依據個人情形略為調整 於7日前後回診為可接受範圍。首次求診日視為第0週次並進行減重動機評估, 包括個別動機會談及問卷填寫。若病患於第1週次回診時仍呈現積極的減重動機 時則正式收案,自第二週起正式減重治療並持續追蹤治療六個月。每位病患於 每次回診時均須接受20~30分鐘之低熱量飲食指導建議(每日減少基本熱量500 大卡為原則)與自我監測每日飲食行為紀錄評估,營養師並定期以電話追蹤病患 的飲食情形。
二、 極低熱量飲食模式﹔採用OptifastTM(Norvatis, 450kcal/day)進行。本產品為粉末
狀包裝,每日分為三包服用(一天三包,每包150千卡)。肥胖患者先進行兩週之 低熱量飲食(<1200 kcal/day),然後持續12週之極低熱量飲食,之後改為低熱量 飲食(每日1200kcal)並維持三個月。回診方式如基本減重模式。
形 給 予 羅 氏 鮮(xenical® 每日三餐各一顆,每顆劑量為120 毫克 )或諾美婷 (reductil®每日一顆,每顆劑量為10毫克,並依據病患反映可逐步調整至15毫克) 。同時以服用藥物紀錄及pill-counting法來評估病患的服藥遵醫囑性和可能的副 作用。 四、 體適能介入規劃﹔安排低衝擊有氧課程(對於病態肥胖的病友,初期以鼓勵進行 快走運動為主,以逐漸增加至每日達15,000步並能順利負荷為考慮開始有氧運 動原則。),基礎課程是依據教育部規範之體適能333原則進行。即每週三次、 每次五十分鐘以上及每分鐘心跳平均達130下左右(約為最大心跳數的60-80%) 。對於規律運動組總計將維持六個月之體適能介入輔助治療,非運動組則為一 般性指導。每位病患均紀錄每日活動日記並於回診時交回討論。 五、 身體組成的評估方法:將採用DXA方式評估
● 雙能量X光吸收分析儀:採用Lunar DPXLTM機型(Lunar radiation Corp, USA.
Version 1.3z)。可測量出身體脂肪含量(fat mass),非脂肪組織(lean mass)及骨 質含量(bone mass)與骨質密度。惟目前國際公認最標準的3-compartment身體 組成測量法。同時利用centrality index[34]可以評估腹部肥胖的變化。
六、 基礎代謝率的評估方法:過去的研究會採用Harris-Benedict Equation來評估。然而
本研究將採用可攜式間接性基礎代謝測定儀-MediGemTM (HealthTech Inc.,
Golden, CO) 。經由測定VO2值以及設定固定呼吸商(RQ)值為0.85的情形下,可
以準確算出基礎代謝率值。MediGemTM之internal consistency (Cronback α)高達
0.95,與indirect calorimetry所測出之REE值之相關係數為0.76 (P<0.0001),因此 能符合迅速正確評估國人基礎代謝率所需[35]。
七、 每日活動量紀錄方法:採用問卷方式
● 問卷設計:以中文化問卷評估整體活動量(total physical activity),其中包含
MET-hr/wk表示。此問卷已在國外及我們的多種研究中驗證其有效度[36-38] 。 八、 肥胖相關細胞激素及新陳代謝症候群指標: 每位個案於第1週收案時及第28週回診時均測量身高、體重、身體質量指數( BMI)、腰圍及血壓,並接受抽血檢查。身高及體重均在個案赤足輕裝且空腹 用標準器材測量,BMI由體重(公斤)除以身高(公尺)的平方求得。腰圍以 簡易皮尺測量兩側肋骨下緣及前上腸骨脊間之中點水平線周距。血壓在個案端 坐休息至少五分鐘後,以DINAMAP( PRO 100)血壓計配合適當大小的脈壓帶 ,由同一位研究助理執行三次血壓的測量,記錄三次血壓的中間值。每位個案 經隔夜空腹至少十小時以上,靜脈抽血檢查空腹血漿血糖、空腹胰島素、總膽 固醇、高密度脂蛋白膽固醇(HDL-C)、低密度脂蛋白膽固醇(LDL-C)及三 酸甘油脂(TG)等項目。利用Hitachi-747 型全自動生化儀器分析血中生化值 ,並利用IMMULITE®免疫儀器分析量測血中胰島素濃度。同時留取適量血清
來檢測肥胖相關細胞激素leptin, adiponectin(Linco Company, RIA Kits)。代謝症候群的
項目是參考2001年美國國家膽固醇教育計畫(NCEP)的ATPⅢ,包括血壓、空腹 血糖、腰圍、HDL-C及TG,其中腰圍採用亞太標準的男性>90公分,女性> 80公分,而有接受藥物治療的高血壓個案即符合血壓的標準,五項中符合三項 以上(含三項)就屬有代謝症候群。胰島素阻抗採用Matthews et al.的HOMA1 model,公式為 HOMA1-IR=(FPI×FPG)/22.5 (FPI: fasting plasma insulin (mU/l)
, FPG: fasting plasma glucose (mmol/l) ),此HOMA1 model已被廣泛使用於臨
床及流行病學的研究,具方便性且與其他測量胰島素阻抗的公式結果相近[39] 。
結果
減重後的體重變化百分比群分布圖
<5
[5-10] [10-15][15-20][20-25] >25
0
5
10
15
20
25
30
35
weight loss (%)
pat
ient
num
ber
(
%
)
<5
[5-10] [10-15][15-20][20-25] >25
0
5
10
15
20
25
30
35
weight loss (%)
pat
ient
num
ber
(
%
)
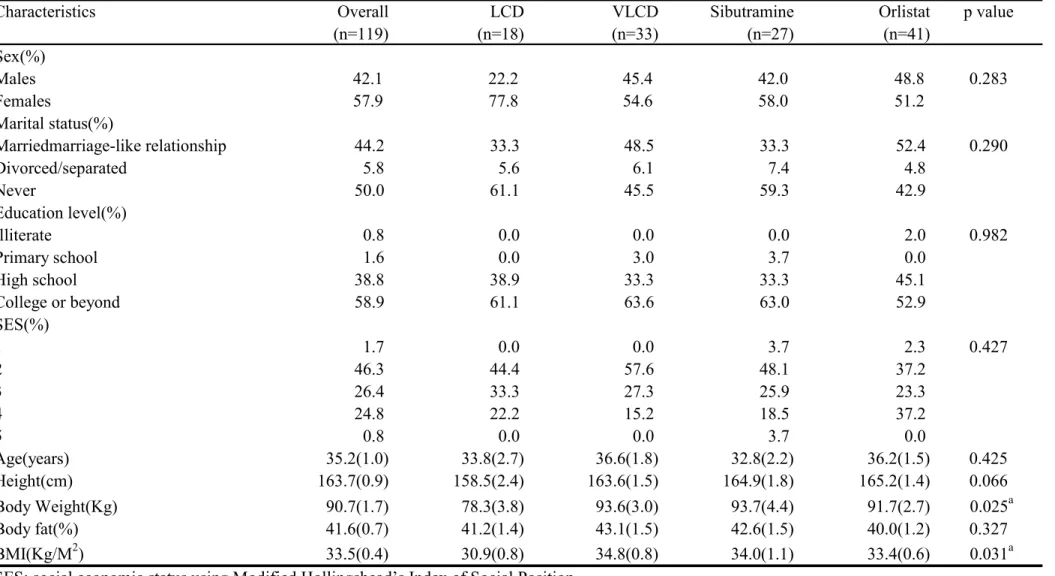
Table 1. Characteristics of the paticipants
Characteristics Overall LCD VLCD Sibutramine Orlistat p value
(n=119) (n=18) (n=33) (n=27) (n=41) Sex(%) Males 42.1 22.2 45.4 42.0 48.8 0.283 Females 57.9 77.8 54.6 58.0 51.2 Marital status(%) Marriedmarriage-like relationship 44.2 33.3 48.5 33.3 52.4 0.290 Divorced/separated 5.8 5.6 6.1 7.4 4.8 Never 50.0 61.1 45.5 59.3 42.9 Education level(%) Illiterate 0.8 0.0 0.0 0.0 2.0 0.982 Primary school 1.6 0.0 3.0 3.7 0.0 High school 38.8 38.9 33.3 33.3 45.1 College or beyond 58.9 61.1 63.6 63.0 52.9 SES(%) 1 1.7 0.0 0.0 3.7 2.3 0.427 2 46.3 44.4 57.6 48.1 37.2 3 26.4 33.3 27.3 25.9 23.3 4 24.8 22.2 15.2 18.5 37.2 5 0.8 0.0 0.0 3.7 0.0 Age(years) 35.2(1.0) 33.8(2.7) 36.6(1.8) 32.8(2.2) 36.2(1.5) 0.425 Height(cm) 163.7(0.9) 158.5(2.4) 163.6(1.5) 164.9(1.8) 165.2(1.4) 0.066 Body Weight(Kg) 90.7(1.7) 78.3(3.8) 93.6(3.0) 93.7(4.4) 91.7(2.7) 0.025a Body fat(%) 41.6(0.7) 41.2(1.4) 43.1(1.5) 42.6(1.5) 40.0(1.2) 0.327 BMI(Kg/M2) 33.5(0.4) 30.9(0.8) 34.8(0.8) 34.0(1.1) 33.4(0.6) 0.031a
SES: social economic status using Modified Hollingshead’s Index of Social Position LCD: low caloric diet
VLCD: very low caloric diet
ap < 0.05
p value for t -test for comparing continuous variable and for χ2 comparing the categorical variables.
PF RP BP GH VT SF RE MH PCS MCS BW(Kg) BMI BF(%) 0 25 50 75 100
initial visit 6th month
th e di ff e re nc e of m e as ur es ** ** ** ** ** ** ** ** ** * * *
Figue 1. The comparison of the body weight, BMI,
body fat and SF-36 scores
PF RP BP GH VT SF RE MH PCS MCS BW(Kg) BMI BF(%) 0 25 50 75 100
initial visit 6th month
th e di ff e re nc e of m e as ur es ** ** ** ** ** ** ** ** ** * * *
Figue 1. The comparison of the body weight, BMI,
body fat and SF-36 scores
** ** ** ** ** ** ** ** ** * * *
Figue 1. The comparison of the body weight, BMI,
body fat and SF-36 scores
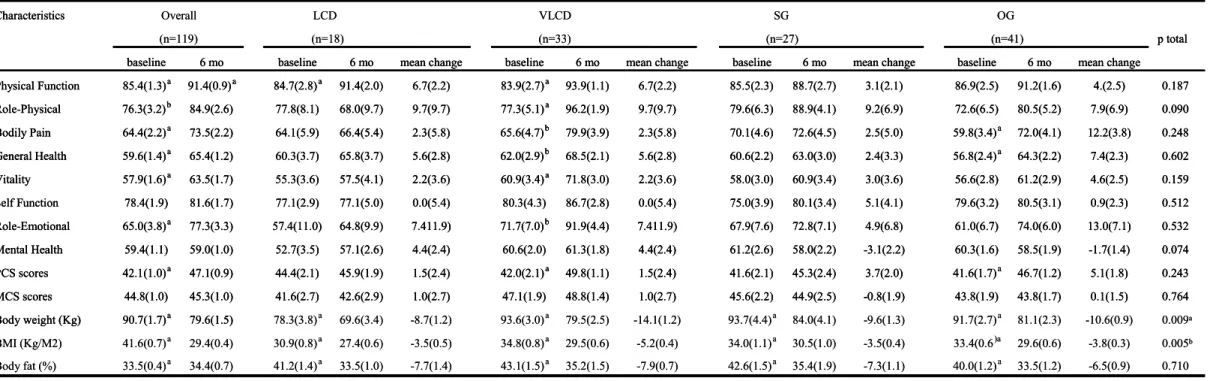
Table 2. The SF-36 scores, body weight, BMI ,body fat and chenges of different treatments at baseline and 6th month Characteristics
p total baseline 6 mo baseline 6 mo mean change baseline 6 mo mean change baseline 6 mo mean change baseline 6 mo mean change Physical Function 85.4(1.3)a 91.4(0.9)a 84.7(2.8)a 91.4(2.0) 6.7(2.2) 83.9(2.7)a 93.9(1.1) 6.7(2.2) 85.5(2.3) 88.7(2.7) 3.1(2.1) 86.9(2.5) 91.2(1.6) 4.(2.5) 0.187 Role-Physical 76.3(3.2)b 84.9(2.6) 77.8(8.1) 68.0(9.7) 9.7(9.7) 77.3(5.1)a 96.2(1.9) 9.7(9.7) 79.6(6.3) 88.9(4.1) 9.2(6.9) 72.6(6.5) 80.5(5.2) 7.9(6.9) 0.090 Bodily Pain 64.4(2.2)a 73.5(2.2) 64.1(5.9) 66.4(5.4) 2.3(5.8) 65.6(4.7)b 79.9(3.9) 2.3(5.8) 70.1(4.6) 72.6(4.5) 2.5(5.0) 59.8(3.4)a 72.0(4.1) 12.2(3.8) 0.248 General Health 59.6(1.4)a 65.4(1.2) 60.3(3.7) 65.8(3.7) 5.6(2.8) 62.0(2.9)b 68.5(2.1) 5.6(2.8) 60.6(2.2) 63.0(3.0) 2.4(3.3) 56.8(2.4)a 64.3(2.2) 7.4(2.3) 0.602 Vitality 57.9(1.6)a 63.5(1.7) 55.3(3.6) 57.5(4.1) 2.2(3.6) 60.9(3.4)a 71.8(3.0) 2.2(3.6) 58.0(3.0) 60.9(3.4) 3.0(3.6) 56.6(2.8) 61.2(2.9) 4.6(2.5) 0.159 Self Function 78.4(1.9) 81.6(1.7) 77.1(2.9) 77.1(5.0) 0.0(5.4) 80.3(4.3) 86.7(2.8) 0.0(5.4) 75.0(3.9) 80.1(3.4) 5.1(4.1) 79.6(3.2) 80.5(3.1) 0.9(2.3) 0.512 Role-Emotional 65.0(3.8)a 77.3(3.3) 57.4(11.0) 64.8(9.9) 7.411.9) 71.7(7.0)b 91.9(4.4) 7.411.9) 67.9(7.6) 72.8(7.1) 4.9(6.8) 61.0(6.7) 74.0(6.0) 13.0(7.1) 0.532 Mental Health 59.4(1.1) 59.0(1.0) 52.7(3.5) 57.1(2.6) 4.4(2.4) 60.6(2.0) 61.3(1.8) 4.4(2.4) 61.2(2.6) 58.0(2.2) -3.1(2.2) 60.3(1.6) 58.5(1.9) -1.7(1.4) 0.074 PCS scores 42.1(1.0)a 47.1(0.9) 44.4(2.1) 45.9(1.9) 1.5(2.4) 42.0(2.1)a 49.8(1.1) 1.5(2.4) 41.6(2.1) 45.3(2.4) 3.7(2.0) 41.6(1.7)a 46.7(1.2) 5.1(1.8) 0.243 MCS scores 44.8(1.0) 45.3(1.0) 41.6(2.7) 42.6(2.9) 1.0(2.7) 47.1(1.9) 48.8(1.4) 1.0(2.7) 45.6(2.2) 44.9(2.5) -0.8(1.9) 43.8(1.9) 43.8(1.7) 0.1(1.5) 0.764 Body weight (Kg) 90.7(1.7)a 79.6(1.5) 78.3(3.8)a 69.6(3.4) -8.7(1.2) 93.6(3.0)a 79.5(2.5) -14.1(1.2) 93.7(4.4)a 84.0(4.1) -9.6(1.3) 91.7(2.7)a 81.1(2.3) -10.6(0.9) 0.009a BMI (Kg/M2) 41.6(0.7)a 29.4(0.4) 30.9(0.8)a 27.4(0.6) -3.5(0.5) 34.8(0.8)a 29.5(0.6) -5.2(0.4) 34.0(1.1)a 30.5(1.0) -3.5(0.4) 33.4(0.6)a 29.6(0.6) -3.8(0.3) 0.005b Body fat (%) 33.5(0.4)a 34.4(0.7) 41.2(1.4)a 33.5(1.0) -7.7(1.4) 43.1(1.5)a 35.2(1.5) -7.9(0.7) 42.6(1.5)a 35.4(1.9) -7.3(1.1) 40.0(1.2)a 33.5(1.2) -6.5(0.9) 0.710 The values are mean(s.e.m).
LCD: Low caloric diet group; VLCD: very low caloric diet group; SG: sibutramine hydrochloride group; OG: orlistat group paired t-test: to compare the means difference between the baseline and the end-point in each group.
ANOVA test: to compare the means difference among groups.
ap < 0.01; bp < 0.05; p total value is comparisons among groups.
(n=41)
SG OG
Overall LCD VLCD
(n=27) (n=119) (n=18) (n=33)
Table 2. The SF-36 scores, body weight, BMI ,body fat and chenges of different treatments at baseline and 6th month Characteristics
p total baseline 6 mo baseline 6 mo mean change baseline 6 mo mean change baseline 6 mo mean change baseline 6 mo mean change Physical Function 85.4(1.3)a 91.4(0.9)a 84.7(2.8)a 91.4(2.0) 6.7(2.2) 83.9(2.7)a 93.9(1.1) 6.7(2.2) 85.5(2.3) 88.7(2.7) 3.1(2.1) 86.9(2.5) 91.2(1.6) 4.(2.5) 0.187 Role-Physical 76.3(3.2)b 84.9(2.6) 77.8(8.1) 68.0(9.7) 9.7(9.7) 77.3(5.1)a 96.2(1.9) 9.7(9.7) 79.6(6.3) 88.9(4.1) 9.2(6.9) 72.6(6.5) 80.5(5.2) 7.9(6.9) 0.090 Bodily Pain 64.4(2.2)a 73.5(2.2) 64.1(5.9) 66.4(5.4) 2.3(5.8) 65.6(4.7)b 79.9(3.9) 2.3(5.8) 70.1(4.6) 72.6(4.5) 2.5(5.0) 59.8(3.4)a 72.0(4.1) 12.2(3.8) 0.248 General Health 59.6(1.4)a 65.4(1.2) 60.3(3.7) 65.8(3.7) 5.6(2.8) 62.0(2.9)b 68.5(2.1) 5.6(2.8) 60.6(2.2) 63.0(3.0) 2.4(3.3) 56.8(2.4)a 64.3(2.2) 7.4(2.3) 0.602 Vitality 57.9(1.6)a 63.5(1.7) 55.3(3.6) 57.5(4.1) 2.2(3.6) 60.9(3.4)a 71.8(3.0) 2.2(3.6) 58.0(3.0) 60.9(3.4) 3.0(3.6) 56.6(2.8) 61.2(2.9) 4.6(2.5) 0.159 Self Function 78.4(1.9) 81.6(1.7) 77.1(2.9) 77.1(5.0) 0.0(5.4) 80.3(4.3) 86.7(2.8) 0.0(5.4) 75.0(3.9) 80.1(3.4) 5.1(4.1) 79.6(3.2) 80.5(3.1) 0.9(2.3) 0.512 Role-Emotional 65.0(3.8)a 77.3(3.3) 57.4(11.0) 64.8(9.9) 7.411.9) 71.7(7.0)b 91.9(4.4) 7.411.9) 67.9(7.6) 72.8(7.1) 4.9(6.8) 61.0(6.7) 74.0(6.0) 13.0(7.1) 0.532 Mental Health 59.4(1.1) 59.0(1.0) 52.7(3.5) 57.1(2.6) 4.4(2.4) 60.6(2.0) 61.3(1.8) 4.4(2.4) 61.2(2.6) 58.0(2.2) -3.1(2.2) 60.3(1.6) 58.5(1.9) -1.7(1.4) 0.074 PCS scores 42.1(1.0)a 47.1(0.9) 44.4(2.1) 45.9(1.9) 1.5(2.4) 42.0(2.1)a 49.8(1.1) 1.5(2.4) 41.6(2.1) 45.3(2.4) 3.7(2.0) 41.6(1.7)a 46.7(1.2) 5.1(1.8) 0.243 MCS scores 44.8(1.0) 45.3(1.0) 41.6(2.7) 42.6(2.9) 1.0(2.7) 47.1(1.9) 48.8(1.4) 1.0(2.7) 45.6(2.2) 44.9(2.5) -0.8(1.9) 43.8(1.9) 43.8(1.7) 0.1(1.5) 0.764 Body weight (Kg) 90.7(1.7)a 79.6(1.5)
Table 2. The SF-36 scores, body weight, BMI ,body fat and chenges of different treatments at baseline and 6th month Characteristics
p total baseline 6 mo baseline 6 mo mean change baseline 6 mo mean change baseline 6 mo mean change baseline 6 mo mean change Physical Function 85.4(1.3)a 91.4(0.9)a 84.7(2.8)a 91.4(2.0) 6.7(2.2) 83.9(2.7)a 93.9(1.1) 6.7(2.2) 85.5(2.3) 88.7(2.7) 3.1(2.1) 86.9(2.5) 91.2(1.6) 4.(2.5) 0.187 Role-Physical 76.3(3.2)b 84.9(2.6) 77.8(8.1) 68.0(9.7) 9.7(9.7) 77.3(5.1)a 96.2(1.9) 9.7(9.7) 79.6(6.3) 88.9(4.1) 9.2(6.9) 72.6(6.5) 80.5(5.2) 7.9(6.9) 0.090 Bodily Pain 64.4(2.2)a 73.5(2.2) 64.1(5.9) 66.4(5.4) 2.3(5.8) 65.6(4.7)b 79.9(3.9) 2.3(5.8) 70.1(4.6) 72.6(4.5) 2.5(5.0) 59.8(3.4)a 72.0(4.1) 12.2(3.8) 0.248 General Health 59.6(1.4)a 65.4(1.2) 60.3(3.7) 65.8(3.7) 5.6(2.8) 62.0(2.9)b 68.5(2.1) 5.6(2.8) 60.6(2.2) 63.0(3.0) 2.4(3.3) 56.8(2.4)a 64.3(2.2) 7.4(2.3) 0.602 Vitality 57.9(1.6)a 63.5(1.7) 55.3(3.6) 57.5(4.1) 2.2(3.6) 60.9(3.4)a 71.8(3.0) 2.2(3.6) 58.0(3.0) 60.9(3.4) 3.0(3.6) 56.6(2.8) 61.2(2.9) 4.6(2.5) 0.159 Self Function 78.4(1.9) 81.6(1.7) 77.1(2.9) 77.1(5.0) 0.0(5.4) 80.3(4.3) 86.7(2.8) 0.0(5.4) 75.0(3.9) 80.1(3.4) 5.1(4.1) 79.6(3.2) 80.5(3.1) 0.9(2.3) 0.512 Role-Emotional 65.0(3.8)a 77.3(3.3) 57.4(11.0) 64.8(9.9) 7.411.9) 71.7(7.0)b 91.9(4.4) 7.411.9) 67.9(7.6) 72.8(7.1) 4.9(6.8) 61.0(6.7) 74.0(6.0) 13.0(7.1) 0.532 Mental Health 59.4(1.1) 59.0(1.0) 52.7(3.5) 57.1(2.6) 4.4(2.4) 60.6(2.0) 61.3(1.8) 4.4(2.4) 61.2(2.6) 58.0(2.2) -3.1(2.2) 60.3(1.6) 58.5(1.9) -1.7(1.4) 0.074 PCS scores 42.1(1.0)a 47.1(0.9) 44.4(2.1) 45.9(1.9) 1.5(2.4) 42.0(2.1)a 49.8(1.1) 1.5(2.4) 41.6(2.1) 45.3(2.4) 3.7(2.0) 41.6(1.7)a 46.7(1.2) 5.1(1.8) 0.243 MCS scores 44.8(1.0) 45.3(1.0) 41.6(2.7) 42.6(2.9) 1.0(2.7) 47.1(1.9) 48.8(1.4) 1.0(2.7) 45.6(2.2) 44.9(2.5) -0.8(1.9) 43.8(1.9) 43.8(1.7) 0.1(1.5) 0.764 Body weight (Kg) 90.7(1.7)a 79.6(1.5) 78.3(3.8)a 69.6(3.4) -8.7(1.2) 93.6(3.0)a 79.5(2.5) -14.1(1.2) 93.7(4.4)a 84.0(4.1) -9.6(1.3) 91.7(2.7)a 81.1(2.3) -10.6(0.9) 0.009a BMI (Kg/M2) 41.6(0.7)a 29.4(0.4) 30.9(0.8)a 27.4(0.6) -3.5(0.5) 34.8(0.8)a 29.5(0.6) -5.2(0.4) 34.0(1.1)a 30.5(1.0) -3.5(0.4) 33.4(0.6)a 29.6(0.6) -3.8(0.3) 0.005b Body fat (%) 33.5(0.4)a 34.4(0.7) 41.2(1.4)a 33.5(1.0) -7.7(1.4) 43.1(1.5)a 35.2(1.5) -7.9(0.7) 42.6(1.5)a 35.4(1.9) -7.3(1.1) 40.0(1.2)a 33.5(1.2) -6.5(0.9) 0.710 The values are mean(s.e.m).
LCD: Low caloric diet group; VLCD: very low caloric diet group; SG: sibutramine hydrochloride group; OG: orlistat group paired t-test: to compare the means difference between the baseline and the end-point in each group.
ANOVA test: to compare the means difference among groups.
ap < 0.01; bp < 0.05; p total value is comparisons among groups.
(n=41)
SG OG
Overall LCD VLCD
(n=27) (n=119) (n=18) (n=33)
比較肥胖者於藥物減重前及經 24 週完整減重後身體組成及代謝症候群因子的變化(平均值±標準 差) 減重前 減重後 38.9±12.8 38.9±12.8 年齡(歲) 規則運動(有/無) 38/25 38/25 體重(公斤) 87.0±16.4 77.2±14.6*** 身體質量指數(公斤/公尺2) 32.7±5.0 29.0±4.8 *** 腰圍(公分) 100.1±12.2 90.6±11.8 *** 收縮壓(mmHg) 130.3±17.9 120.2±19.5*** 舒張壓(mmHg) 76.1±11.4 69.2±11.9*** 空腹血漿血糖(mg/dl) 93.7±10.1 89.8±7.9** 總膽固醇(mg/dl) 195.0±40.8 170.4±39.1*** 三酸甘油脂(mg/dl)# 2.05±0.18 2.01±0.21* 高密度脂蛋白膽固醇(mg/dl) 42.0±9.6 40.8±8.4 低密度脂蛋白膽固醇(mg/dl) 128.0±35.1 106.4±34.4 *** 代謝症候群因子數 代謝症候群比例(%) 2.5±1.1 54 2.0±1.2 ** 37 *
比較肥胖者經28 週完整減重後體重減輕(%Δ)未達 10% 及 10%以上兩組之身體組成及代謝症候群 因子的變化(平均值±標準差) %ΔBMI<10 (n=29) %ΔBMI≧10 (n=34) 減重前 減重後 減重前 減重後 年齡(歲) 規則運動(有/無) 39.1±14.0 13/16 38.7±11.9 25/9§ 體重(公斤) 86.7±18.5 80.8±17.3*** 87.3±14.7 74.2±11.3*** 身體質量指數(公斤/公尺2) 33.1±5.6 30.8±5.4*** 32.4±4.4 27.5±3.5*** 腰圍(公分) 101.1±13.4 95.4±13.4*** 99.2±11.2 86.6±8.5*** 收縮壓(mmHg) 133.0±15.7 123.2±18.6* 127.9±19.5 117.7±20.1*** 舒張壓(mmHg) 76.6±11.1 69.8±10.8* 75.6±11.8 68.6±12.9*** 空腹血漿血糖(mg/dl) 94.7±8.8 92.2±7.2 92.9±11.2 87.8±7.9** 總膽固醇(mg/dl) 192.2±42.3 178.9±43.0** 197.4±40.0 163.2±34.5*** 三酸甘油脂(mg/dl)# 2.08±0.17 2.09±0.24 2.04±0.19 1.93±0.17** 高密度脂蛋白膽固醇(mg/dl) 41.2±9.4 40.2±9.1 42.7±9.9 41.4±7.8 低密度脂蛋白膽固醇(mg/dl) 122.9±35.0 110.2±40.1** 132.3±35.1 103.1±29.0 *** 代謝症候群因子數 代謝症候群人數比例(%) 2.72±1.03 59 2.31±1.17 52 2.29±1.03 50 1.74±1.08** 24*
參考資料
1. Obesity: Preventing and Managing the Global Epidemic. Report of a WHO Consultation on Obesity, Geneva, 3-5 June 1997. Geneva: World Health Organization; 1997
2. 高美丁、曾明淑、葉文婷、張瑛韶、潘文涵﹕臺灣地區居民體位及肥胖狀況。國民營養現況﹕ 1993-1996國民營養狀況變遷調查結果。臺北﹕行政院衛生署,1998﹕143-71。
3. Despres JP, Lemieux S, Lamarche B, Prud’homme D, Moorjani S, Brun LD et al. The insulin
resistance-dyslipidemic syndrome: contribution of visceral obesity and therapeutic implications. Int J Obes Relat Metab Disord. 1995; 19(Suppl 1):S76-86
4. Despres JP, Moorjani S, Lupien PJ, Tremblay A, Nadeau A, Bouchard C. Regional distribution of body fat, plasma lipoproteins, and cardiovascular disease. Arteriosclerosis. 1990;10:497-511
5. Chih-Hsing Wu, Wei-Jen Yao, Feng-Hwa Lu, Jin-Shang Wu, Chih-Jen Chang. Relationship between glycosylated hemoglobin, blood pressure, serum lipid profiles and body fat distribution in healthy Chinese. Atheroslcerosis 1998; 137:157-65.
6. Isomaa B, Almgren P, Tuomi T et al.: Cardiovascular morbidity and mortality associated with the metabolic syndrome. Diabetes Care 2001; 24; 683-689
7. Maison P, Byrne CD, Hales CN, Day NE, Wareham NJ.: Do different dimensions of the metabolic syndrome change together over time? Evidence supporting obesity as the central feature. Diabetes Care 2001; 24; 1758-1763
8. Chee-Eng Tan, Suok-Kai Chew, Stefan Ma, E.-Shyong Tai, Daniel Wai. Can We Apply the National Cholesterol Education Program Adult Treatment Panel Definition of the Metabolic Syndrome to Asians? Diabetes Care. 2004 May;27(5):1182-6
9. Goldstein DJ. Beneficial health effects of modest weight loss. Int J Obes Relat Metab Disord. 1992;16:397-415
10. Clinical Guidelines on the Identification, Evaluation, and Treatment of Overweight and Obesity in Adults. The Evidence Report. National Institutes of Health. National Heart, Lung, and Blood Institute. June 1998.
11. Barbara B. Kahn and Jeffery S. Flier: Obesity and insulin resistance. The journal of Clinical Investigation, 2000, 106(4), 473-481
12. T. M. Wallace, J. C. Levy, D. R. Matthews: Use and Abuse of HOMA Modeling. Diabetes Care, 2004, 27(6), 1487-1495
13. Heymsfield SB, Segal KR, Hauptman J, et al. Effects of weight loss with orlistat on glucose tolerance and progression to type 2 diabetes in obese adults. Arch Intern Med. 2000;160:1321-1326
14. B. Guy-Grand, P. Drouin, E. Eschwege, h. Gin, J-M. Joubert and P. Valensi. Effects of orlistat on obesity-related diseases- a six-month randomized trial. Diabetes, Obesity and Metabolism, 6, 2004, 375-383
15. Maison P, Byme CD, Hales CN, Day NE, Wareham NJ. Do different dimensions of the metabolic syndrome change together over time? Evidence supporting obesity as the central feature. Diabetes Care 2001;24:1758-63
16. Hotamisligil GS. The role of TNFα and TNF receptors in obesity and insulin resistance. J Intern Med 1999;245:621-625
Enzi G (2000): Variation in lipid levels in morbidly obese patients operated with the LAP-BAND® Adjustable Gastric Banding System: Effects of different levels of weight loss. Obes Surg 10: 569-577 18. L. Busetto: Viseral obesity and the metabolic syndrome: Effects of weight loss. Nutr Metab
Cardiovasc Dis (2001) 11: 195-204
19. McLaughlin T, Abbasi F, Carantoni M, Schaaf P, Reaven G. Differences in insulin resistance do not predict weight loss in response to hypocaloric diets in healthy obese women. J Clin Endocrinol Metab 1999;84:578-81
20. Haffner SM, Kennedy E, Gonzalez C, Stern MP, Miettinen H. A prospective analysis of the HOMA model: the Mexico City Diabetes Study. Diabetes Care 19:1138-1141, 1996
21. Anne M Dattilo, and PM Kris-Etherton. Effects of weight reduction on blood lipids and lipoproteins: a meta-analysis. Am J Clin Nutr 1992;56:320-8
22. Yin-Fan Chang, Feng-Hwa Lu, Chih-Hsing Wu, Chin-Song Chang, Kun-Ling Wu, Chih-Jen Chang﹕ A Study of Weight Perception and Weight Reduction Behavior. Chin J Fam Med 2001;11:180-904. 23. Yin-Fan Chang, Chih-Hsing Wu, Kun-Ling Wu, Chin-Song Chang, Feng-Hwa Lu, Chih-Jen Chang. A
pilot study of the usage of anti-obesity drugs among Taiwanese female between 20 and 49 years. Taiwan Fam Med Res 2003;1:32-9.
24. Krempf M, Louvet JP, Allanic H, Miloradovich T, Joubert JM, Attali JR. Weight reduction and long-term maintenance after 18 months treatment with orlistat for obesity. Int J Obes Relat Metab Disord. 2003 27:591-7.
25. Wirth A, Krause J. Long term weight loss of sibutramine. JAMA 2001;286:1131-9.
26. Wadden TA., Berkowitz RI, Womble LG, Sarwer DB, Arnold ME, Steiberg CM. Effects of sibutramine plus orlistat in obese women following 1 year of treatment by sibutramine alone: a placebo-controlled trial. Obes Res. 2000;8:431– 437.
27. Yanovski SZ, yanovski JA. Obesity: drug therapy. N Engl J Med 2002;346:591-602.
28. Wadden TA, Stundard AJ, Brownell KD. Very low calorie diets: Their efficacy, safety , and future. Ann Intern Med 1983; 99:675-84.
29. Fisler JS, Drenic EJ. Starvation and semistarvation diets in the management of obesity. Ann Rev Nutr 1987; 7: 465-84.
30. Dehaven J, Sherwin R, Hendler R, Falig P. Nitrogen and sodium balance and
sympathetic-nervous-system activity in obese subjects treated with a low-calorie protein or mixed diet. N Engl J Med 1980; 302:477-82.
31. Amatruda JM, Richeson JF, Welle SL, Brodows RG, Lockwood DH. The safety and efficacy of a controlled low-energy (“very-low-calorie”) diet in the treatment of non-insulin-dependent diabetes and obesity. Arch Intern Med 1988; 148:873-7.
32. National Task Force on the Prevention of and Treatment of Obesity. Very Low Calorie Diets. JAMA 1993;270:967-974.
33. Burgess NS.Effect of a very low calorie on body composition and resting metabolic rate in obese men and women. J Am Diet Assoc.1991;91:430-434.
34. Chih-Hsing Wu, Wei-Jen Yao, Feng-Hwa Lu, Jin-Shang Wu, Chih-Jen Chang. Relationship between glycosylated hemoglobin, blood pressure, serum lipid profiles and body fat
distribution in healthy Chinese. Atheroslcerosis 1998; 137:157-65.
35. Liou TH, Chu NF, Chiu CC, Wey JH, Lin PW. Validation of a new handheld device
36. Chih-Hsing Wu, Yi-Ching Yang, Wei-Jen Yao, Feng-Hwa Lu, Jin-Shang Wu, Chih-Jen Chang. Epidemiological evidence of increased bone mineral density in habitual tea drinkers. Arch Intern Med 2002 ;162:1001-6.
37. Feng-Hwa Lu, Yi-Ching Yang, Jin-Shang Wu, Chih-Hsing Wu, Chih-Jen Chang. A population-based study of the prevalence and associated factors of diabetes mellitus in southern Taiwan. Diabet Med 1998;15:564-72.
38. Paffenbarger RS, Blair SN, Lee IM, Hyde RT. Measurement of physical activity to assess health effects in free-living populations. Med Sci Sports Exerc. 1993;25:60-70.
39. T. M. Wallace, J. C. Levy, D. R. Matthews: Use and Abuse of HOMA Modeling. Diabetes Care, 2004, 27(6), 1487-1495
40. Wren AM, Seal LJ, Cohen MA. Ghrelin enhances appetite and increases food intake in humans. J
Clin Endocrinol Metab. 2001;50:227-32.
41. Yang WS, Lee WJ, Funahashi T et al. Weight reduction increases plasma levels of an adipose-derived anti-inflammatory protein, adiponectin. J Clin Endocrinol Metab. 2001;86(8):3815-9.
42. Batterham RL, Cohen MA, Ellis SM, et al.Inhibition of food intake in obese subjects by peptide YY3–36. N Engl J Med 2003;349:941-8.
可能問題與解決途徑 1.減重過程的高流失率 此問題確實為本研究最大關鍵所在,因此我們計劃配合以下之措施以減少流失率﹕ 以自我監測動機測試方式進行樣本篩檢。依據經驗而言,約有 25%動機不強的求診肥 胖者會於此階段退出。 開辦三種時段的減重特別門診,包括上午,下午,及傍晚門診。目前正以此方式進行中,六 個月持續追蹤率約可維持在七成以上。 與減重者簽訂契約說明。 定期辦理病友會,成立減重團體以相互約束減重計畫的完成。 請助理不定期電話聯繫關心減重居家生活,設立專屬電子信箱提供各項諮詢。 請助理於回診前提醒減重者回診時間與注意事項。 一旦流失病患也將以電話聯繫詢問原因以作為預防更多病患流失的改進依據。 2.重要測量儀器的使用與協調 目前這些儀器於不同病患需求下提供適當的臨床服務並已獲致良好的成效。所以只需 行政協調後應可順利實施。
(四)預期完成之工作項目及成果。請分年列述:1.預期完成之工作項目。2.對於學術研究、國家 發展及其他應用方面預期之貢獻。3.對於參與之工作人員,預期可獲之訓練。4.本計畫如為 整合型研究計畫之子計畫,請就以上各點分別說明與其他子計畫之相關性。
1.
了解肥胖病患於六個月減重過程前期、中期與後期之肥胖相關細胞激素指標改變情形及 相關影響因素。2.
了解肥胖病患於六個月減重過程前期、中期與後期之新陳代謝症候群指標改變情形及相 關影響因素。3.
探究六個月減重過程前期、中期與後期之身體組成變化情形(尤其是脂肪與非脂肪組織) 及相關影馨因素。4.
比較六個月減重過程前期、中期與後期之基礎代謝率及相關生化指標變化。5.
比較極低熱量飲食組(very low calorie diet )、羅氏鮮藥物控制組(xenical )、諾美婷藥物控制組(reductil)等不同減重模式下,減重過程前期、中期與後期之新陳代謝症候群指標改 變的差異性。