行政院國家科學委員會專題研究計畫 期末報告
鋼筋混凝土剪力連結梁在有(無)軸向束制條件下之耐震行 為
計 畫 類 別 : 個別型
計 畫 編 號 : NSC 101-2221-E-011-086-
執 行 期 間 : 101 年 08 月 01 日至 102 年 07 月 31 日 執 行 單 位 : 國立臺灣科技大學營建工程系
計 畫 主 持 人 : 鄭敏元
計畫參與人員: 碩士班研究生-兼任助理人員:劉建宏
報 告 附 件 : 出席國際會議研究心得報告及發表論文
公 開 資 訊 : 本計畫可公開查詢
中 華 民 國 102 年 09 月 05 日
中 文 摘 要 : 本研究探討對角線鋼筋混凝土剪力牆在有無軸向束制條件下 的往覆載重行為,總共測試四組試體,其中兩組試體同時承 受軸向束制與水平往覆載重,另外兩組試體僅承受水平往覆 載重,測試試體具有相同長度 900mm 與相同斷面寬度
300mm,但是有兩種不同斷面高度,分別為 900mm 與 450mm,
測試結果顯示,具有軸向束制條件的試體具有較高的剪力強 度,較大的勁度以及比較高的能量消耗能力,但是在變形能 力則比沒有軸向束制條件的試體差。
中文關鍵詞: 對角線鋼筋,勁度,變形,能量消耗,勁度衰減
英 文 摘 要 : Cyclic behaviors of diagonally reinforced concrete coupling beams with and without axial restraints were investigated. A total of four coupling beam specimens were tested. Two specimens were tested under combined axial restraint and lateral displacement reversals.
Two specimens were tested under lateral displacement reversals only. Test specimens have identical span length of 35.4 in. (900mm) and width of 11.8 in. (300 mm) but two different depths of either 35.4 in. (900 mm) or 17.7 in. (450 mm). Test results indicates that specimens with axial restraints exhibit higher shear strength, higher stiffness, better energy dissipation ability but lower deformation capacities.
英文關鍵詞: diagonal, stiffness, deformation, deformation, energy dissipation, stiffness deterioration.
1
INTRODUCTION
Reinforced concrete (RC) shear wall is a cost-effective lateral-resisting system and has been used extensively in industry. In many cases, shear walls are interconnected by a series of beams along the story height due to architecture or practical needs. Those beams are referred as coupling beams and the whole system is referred as a coupled shear wall system. When subjected to earthquake type loadings, coupling beams are expected to sustain adequate strength, stiffness and energy dissipation ability under large inelastic deformation in order to maintain designed lateral-resisting mechanism of the coupled shear wall system.
For short and deep RC coupling beams, previous researches indicated that diagonal reinforcement layout effectively improve strength and deformation capacities compared to the conventional beam reinforcement layout (Paulay and Binney, 1974; Barney et al., 1976;
Tegos and Penelis, 1988; Tassios et al., 1996; Galano and Vignoli, 2000). Based on those findings, the current ACI Building Code (ACI Committee 318, 2011) requires diagonal reinforcement layout for RC coupling beams with span-to-depth ratio (aspect ratio) less than 2.0 and shear demand greater than 4 psi (0.33 MPa), where is the specified concrete strength.
From the review of existing experimental studies of RC coupling beams, it is not difficult to notice that different experimental setups have been adopted by different groups of researchers.
Some experimental setups are schematically presented in Fig. 1. Among those, some researchers neglect axial restraint (Tassios et. al., 1996; Canbolat et. al., 2005) and some researchers applied it through a few different ways (Tegos and Penelis, 1988; Galano and Vignoli, 2000; Lequesne et al., 2013). In reality, axial restraint of a coupling beam is provided by the surrounded shear walls and diaphragms. When subjected to earthquake-type loading, it is believed that coupling beams experience different level of axial restraint depending on its damage level. The importance of providing axial restrain on RC coupling beam specimens has been pointed out by a few researchers (Lequesne et al., 2013, Teshigawara, 1998). Hindi and Hassan (2007) also observed that stiffness of specimens with axial restrains are higher compared to those without axial restrains. However, a systematic experimental study to discuss axial restrain effect on RC coupling beams is still lacked.
The objective of this research is to compare cyclic behaviors of diagonally RC coupling beams with and without axial restraint when subjected to lateral displacement reversals. A test program consisting of four coupling beam specimens is conducted. Two specimens were tested under combined axial restraint and lateral displacement reversals and two specimens were tested under lateral displacement reversals only. Based on experimental results, axial- restraint effect on coupling beam behaviors is discussed. Focus is given to diagonally RC coupling beams with aspect ratio less than 2.0.
RESEARCH SIGNIFICANCE
Modeling parameters of RC coupling beams play significant roles on nonlinear structural analysis. Previous researches were conducted using different experimental setups and that makes data analysis difficult. In this research, the influence of axial restrain on cyclic behaviors of diagonally RC coupling beams is investigated.
TEST SPECIMENS
A total of four reinforced concrete coupling beam specimens were tested in this study.
Specimens were sized to be approximately half-scaled. Aspect ratios ( ) of the test specimens were selected at 1 and 2 in order to cover the full range where diagonal
2
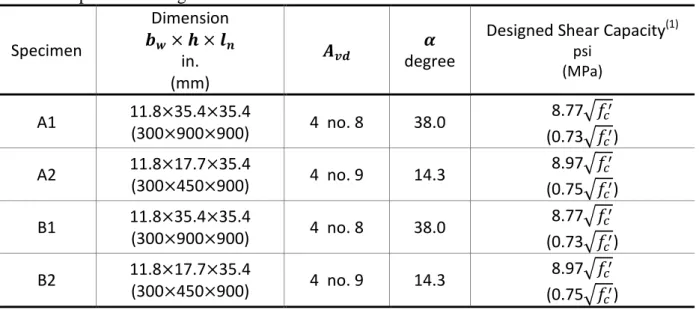
reinforcement are necessary when shear stress is greater than 4 psi (0.33 MPa) per the current ACI Building Code (ACI 318 Committee, 2011). Table 1 summarizes design parameters and corresponding test setup for each test specimen. All coupling beam specimens have an idential clear span ( ) of 35.4 in. (900 mm). The cross section of Specimens A1 and B1 is 11.8 in.(300 mm) in width ( ) and 35.4 in. (900 mm) in depth ( ), as shown in Fig.
2(a). Specimens A2 and B2 also have widths of 11.8 in. (300 mm) but different depths of 17.7 in.(450 mm), as shown in Fig. 2(b). To fully utilize the cross-section, specimens shear capacity is designed to meet with the maximum allowable value as close as possible, i.e.
10 psi (0.83 Mpa). Shear capacity of the coupling beam specimen is determined according to Eq. (1). In which, is the total area of diagonal reinforcement in each group; is the specified yield strength and is the inclined angle of the diagoal reinforcements.
(1)
Grade 60 steels are used for both diagonal and transverse reinforcements in all test specimens.
Specimens A1 and B1 consist of two groups of 4 No. 8 diagonal reinforcements. With an inclined angle ( ) of approximate 38.0 degree, the shear stress capacity for those two specimens is around 8.77 psi (0.73 MPa). Specimens A2 and B2, on the other hand, have a shear stress capacity around 8.97 psi (0.75 MPa). In which, two groups of 4 No. 9 diagonal reinforcements are used with an inclined angle ( ) of approximately 14.3 degree. The specified concrete strength, , is 4 ksi (28 MPa).
Transverse reinforcement or confinement steel was provided for the entire beam cross section according Section 21.9.7.4 of the current ACI Building Code (ACI Committee 318, 2011).
For Specimens A1 and B1, No. 5 reinforcements, with 2 legs in vertical direction and 6 legs in horizontal direction, at 5.1 in. (130mm) spacing are required. For Specimens A2 and B2, No. 5 reinforcements with 2 vertical legs and 3 horizontal legs at 3.9 in. (100 mm) spacing are needed.
EXPERIMENTAL SETUP
Four specimens were evenly divided into two groups depending on the experimental setups.
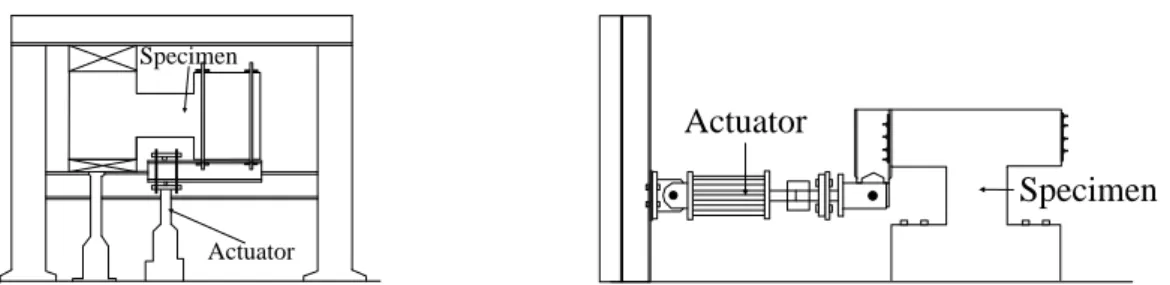
Specimens A1 and A2 are tested under combined axial restraint and lateral displacement reversals. Specimens B1 and B2 are subjected to lateral displacement reversals without axial restraint. The two experimental setups are presented in Fig. 3. Specimens were tested in a vertical position with one end fixed on the strong floor and the other end for load application.
The fixed boundary condition is provided through the use of four prestressed steel rods (2.72 in. (69 mm) diameter) which ties a heavily reinforced bottom concrete block to the strong floor at each corner. Displacement reversals are applied at top concrete block through three 220 kips (100 tonf) actuators. A double curvature test scenario is imposed by setting all actuator movements at the same displacements. The loading history of each actuator is presented in Fig. 4. In which, drift ratio refers to lateral displacement of the actuator divided by the clear span of the beam. Positive drifts are defined as the actuator movement to the north.
Axial-restrained condition for Specimens A1 and A2 was imposed by two steel arms which pin-connect top concrete block and the strong floor. Lequesne et al. (2013) indicated that this test setup provides passive resistance for RC coupling beam specimens similar to the restraint
3
provided by stiff structural walls. For Specimens B1 and B2, steel arms were removed and coupling beam specimens were free to grow axially during the test.
INSTRUMENTATIONS
Steel strains of Specimens A1 and B1 were measured at several locations using a total of 24 strain gauges. Among those, 20 were attached on the diagonal reinforcements and 4 were attached on the transverse reinforcements, as shown in Fig. 5(a). For Specimens A2 and B2, 20 strain gauges were attached on the diagonal reinforcements and 5 were attached on the transverse reinforcements, as shown in Fig. 5(b).
An optical system was employed to monitor external deformations of the specimen during the test. A total of 26 and 18 independent “markers” were fixed to the surface of the specimens A1, B1 and A2, B2, respectively. Each marker is 7.87 in. (200 mm) away in both vertical and horizontal distance. A detailed instrumentation plan of marker positions is presented in Fig. 6.
TEST RESULTS Material
Each specimen pair A1/B1 or A2/B2 was constructed at the same time using the same rebar and concrete materials. Material strengths of the tested specimens are summarized in Table 2.
Concrete was poured twice for each pair of the specimens, first pour to the top of bottom concrete block and 2nd pour for the rest of the specimen. The maximum aggregate size of 3/4 in. in the concrete mixture was requested. The compressive strength of concrete was determined the same day after the corresponding specimen was tested by an average strength of three 4 by 8 in. cylinders. Rebar strength was determined from direct tensile test results of three steel coupons.
Observations during the test -Specimen A1
During 0.25% drift cycles, horizontal cracks were observed at both ends of the specimen.
Diagonal cracks developed during the 0.50% cycles. Most of cracks developed between 0.50% and 3.50% drift cycles. Diagonal crack widths became wider compared to the horizontal cracks during the 3.50% drift cycle. Concrete cover started to spall off during 4.00% drift cycles. In the next drift cycles, concrete cover crushed at the bottom corner of the specimen. Concrete cover in the mid-section of the specimen started to bulge out during 5.50% drift cycles. After that, damage seems to concentrate at middle of the specimen. Most of the concrete cover fell off during 6.00% drift cycles. Through visual observation, concrete core within the diagonal rebars crushed and one of the exposed diagonal rebars buckled during the 1st cycle of 6.00% drift. Lateral resistance in this cycle dropped around 30% and 40% in the positive and negative direction, respectively. In the 2nd cycle of 6.00% drift, two explosive sounds were heard accompanied by two sudden drops of lateral load when the specimen was loaded from positive to the negative direction. Test terminated after complete of 6.00% drift cycles. After loose concrete was removed, as shown in Fig. 7(a), it is found that concrete core within the diagonal rebars was seriously damaged, most of the diagonal rebars were buckled and two diagonal rebars were broken.
-Specimen A2
Both horizontal and diagonal cracks were observed during 0.25% drift cycles. Most of cracks developed between 0.25% and 2.50% drift cycles. After 2.50% drift cycles, crack openings started to concentrate on the two diagonal cracks. Corner concrete cover crushed at bottom of the specimen during the 2.50% drift cycles. Diagonal cracks width increased significantly
4
during the 3.50% drift cycles. Concrete cover started to spall off seriously during the 4.50%
drift cycles and specimen lost approximately 80% of the concrete cover at the end of 5.50%
drift cycles. Concrete core within the confinements was still intact through visual observation after complete of 5.50% drift cycles. During 6.00% drift cycles, concrete core crushed and lateral resistance dropped around 33% and 41% from the peak in the positive direction of 1st and 2nd cycle, respectively. Test terminated after complete of 1st cycle of 6.50% drift because of significant loss of lateral resistance in both positive and negative directions. After loose concrete was removed, it can be found that concrete core was seriously damaged and all diagonal bars were buckled. The final stage of Specimen A2 is presented in Fig. 7(b).
-Specimen B1
Horizontal and diagonal crack was first observed during the 0.25% and 0.50% drift cycles, respectively. Most of cracks formed between 0.50% and 4.50% drift cycles. Concrete cover started to spall off during 6.00% drift cycles. Corner concrete crushed during the 6.50% drift cycles. Damage seems to concentrate at bottom of the specimen after 6.50% drift cycles.
Meanwhile, diagonal crack widths become wider also during the 6.50% drift cycles. Further pushing the specimen to 7.00% drift, most of concrete cover at bottom of the specimen fell off and concrete core seems damaged. Lateral resistance dropped around 40% from the peak in the positive direction. As the specimen was loaded to the negative direction, two explosive sounds were heard accompanied by two sudden drops of lateral loads before reaching target drift level. Test terminated after complete of 1st cycle of 7.00% drift. The final stage of Specimen B1 after loose concrete was removed is presented in Fig. 7(c).
-Specimen B2
Horizontal cracks were observed during the 0.25% drift cycles. Diagonal cracks did not appear until 0.75% drift cycles. The number of cracks was relatively less compared to Specimen A2 at the same drift level, especially for diagonal cracks. This phenomenon is not such obvious between Specimens A1 and B1. Most cracks formed between 0.50% and 3.00% drift cycles. Corner concrete crushed during the 4.00% drift cycles. Two diagonal cracks across the specimen became more obvious during 6.00% drift cycles. It seems that diagonal crack widths grow slower for specimens without axial restraints. Large concrete cover spalled off during the 6.50% drift cycles. Concrete core crushed during the 8.00% drift cycles. In the 2nd cycle of 8.00% drift, top concrete block twist and test terminated after complete of this cycle. After loose concrete removed, it is found that all diagonal rebars buckled and concrete core at top of the specimen was serious damaged. The final stage of Specimen B2 is presented in Fig. 7(d).
Hysteretic responses
Hysteretic responses of the four specimens are presented in Fig. 8. In Which, shear stress for the vertical axis is normalized by the concrete cylinder strength. All specimens exhibit
“robust” hysteric responses. However, the negative post-yield stiffness distinguishes Specimen A2 from other specimens. It is likely due to P-∆ effect. The negative post-yield stiffness can be also observed in the test specimens of Galano and Vignoli (2000), who tested coupling beam specimens with aspect ratios of 1.50. The potential of developing negative post-yield stiffness for diagonally RC coupling beam with aspect ratio greater than 1.50 should be carefully considered in the structural modeling.
A bilinear shear stress-drift model was developed for each specimen in order to evaluate lateral stiffness and displacement ductility. This idealized bilinear curve was developed by first connecting peak value of 1st cycle at each target drift level in the positive direction.
5
Assuming the linear portion of bilinear model passes 60% of the peak overturning moment and the slope of the elastic stiffness was obtained. Then, the ultimate displacement, , was determined at the point which corresponds to the overturning moment with 20% drop from the peak. Finally, the yield moment, , should be determined such that areas of the idealized bilinear curve and the envelope curve are equivalent up to the ultimate displacement.
The idealized bilinear shear stress-drift responses of the four specimens are presented in Fig.
8. Numerical values of the idealized bilinear curves as well as some test results of all test specimens are summarized in Table 3.
According to Table 3, shear strength of Specimen A1 is 17% higher than that of Specimen B1.
Similar trend and ratio can be found between Specimens A2 and B2. Deformation capacity of Specimen B1 and B2 is each 15% and 50% higher than that of Specimen A1 and A2, respectively. It may be concluded that specimens with axial restraints exhibit higher shear strength but lower deformation capacities. Displacement ductility, however, does not show a clear trend. In additions, specimens with axial restrain possess more than 60% higher stiffness than specimens without axial restrain based on the idealized bilinear curves.
Stiffness degradation of each specimen is evaluated through secant stiffness ratio at each cycle, as presented in Fig. 9. For each specimen, the secant stiffness ratio is defined as secant peak-to-peak stiffness of each cycle divided by the initial stiffness from the idealized bilinear curve. As can be seen from Fig. 9, stiffness of specimens with axial-restraints deteriorate faster. The secant stiffness ratio of Specimen B1 and B2 is about 20% higher than that of Specimen A1 and A2, respectively.
Energy dissipation ability of each specimen is presented in Fig. 10. In which, energy dissipation ratio at each cycle is defined as the energy dissipation within that cycle or area enclosed by the force-displacement response curve of that cycle divided by the energy stored in the equivalent linear system that has the same peak load and displacement as the specimen.
The energy dissipation ratio at each drift is then determined by the average value of all drift cycles. From Fig. 10, energy dissipation ratio of all test specimens are similar at early stage.
After 2.00% drift cycles, however, the trend shows that specimens with axial restraints exhibit better energy dissipation than their counterparts at the same drift level.
Strain Gauge Readings
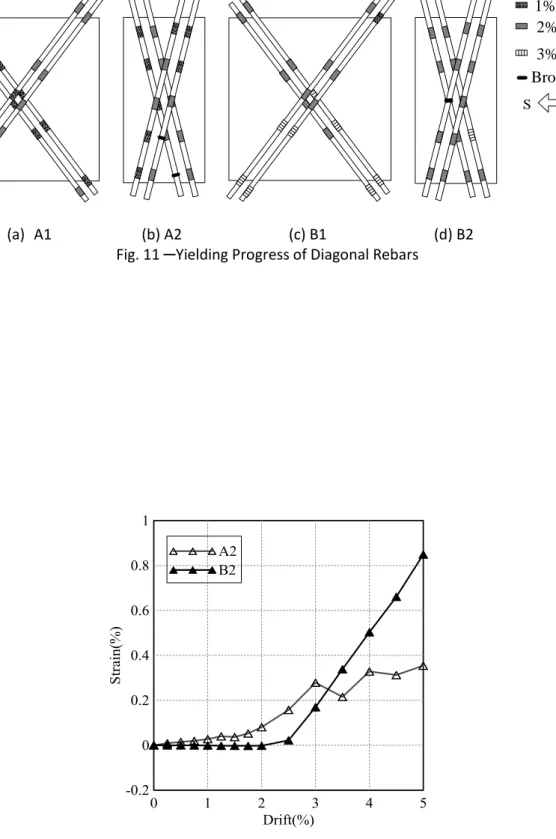
Based on the strain gauge readings, the progress of yielding of diagonal rebars at different locations in each specimen is presented in Fig. 11. In which, locations of strain gauges that exceed yielding strain after complete of three selected drift cycles is represented by three different marks. RC coupling beams with small aspect ratios resist shear through strut-and-tie mechanism. While strut is contributed by both diagonal rebars and concrete core, ties are provided mostly by diagonal rebars. And thus, most strain gauges exceed yielding strain in tension. Fig. 11 shows that diagonal rebars yielded earlier in the specimens with axial restrains. In Specimens A1 and A2, diagonal rebars yielded at many locations after complete of 1.00% drift cycles. However, yielding of diagonal rebars in Specimens B1 and B2 were mostly observed during the 1.75% and 2.00% drift cycles.
Deformation
The optical system experienced problems during the tests of Specimens A1 and B1 and did not record external deformation data for the two specimens. Deformation results are available only for Specimens A2 and B2. Axial elongations of Specimens A2 and B2 after complete of each drift cycle are presented in Fig. 12. It seems that axial elongation is negligible in
6
Specimen B2 before 2.00% drift cycles but steadily increases in Specimen A2. It is likely due to the yielding of diagonal rebars at different drift levels in the two specimens. The maximum recorded axial strain is more than 1.0% for Specimen B2 and about 0.4% for Specimen A2.
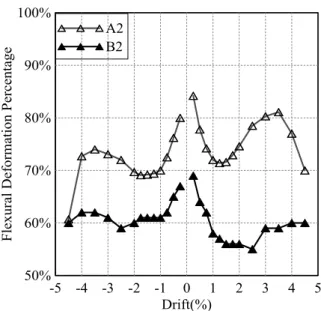
Flexural deformations of Specimens A2 and B2 are evaluated using recorded data from the optical system as well. As shown in Fig. 6, Specimens A2 and B2 can be divided into 6 strips by the 18 markers. Curvature of each strip was first determined using the average value of the two quadrilateral elements. The curvature distributions show that inflection points of Specimens A2 and B2 are both within the 3rd strip or mid-height of the specimens throughout the test. Also, the curvature at the ends of Specimen B2 was not significantly different compared to Specimen A1. The “rocking” behavior of Specimen B2 seems inhibited, probably due to the vertical test position with heavy experimental setups on the top.
Flexural deformation was then calculated using moment-area method assuming curvature is uniformly distributed along each strip. The contributions of flexural deformation at each drift level for both specimens are presented in Fig. 13. Specimen A1 with axial restraint consists of higher percentage of flexural deformation. The axial load increases shear stiffness that leads to small shear deformation of Specimen A2 despite it carries more shear at similar drift level than Specimen B2. In general, the contribution of flexural deformation in Specimen A2 ranges between 70% to 85%, similar to the findings from Setkit (2012), whose coupling beam specimens had aspect ratio of 2.75. The gradual increase of flexural deformation percentage for Specimen A2 from 2.00% to 3.50% drift level especially in the positive direction might reveal the evidence of P-∆ effect. After 3.50% drift, the percentage of flexural deformation drops significantly in Specimen A2 because damage starts to concentrate on the diagonal cracks in the larger drift levels. In contrast, the contribution of flexural deformation of Specimen B2 seems pretty constant at around 60% throughout the test. Specimen B2 did not develop severe diagonal cracks until 6.00% drift level.
CONCLUSIONS
Four approximately half-scaled diagonally RC coupling beam specimens were tested in this study. Two specimens, each with aspect ratio of 1 and 2, were tested under combined axial restraint and lateral displacement reversals. Another two specimens, each with aspect ratio of 1 and 2 as well, were tested under lateral displacement reversals only. Test results show that cyclic behaviors of diagonally RC coupling beams specimens with and without axial restraints are quite different.
1. All specimens exhibited robust hysteretic response, however, the negative post-yield stiffness distinguishes Specimen A2 from other specimens. It is likely due to P-∆ effect.
This potential of developing negative post-yield stinffness for diagonally RC coupling beam with aspect ratio greater than 1.50 should be carefully considered in the structural modeling.
2. In general, coupling beam specimens with axial restraint exhibited higher shear strength, higher stiffness and better energy dissipation at the same drift level compared to the axially-free test specimens, which possess higher deformation capacities and sustain better stiffness deterioration. Displacement ductility, however, does not show a clear trend.
3. For specimens with axial restraints, the contribution of flexural deformation to the overall deformation is higher compared to specimens without axial restraints.
7
REFERENCES
ACI Committee 318, 2011, “Building Code Requirements for Structural Concrete (ACI 318- 11) and Commentary,” American Concrete Institute, Farmington Hills, Mich., 503pp.
Barney, G. B., Shiu, K. N., Rabbat, B. G., and Fiorato, A. E., 1976, “Earthquake Resistance Structure Walls – Test of Coupling Beams (Progress Report),” Portland Cement Association, Skokie, Illinois, 137 pp.
Canbolat, B. A., Parra-Montesinos, G. J., and Wight, J. K., 2005, “Experimental Study on Seismic Behavior of High-Performance Fiber-Reinforced Cement Composite Coupling Beams,” ACI Structural Journal, V. 102, No. 1, Jan.-Feb., pp. 159-166.
Galano, L., and Vignoli, A., 2000, “Seismic Behavior of Short Coupling Beams with Different Reinforcement Layouts,” ACI Structural Journal, V. 97, No. 6, Nov.-Dec., pp. 876- 885.
Hindi, R., Hassan, M., 2007, “Simplified trilinear behavior of diagonally reinforced coupling beams,” ACI Structural Journal, V. 104, No. 2, Mar., pp. 199-206
Lequesne, R.D., Parra-Montesinos, G.J., Wight, J.K. 2013, “Seismic behavior and detailing of high-performance fiber-reinforced concrete coupling beams and coupled wall systems,”
Journal of Structural Engineering, V.139,No. 8, Aug., pp. 1362-1370.
Paulay, T., and Binney, J. R., 1974, “Diagonally Reinforced Coupling Beams of Shear Walls,” Shear in Reinforced Concrete, SP-42, American Concrete Institute, Farmington Hills, Mich., pp. 579-598.
Setkit, M., 2012, “Seismic Behavior of Slender Coupling Beams Constructed with High- Performance Fiber-Reinforced Concrete,” Ph.D. dissertation, Univ. of Michigan, Ann Arbor, MI.
Tassios, T. P., Moretti M., and Bezas A., 1996, “On the Behavior and Ductility of Reinforced Concrete Coupling Beams of Shear Walls,” ACI Structural Journal, V. 93, No. 6, Nov.-Dec., pp. 711-720.
Tegos, I. A., and Penelis, G. G., 1988, “Seismic Resistance of Short Columns and Coupling Beams Reinforced with Inclined Bars,” ACI Structural Journal, V. 85, No. 1, Jan.-Feb., pp.
82-88.
Teshigawara, M., Kato, M., Sugaya, K., and Matsushima, Y., 1998.,“ Energy absorption mechanism and the fl uctuation of shear force in the coupled shear walls,” Proc., Structural Engineering World Wide 1998, Elsevier Science, Amsterdam, Netherlands.
8 Table 1: Specimen Design Parameters.
Specimen
Dimension
in.
(mm)
degree
Designed Shear Capacity(1) psi
(MPa)
A1 11.8 35.4 35.4
(300 900 900) 4 no. 8 38.0 8.77
(0.73 ) A2 11.8 17.7 35.4
(300 450 900) 4 no. 9 14.3 8.97
(0.75 ) B1 11.8 35.4 35.4
(300 900 900) 4 no. 8 38.0 8.77
(0.73 ) B2 11.8 17.7 35.4
(300 450 900) 4 no. 9 14.3 8.97
(0.75 ) (1) : Specified concrete strength 4 ksi (28 MPa).
Table 2: Summary of Material Properties
Concrete Cylinder Test Result Reinforcement Coupon Test Results Specimen
Strength psi (MPa)
Rebar Size
Yield Stress ksi (MPa)
Peak Stress ksi (MPa)
A1 4900
(34) No. 5 64.8
(447)
96.0 (662)
A2 5171
(36) No. 8 66.1
(456)
94.8 (654)
B1 4786
(33) No. 9 66.8
(461)
95.7 (660)
B2 5100
(35) Table 3: Summary of Test Results
Specime n
psi (MPa)
psi (MPa)
psi (MPa)
Ultimat e Drift, (%)
Yield Drift
, (%)
Displacemen t Ductility,
A1 8.73
(0.73)
17.25 (1.44)
16.46
(1.37) 5.82 1.91 3.05
A2 9.14
(0.76)
18.10 (1.51)
16.77
(1.40) 4.98 1.38 3.61
B1 8.83
(0.74)
14.64 (1.22)
14.24
(1.19) 6.74 2.68 2.51
B2 9.20
(0.77)
15.44 (1.29)
14.40
(1.20) 7.49 1.97 3.80
(a) Evaluated using Eq. (1) with =Coupon test results.
(b) : Concrete cylinder strength
9
(a) Without Axial Restraint (Left: Tassios et. al., 1996; Right: Canbolat et al., 2005)
(b) With Axial Restraint (Left: Tegos and Penelis, 1988; Right: Lequesne et al., 2013) Fig. 1 — Experimental Setups of RC Coupling Beam Specimens from Previous Studies
(a) Specimen A1 and B1
(b) Specimen A2 and B2
Fig. 2 — Reinforcement Layout of Test Specimens
Actuator Specimen
Specimen Actuator
Actuator Actuator Specimen
Specimen Actuator
No. 5
No. 8 35.4 in.
(900 mm) A
B 35.4 in. (900 mm)
No. 5 B
A
6.1 in.
(154 mm) 5.1 in. (130 mm)
3.1 in.
(80 mm)
2.4 in. (60 mm) 11.8 in. (300 mm)
Section A-A
Section B-B No. 8
No. 8
11.8 in. (300 mm)
No. 9 No. 5
No. 5 3.1 in.
(80 mm)
2.6 in. (65 mm)
Section A-A
Section B-B 17.7 in.
(450 mm)
35.4 in. (900 mm)
A
B
A
B
6.3 in.
(161 mm) 3.9 in. (100 mm)
No. 9
No. 9
10
(a) Specimens A1 and A2
(b) Specimens B1 and B2 Fig. 3 — Experimental Setups
Fig. 4 — Loading History
Actuator 3 Steel beam
Steel arm 157.5 in.
(4000 mm)
98.4 in.
(2500 mm)
Actuator 1 & 2 Test Specimen
N S
Top Concrete Block
Bottom Concrete Block 55.1 in.
(1400 mm) 35.4 in.
(900 mm) 55.1 in.
(1400 mm)
Actuator 3 Steel beam
118.1 in.
(3000 mm)
98.4 in.
(2500 mm)
Test Specimen
Actuator 1 & 2
N S
Top Concrete Block
Bottom Concrete Block 55.1 in.
(1400 mm) 35.4 in.
(900 mm) 55.1 in.
(1400 mm)
11
(a) Specimens A1 and B1 (b) Specimens A2 and B2 Fig. 5 — Strain Gauge Installation Plan
(a) Specimens A1 and B1 (b) Specimens A2 and B2 Fig. 6 — Markers Layout Plan
14 15 13 12 11
24 25 23 22 21
34 35 33 32 31
44 45 43 42 41
D1 D2 D3
D4
No. 8 Dia. Rebar 47.8 in.
(1214 mm)
7.9 in.
(200 mm) 142.8 in.
(3628 mm)
47.8 in.
(1214 mm) Strain Gauges
Section A-A
D1 D2 D3 D4
No. 9 Dia. Rebar 47.8 in.
(1214 mm)
7.9 in.
(200 mm) 142.8 in.
(3628 mm)
47.8 in.
(1214 mm) Strain Gauges
14 15 13 12 11
24 25 23 22 21
34 35 33 32 31
44 45 43 42 41
Section A-A
35.43 in. (900 mm)
35.43 in.
(900 mm)
7.87 in. (200 mm) 35.43 in. (900 mm)
17.72 in.
(450 mm)
7.87 in. (200 mm)
Specimen: A1 & B1 Specimen: A2 & B2
7.87 in.
(200 mm)
15.74 in.
(400 mm)
7.87 in.
(200 mm)
35.43 in. (900 mm)
35.43 in.
(900 mm)
7.87 in. (200 mm) 35.43 in. (900 mm)
17.72 in.
(450 mm)
7.87 in. (200 mm)
Specimen: A1 & B1 Specimen: A2 & B2
7.87 in.
(200 mm)
15.74 in.
(400 mm)
7.87 in.
(200 mm)
12
(a) Specimen A1 (b) Specimen A2
(c) Specimen B1 (d) Specimen B2 Fig. 7 — Final States of Test Specimen
(a) Specimen A1 (b) Specimen B1
(c) Specimen A2 (d) Specimen B2 Fig. 8 ─ Hysteric Responses
13
Fig. 9 ─ Stiffness Degradation
Fig. 10 ─ Energy Dissipation
14
1%
2%
3%
Broken
S N
(a) A1 (b) A2 (c) B1 (d) B2 Fig. 11 ─ Yielding Progress of Diagonal Rebars
Fig. 12 ─ Axial Strain of Specimens A2 and B2
15
Fig. 13 ─ Contribution of Flexural Deformation in Specimens A2 and B2
國科會補助專題研究計畫項下出席國際學術會議心得報告
日期:102 年 9 月 5 日
一、參加會議經過
此行赴加拿大多倫多市 (Toronto, Ontario) 出席美國混凝土學會 2012 秋季年會,主 要目的參加 352 委員會 (Joints and Connections in Monolithic Concrete Structures),該委 員會主要討論鋼筋混凝土構件在連接處的耐震行為,針對每年的研究提出設計建議,
報告人目前為 352 委員會委員,負責更新委員會技術報告 (committee report) 內的板柱 接頭的計算範例,此行除了負責更新計算範例之外也在委員會中報告去年針對角落板 柱接頭的研究成果。除此之外,亦利用此行機會旁聽委員會 374 委員會 (Performance Based Design) 、 318-E 委 員 會 (Shear and Torsion) 以 及 最 後 一 天 318-H (Seismic Provision) 委員會的討論,了解耐震設計趨勢,認識規範制定過程。
10 月 21 日: 早上抵達多倫多市,參加 352 委員會會議 (Joints and Connections in Monolithic Concrete Structures) ,報告去年研究成果。
10 月 22 日: 出席 374 委員會會議 (Performance Based Design) 。
10 月 23 日: 出席 318-H (Seismic Provision) 與 318-E 委員會 (Shear and Torsion)會議。
10 月 24 日: 返國。
二、與會心得
每次出席美國混凝土學會會議均獲益良多,與一般研討會性質不一樣,此會議 並不是一個正式發表研究成果的地方,主要目的是為了要發展未來鋼筋混凝土構件 的設計規範,因此與會人士會討論彼此所學,根據不同的研究成果得到一致的方向,
以作為未來設計規範的依據,參與討論的專家有一大部分來自於業界,因此在會議 中,除了可以聽到學者的意見外,更可以了解工程師對研究方向的反應,會後也可 以與不同專家討論,是一個很難得的機會,很感謝國科會能提供這次參加會議的補
計畫編號 NSC101-2221-E-011-086
計畫名稱
鋼筋混凝土剪力連結梁在有(無)軸向束制條件下之
耐震行為
出國人員
姓名 鄭敏元
服務機 構及職 稱
國立台灣科技大學助理 教授
會議時間
101 年 10 月 21 日 至
101 年 10 月 25 日
會議地 點
加拿大多倫多市
會議名稱 (中文) 美國混凝土協會 2012 年秋季年會 (英文) ACI Fall Convention 2012
發表論文 題目
(中文) 角落板柱接頭實驗成果發表
(英文) Presentation of an Experimental Study of Corner Slab-Column Connection
助。此行遇到台灣大學黃世建教授、Tony Liu 教授以及國家地震中心主任張國鎮教 授,獲益良多。
三、建議
希望有機會能帶學生一同前往,增加自己研究團隊的能見度,鼓勵學生及早加 入國際規範組織。
四、攜回資料名稱及內容
(1) 申請者於 352 委員會報告簡報內容。
(2) 352 委員會開會會議章程與會議紀錄各一份。
申請者簡報資料
ACI 352 會議會議章程
ACI‐ASCE Committee 352
“Joints and Connections in Monolithic Concrete Structures”
Meeting Agenda ACI Fall 2012 Convention Sunday, October 21, 2012
2:00 pm – 5:00 pm Meeting Room “PEEL”
Sheraton Centre Toronto, Ontario, Canada 1. Call to order and introductions
2. Approval of minutes from the Spring 2012 committee meeting in Dallas
3. Results of ballot for slab‐column connection design Example 2 to supplement ACI 352.1R‐11 (D.
Fick and M.‐Y. Cheng)
4. Discussion on the organization of the update to ACI 352R‐02 (M. Hueste on behalf of J. Moehle)
5. Task group updates to revise and update ACI 352R‐02:
TG1: Overall Technical and Editorial Review and General Updates (J. LaFave*, M. Hueste*, T. Kang, D. Fick)
TG2A: Headed reinforcement applications in beam‐column joints & connections (T. Kang*, H. Lee, M. Shin)
TG2B: Effective joint area/strength reduction factors for beam‐column joints for shear resistance (S.‐J. Hwang*, J. LaFave*, H.‐J. Lee, B. Burak, M. Shin)
TG2C: High‐strength materials in beam‐column connections (H.‐J. Lee*, S.‐J. Hwang) TG2D: Fiber‐reinforced beam‐column connections (G. Parra‐Montesinos*)
TG3: Updates and addition to the examples (placeholder ‐‐ to be determined) [* indicates task group leader(s)]
6. Discussion of 318‐H Ballot item related to beam‐column joints (J. Bonacci and T. Kang)
7. Presentation of two corner slab‐column connection tests (M.‐Y. Cheng)
8. Technical sessions
Mini‐track for 2013 Structures Congress (M. Hueste and J. LaFave) Suggestions for future technical sessions
9. Other business / presentations / new business (please notify M. Hueste in advance of any items in these categories)
10. Schedule for the next committee meeting
11. Adjournment
**Any remaining time can be used for task group coordination.
國科會補助計畫衍生研發成果推廣資料表
日期:2013/09/05
國科會補助計畫
計畫名稱: 鋼筋混凝土剪力連結梁在有(無)軸向束制條件下之耐震行為 計畫主持人: 鄭敏元
計畫編號: 101-2221-E-011-086- 學門領域: 結構應力
無研發成果推廣資料
101 年度專題研究計畫研究成果彙整表
計畫主持人:鄭敏元 計畫編號:101-2221-E-011-086- 計畫名稱:鋼筋混凝土剪力連結梁在有(無)軸向束制條件下之耐震行為
量化
成果項目 實際已達成
數(被接受 或已發表)
預期總達成 數(含實際已
達成數)
本計畫實 際貢獻百
分比
單位
備 註 ( 質 化 說 明:如 數 個 計 畫 共 同 成 果、成 果 列 為 該 期 刊 之 封 面 故 事 ...
等)
期刊論文 0 0 100%
研究報告/技術報告 0 0 100%
研討會論文 0 0 100%
論文著作 篇
專書 0 0 100%
申請中件數 0 0 100%
專利 已獲得件數 0 0 100% 件
件數 0 0 100% 件
技術移轉
權利金 0 0 100% 千元
碩士生 1 0 100%
博士生 0 0 100%
博士後研究員 0 0 100%
國內
參與計畫人力
(本國籍)
專任助理 0 0 100%
人次
期刊論文 0 0 100%
研究報告/技術報告 0 0 100%
研討會論文 0 0 100%
論文著作 篇
專書 0 0 100% 章/本
申請中件數 0 0 100%
專利 已獲得件數 0 0 100% 件
件數 0 0 100% 件
技術移轉
權利金 0 0 100% 千元
碩士生 0 0 100%
博士生 0 0 100%
博士後研究員 0 0 100%
國外
參與計畫人力
(外國籍)
專任助理 0 0 100%
人次
其他成果
(
無法以量化表達之成果如辦理學術活動、獲 得獎項、重要國際合 作、研究成果國際影響 力及其他協助產業技 術發展之具體效益事 項等,請以文字敘述填 列。)
無
成果項目 量化 名稱或內容性質簡述
測驗工具(含質性與量性) 0
課程/模組 0
電腦及網路系統或工具 0
教材 0
舉辦之活動/競賽 0
研討會/工作坊 0
電子報、網站 0
科 教 處 計 畫 加 填 項
目 計畫成果推廣之參與(閱聽)人數 0
國科會補助專題研究計畫成果報告自評表
請就研究內容與原計畫相符程度、達成預期目標情況、研究成果之學術或應用價 值(簡要敘述成果所代表之意義、價值、影響或進一步發展之可能性) 、是否適 合在學術期刊發表或申請專利、主要發現或其他有關價值等,作一綜合評估。
1. 請就研究內容與原計畫相符程度、達成預期目標情況作一綜合評估
■達成目標
□未達成目標(請說明,以 100 字為限)
□實驗失敗
□因故實驗中斷
□其他原因 說明:
2. 研究成果在學術期刊發表或申請專利等情形:
論文:□已發表 □未發表之文稿 ■撰寫中 □無 專利:□已獲得 □申請中 ■無
技轉:□已技轉 □洽談中 ■無 其他:(以 100 字為限)
3. 請依學術成就、技術創新、社會影響等方面,評估研究成果之學術或應用價 值(簡要敘述成果所代表之意義、價值、影響或進一步發展之可能性)(以 500 字為限)
Modeling parameters of RC coupling beams play significant roles on nonlinear structural analysis. Previous researches were conducted using different experimental setups and that makes data analysis difficult. In this research, the influence of axial restrain on cyclic behaviors of diagonally RC coupling beams is investigated.