從教師角度研究教學策略在信譽良好學校
及信譽不良學校的實施及有效性
黃金雁
Kurt J. Minervino
摘 要
研究目的 本量化研究從 K-12 教師角度分析在信譽良好學校及信譽不良學 校實施各種教學策略的有效性及可能性。 研究設計/方法/取徑 本研究使用 SPSS 和概化理論分析了來自紐約州西部公立學校 (含信譽良好學校及信譽不良學校)73 名 K-12 教師實施 13 種教學 策略的可能性及有效性。 研究發現或結論 研究結果表明在信譽良好學校某些教學策略更易實施且更有 效;這些策略應同樣在信譽不良學校實施。本研究統計結果暗示應 制定持續職業發展及實施有效教學策略政策。 研究原創性/價值性 本研究對教育政策制定有重要意義。紐約州教育部應該增加對 黃金雁(通訊作者),Professor of Leadership and Policy, Niagara University, Lewiston, New
York, U.S.A.
電子郵件:[email protected]
Kurt J. Minervino, Doctoral Candidate, Niagara University, Lewiston, New York, U.S.A 電子郵件:[email protected]
不良學校的教育經費撥款,使之享有更多教育資源來滿足學生不同 的需求。
關鍵字: 有效學校、教學策略、概化理論、教學有效性、實施可能 性
TEACHER PERCEIVED EFFECTIVENESS AND
USE OF TEACHING STRATEGIES AT SCHOOLS
IN GOOD STANDING VERSUS FAILING
SCHOOLS
Jinyan Huang Kurt J. Minervino
ABSTRACT
Purpose
The purpose of this quantitative study was to examine K-12 teacher perceptions about the instructional strategies in terms of the likelihood that they would implement in their classroom teaching as well as the effectiveness of these instructional strategies in both schools in good standing and schools not in good standing.
Design/methodology/approach
Using SPSS and generalizability theory analyses, this study examined how 73 teachers at a variety of public K-12 schools (i.e., schools in good standing and schools not in good standing) in Western New York would employ and evaluate the perceived effectiveness of 13 teaching strategies.
Findings
The results show that some instructional strategies are more likely to be utilized and perceived to be more effective in high performing schools; the same should be employed at schools that are not in good standing. Policy implications for continued professional development and implementation of highly effective teaching
Jinyan Huang (corresponding author), Professor of Leadership and Policy, Niagara University,
Lewiston, New York, U.S.A. E-mail: [email protected]
Kurt J. Minervino, Doctoral Candidate, Niagara University, Lewiston, New York, U.S.A. E-mail: [email protected]
practices can be made and substantiated by the statistical results of this study.
Originality/value
The results of this study have important educational policy implications. It is suggested that the State Education Department increases funding to schools which are not in good standing to allow for more resources to assist with the diversified needs of their student population.
Keywords: effective schools, instructional strategies, generalizability theory, effectiveness of teaching, likelihood of implementation
Introduction
Billions of dollars are spent each year in public K-12 education across the United States and the world. The intention of public K-12 education is to provide students with an education that can accommodate their diverse learning styles and needs, allowing for academic success for students (Hamdy & Urich, 1998; Maltese, Dexter, Tai, & Sadler, 2007). Educational researchers have explored ways to improve the products of the educational system for decades (Cobb, Abate, & Baker, 1999; Fletcher, 1997; Hamdy & Urich, 1998; Maltese et al., 2007). Various aspects of the educational system have been examined, analyzed, and synthesized (Hamdy & Urich, 1998; Maltese et al., 2007). This study examines how teachers in both schools of good standing and schools not in good standing (focus and priority schools) employ and evaluate the perceived effectiveness of 13 teaching strategies and philosophies of education. The results of the statistical procedures can allow for reflection on what teaching strategies are more likely to be implemented in schools in good standing. The number of years of teaching is also a variable that must be examined to evaluate if identified and perceived effective strategies are utilized more or less frequently by novice versus veteran teachers.
School Types and Teacher Certification
New York State Department of Education’s Office of Accountability classifies all schools in its jurisdiction as one of three designations: (a) focus schools, (b) priority schools and, (c) schools in good standing. Most recently there has also been the designation of receivership schools that are on the verge of being taken over by State or other interests. The schools in these three categories are classified on basis of their performance on state standardized assessments (NYSED, 2016). The schools are then observed to analyze their progress on standardized tests. Schools in good standing are those that have been successful in meeting the State Education Department’s goals for student growth and graduation rates (NYSED, 2016). Both focus and priority labeled schools are identified as struggling schools because they have not been able to meet the annual yearly markers set by the New York State Education Department (NYSED, 2016). Priority schools are schools which have consistently performed poorly, these schools are among the lowest five percent of schools within the state. Their overall proficiency on English Language Arts and Mathematics assessments are at or below 31% (NYSED,
2016). Focus schools are also schools where the student population fails to meet performance standards, however these schools score better than priority schools. Focus schools have graduation rates less than 75% and an overall proficiency in English Language Arts and Mathematics of 45% (NYSED, 2016). In this study the focus and priority schools are grouped and labeled “schools not in good standing”.
Professional development is an essential part of teacher growth and development and is a means by which educators can become exposed to and develop fluency in newer instructional practices (Neville, 2010; Rakes, Fields, & Cox, 2006; Stanford & Reeves, 2009). New teachers with provisional and professional certification in New York as well as other states in the country are mandated to attend a prescribed number of hours of continued learning to maintain their certifications; it is 175 hours every five years in the state of New York (NYSED, 2016). This is mandated for newer teachers; but more seasoned teachers who are not mandated may not get as many opportunities to explore or learn about newer instructional practices, which could impact their effectiveness in implementing new strategies into their classroom instruction (Gormley & McDermott, 2014). Teachers who have been in the workforce for about a decade or more were granted permanent certification and have no mandates for continuing their professional development (NYSED, 2016). Many of the more progressive teaching strategies have only been developed over the past decade or two; older teachers with permanent certification may not have been instructed in these practices in their training and without mandatory professional development under their certification type, permanent, they may not be as inclined to include these practices.
Instructional Practices
Lunenburg and Irby (2011) identified, explained and coached teachers through the use of ten different instructional strategies. These strategies are all practices that could easily be classified as differentiated instructional methods and many could easily be transitioned into a constructivist’s classroom. The ten instructional strategies they discussed include: (a) set induction, (b) stimulus variation, (c) reinforcement, (d) questioning, (e) recognizing attending behavior, (f) lecturing, (g) planned repetition, (h) establishing appropriate frames of reference, (i) closure and, (j) race, class, and gender equity. Lunenburg and Irby (2011) discussed these ten durable research based
instructional strategies designed to help educators improve their classroom performance as well as student learning.
Set induction is an instructional strategy that was previously termed “anticipatory set” by Hunter (1984). These two parallel instructional practices deal with building up student expectation and excitement for a lesson or assignment. The set induction and anticipatory set could be described as a sort of sneak peek into what is to follow in the class. These strategies, when executed properly can engage students to want to learn and elevate excitement in the lesson (Hunter, 1984; Lunenburg & Irby, 2011; Marzano & Brown, 2010). Aside from the teacher trying to excite the students with an immediate visual stimulation these practices could include simply providing the students with a more comprehensive overview or specific expectations for them. Among some of the more common and easily implemented forms of set induction could be using comparison, modeling desired outcome, authentic problem solving opportunities, using imagination and even stating science lessons with either a teacher led demonstration or student hands-on laboratory activity (Lunenburg & Irby, 2011).
All organisms respond to stimuli, as do students. Students have relatively low attention spans and a teacher’s use of various verbal and nonverbal stimuli can help curve the students’ inability to be attentive in class and lead to higher levels of attention and learning by students. A teacher who moves around the classroom throughout a lesson is more likely to keep students’ interest as compared to the teacher staying at a stationary point in the front of the room (Darling-Hammond et al., 2008; Exley & Dennick, 2010; Lewis, 2011).In addition to moving around the room as the lesson proceeds it is also recommended that teachers use various gesturing techniques to nonverbally engage with students involved in the lesson. Interaction styles can be mixed from time to time to keep students’ attention span active. Teachers can have interaction with individual groups, individual students or students can be involved in peer on peer activities. In any case the change from teacher led large group/whole class instruction can be powerful as a stimulus in instructional practices (Lunenburg & Irby, 2011). The mere act of a teacher asking students to focus on something in particular is a “wake up call” to become more attentive. Pausing as well as shift in tone or volume sends an alarming message to students to regain attention; these are all sorts of stimuli that can be easily implemented into any lesson under the sun to make them more powerful in classrooms (Hussin, 2010; Lewis, 2011).
Reinforcement is a way to agree with a student response, not a mere “correct” or “yes,” something to the effect of “that is exactly what I was looking for,” is more in tune with a positive reinforced comment a teacher can make (Lunenburg & Irby, 2011). The response of a student to a question can only be as good as the question itself. The use of questioning techniques is basic to good teaching. Generally speaking, questions can be classified into four broad categories: (a) initiating, (b) probing, (c) higher order, and (d) divergent (Hussin, 2010; Lewin, 2010). A teacher must ask a carefully constructed question to get higher order levels of answers as well as to generate greater creativity in student response. Initiating questions are fine to start off a discussion, but the synthesis level of mastery should include divergent questions to assess if students have fully comprehended the topic at hand (Hussin, 2010; Lewin, 2010; Lunenburg & Irby, 2011).
Lecturing, which many educators would say is dated and obsolete in contemporary classrooms can be divided into both formal and informal lectures. Formal lectures are less popular in contemporary classrooms than informal. Lectures can actually be an effective means by which a teacher delivers a large amount of information in a relatively quick manner (Exley & Dennick, 2010; Lewin, 2010). One of the most important components of a lecture, when considering its appropriateness for a class is the length in which it continues. Lectures should not persist the entire class period, the language/vocabulary should be on level with the students in the audience and there should be an opportunity for dialogue after the lecture is complete (Lewin, 2010; Lightweis, 2013). While lecture has become less common as a prolific instructional practice in secondary education and has been replaced or supplemented with differentiated instruction, many post-secondary instructors have little other than lecture in their applied instructional methods (Exley & Dennick, 2010; Lewin, 2010; Lightweis, 2013; Lunenburg & Irby, 2011).
Planned repetition is similar to an instructional practice termed spiraling, where a topic is brought back into class lessons on and off more than once. It can be an effective way to build on prior knowledge and concepts, to advance to the next level of a complex topic. Repetition can also be utilized as a review tool (Lunenburg & Irby, 2011). As mentioned earlier, set induction is a great way to start a lesson; and there is also an effective solid way to end a lesson, which is through closure in one form or another (Darling-Hammond et al., 2008; Marzano & Brown, 2010). A key product of closure is a checking for understanding as well as an opportunity to show a connection with the lesson
to previous material (Lunenburg & Irby, 2011; Marzano & Brown, 2010). Closure can be simply reviewing the key points of the lesson, asking a few pointed questions, issuing exit tickets, and countless other activities (Darling-Hammond et al., 2008; Lunenburg & Irby, 2011; Marzano & Brown, 2010).
The final strategy recommended by Lunenburg and Irby (2011) is to focus on equality in classrooms, in terms of race, class and gender. They argued that effective teachers have the trait of being empathetic for students from a variety of backgrounds. Any attempt to tie their learning content to something of their native culture is encouraged and seen as a meaningful bridge to lead to better student success (Lunenburg & Irby, 2011; Rodriguez-Valls, 2009). In an increasingly diverse classroom this can be seen as a means of inclusion.
A Constructivist Approach to Learning and Teaching
A constructivist approach to learning and instruction would include a good teacher-student relationship as a foundation (Marzano & Brown, 2010; Slavin, 2011; Tomlinson, 2005). This relationship encourages participation, trust, work ethic and a feeling or value (Marzano & Brown, 2010; Polka, 2002; Slavin, 2011). There are several activities teachers can do to implement a constructivist classroom in their practice of teaching. Polka (2002) shows an interesting and very practical way a teacher can foster the foundation for that relationship with students early in the academic term. Polka (2002) describes variations in developing a personal portfolio with students in the early days of the year and it can lend itself as an icebreaker activity to get to know the students’ personalities and well as for them to learn about their teacher. In addition to learning more about the student as a person these activities can foster a better understanding of the students’ background knowledge, goals, expectations and weaknesses, all of which can be valuable to the instructor (Marzano & Brown, 2010; Minott, 2010; Polka, 2002; Tomlinson, 2005).
The constructivist approach to learning includes a classroom transferred from the traditional teacher centered learning setting to a student centered environment (Ellis, 2004; Hunter, 1984; Polka, VanHusen, Young, & Minervnio, 2016). In these settings students are exposed to a totally different experience where they are more in control of the specific direction their learning navigates to. There are countless ways in which such practices can easily be tailored to fit into lessons (Ellis, 2004; Hunter, 1984; Lunenburg & Irby, 2011; Polka, 2002; Polka et al., 2016; Zollman, 2009). Project based learning is easily adapted and implemented in these classrooms.
In a contemporary classroom it is almost impossible not to rely upon technology in instructional delivery (Harasim, 2011; Knight, De Leon, & Smith, 1999). The ways in which technology may be integrated in classroom instruction, record keeping, and management are as numerous as the stars. Use of technology is another segue towards constructivist classrooms in action (Polka et al., 2016). Teacher reflecting on their practices in current lessons can help find ways for students to integrate technology into traditional lessons and make them more aligned with student centered learning (Gormley & McDermott, 2014; Harasim, 2011; Knight et al., 1999; Polka et al., 2016). Professional development, team meetings, group planning and other collaborative opportunities can help focus this reflection and help implement it into classrooms. The use of a constructivist approach to learning and teaching facilitates practices that get students more individual and interest oriented learning experiences (Harasim, 2011; Polka et al., 2016).
Differentiated Instruction and Universal Design for Learning
Differentiated instruction (DI) is commonly observed in a constructivist classroom. DI focuses on best practice, but it acknowledges the many variables that create the diversity in today’s classroom (Hanson & Ahron, 2008; Neville, 2010; Stanford, Crowe, & Flice, 2010). Differentiation occurs in many classrooms around the world. Teachers differentiate their lessons subconsciously without knowing they are doing it; effective teachers have been implementing this for generations (Polka et al., 2016; Stanford et al., 2010). When students are learning in a constructivist and DI learning environment they create their own understanding as they combine what they already believe to be true based on a blend of past encounters and newly attained information (Dewey, 1916; Marzano & Brown, 2010; Piaget, 1973; Rakes et al., 2006; Richardson, 1997).
Tomlinson (2005), one of the premier contemporary educational experts in differentiating instruction as well as a constructivist approach to teaching and learning, has described teaching and learning in a three part sequence: (a) content, (b) process and, (c) product. The “content” is the material intended for the student to learn; the instructional methods employed by the teacher are the “process” and the “product” is what the student actually learned from the lesson. Seminal works in constructivism in education were explained by Dewey (1916) and Piaget (1973) (as cited in Rakes et al., 2006).
Differentiated classrooms fit into a constructivist learning philosophy as seen by the student centered and student driven strategies. Using technology in lessons can be a prime way to make a classroom more differentiated (Gormley & McDermott, 2014; Stanford et al., 2010). On-task and engaged students involved in DI lessons can be expected to learn more than students involved in more traditional lessons (Shippen et al., 2011; Neville, 2010; Stanford et al., 2010; Zollman, 2009).
As with any type of DI activity it is always going to allow the students to focus on a particular area of interest; therefore the guide or rubric should include the overall objective but allow for some flexibility (Lightweis, 2013; Rakes et al., 2006). The design of cooperative groups is important to consider by the teacher; at times it might be a good practice to keep the strongest students in a single group to see where they venture, and keep struggling students together for the same reason (Lightweis, 2013; Rakes et al., 2006). This is an appropriate way to modify lessons to address special needs of students with learning disabilities or limited English proficiency (Rakes et al., 2006; Shippen et al., 2011; Stanford et al., 2010; Tomlinson, 2005). There are numerous ways in which various technological devices can be used to support learners working in cooperative groups; technology works as a resource to guide the problem-solving activity of the students (Rakes et al., 2006). Teachers can effectively differentiate through the use of cell phones, iPad, tablets, and other technological devices (Gormley & McDermott, 2014; Iding, Crosby, & Speitel, 2002).
It is important to note that the presence and use of technology in a classroom does not necessarily translate to effective differentiated instruction (Rakes et al., 2006). In spite of the apparent commitment to technology at some schools, it appears that many teachers use computers to support their current traditional teaching practices rather than as a tool to promote more innovative and constructivist practices (Rakes et al., 2006). In order for technology to positively affect teaching methodsand therefore student learning teachers must possess the technology-related skills needed to use technology and must actively use these tools in their classrooms (Iding et al., 2002; Rakes et al., 2006). That being said it is essential for teachers to be provided the appropriate professional development to learn how to use various classroom technology devices and also to have access to technical support to assist them in their use (Iding et al., 2002; Rakes et al., 2006).
Universal design for learning (UDL) is an emerging teaching philosophy that shares many common threads with both constructivism and DI. The main underlying trend in all three strategies is that the needs of the students should dictate the instructional delivery and strategies a teacher implements in a classroom; some would argue that UDL is a rebranding of DI that is essentially the same ideal (Rakes et al., 2006; Stanford & Reeves, 2009).
Methodological Framework of the Study
Many instructional strategies are perceived to be effective in the classrooms. Of these 13 instructional practices ten were discussed in the work of Lunenburg and Irby (2011) and three additional were selected because of their frequent appearance in current literature. The effectiveness of certain instructional strategies can be rated differently by K-12 classroom teachers. Since one of the major focuses of this study was to examine the rating variability and reliability of the instructional strategies in terms of their effectiveness in the classrooms, it was appropriate to use generalizability (G-) theory (Cronbach, Gleser, Nanda, & Rajaratnam, 1972) as a methodological framework.
G-theory is based on the framework of a factorial design and the analysis
of variance (Shavelson & Webb, 1991). More accurately, G-theory uses the analysis of variance (ANOVA) to partition the variation in scores into different sources and their interaction terms (Bloch & Norman, 2012; Shavelson & Webb, 1991).
G-theory extends the classical test theory decomposition of an observed
score into a true score and one error score component by allowing the observed score to be decomposed in a true score component (universe score) and multiple error components (Shavelson, Webb, & Rowley, 1989). Additionally, G-theory is an approach to estimating measurement dependability and it offers researchers the ability to assess both comprehensively and simultaneously, various sources of measurement error (Brennan, 2001; Shavelson & Webb, 1991). Therefore, G-theory was used as a methodological framework for this study.
Research Questions
The purpose of this study was to examine K-12 teacher perceptions about the instructional strategies in terms of the likelihood that they would
implement in their classroom teaching as well as the effectiveness of these instructional strategies in the classrooms. The following three specific questions guided this study: (a) How does the likelihood of implementing the instructional strategies and the effectiveness of these strategies differ between teachers at different types of schools (i.e., in good standing vs. not in good standing) and of different years of teaching experience (i.e., less than 10 years, 11-15 years, and over 15 years)? (b) How does the rating variability of the effectiveness of the instructional strategies differ between teachers at different types of schools and of different years of teaching experience? And (c) How does the rating reliability of the effectiveness of the instructional strategies differ between teachers at different types of schools and of different years of teaching experience?
As a result of this study it is intended that there will be a distinction as to the use of certain instructional practices in schools with high rates of proficiency and graduation rates versus schools not in good standing. Once such a distinction is established policy can guide the implementation of professional development to allow the employment of these strategies in chronically struggling schools. The interest in rater variation is aligned with interest as to whether or not teachers longer in the profession, who have permanent certification are adapting their pedagogy to infuse newer practices. In terms of policy implications, if this is the case that teachers that have permanent certification are not adapting to newer, proven effective strategies, perhaps their certifications should require them to continue with professional development, as newer teachers are required.
Methodology
Participants
A total of 73 participants completed the survey. They were K-12 teachers working at different schools in the Western New York area. Teachers were from a total of five schools, one suburban high school, one urban middle school, one urban high school, a maximum security detention center education program and an inner city 5-12 honors school. All of them were teaching traditional courses such as math, language arts, science, history, and foreign languages. They were from both schools in good standing and schools not in good standing. They varied in number of years of teaching experience in a K-12 setting. The schools used for this study were schools that one of the
researchers currently or formerly worked at, the principal/administrator of each granted permission for the teachers to voluntarily and confidentially participate in.
Instrument
The instrument contained four items. The first two items asked about the type of schools (i.e., schools in good standing vs. schools not in good standing) where the participants worked as well as their number of years of teaching experience in K-12 schools. The third item asked about the likelihood (i.e., 1 very unlikely and 5 very likely) they would implement the pre-selected 13 instructional strategies (e.g., graphic organizers, planned repetition, group work, differentiated instruction, etc.) in their classrooms. Ten of the instructional strategies were identified and discussed by Lunenburg and Irby (2011). Additionally, three educational philosophies, i.e., constructivism, differentiated instruction, and universal design of learning were included. The last item asked the participants to rank the same pre-identified 13 instructional strategies in terms of the effectiveness (i.e., 1 very ineffective and 5 very effective) in the classrooms.
Data Collection and Analysis
IRB approvals were obtained through both the university and the school district/schools. Data were collected through Survey Monkey. The data collected by Survey Monkey were saved and available for statistical analysis.
In order to answer the first research question, data were analyzed at different levels. Using SPSS descriptive statistical analysis (the mean and standard deviation) was performed first; followed by the inferential statistical analyses; i.e., independent samples t-tests for the independent variable of the type of schools; one-way ANOVAs for the independent variable of year of experience; and 3 x 2 (year of teaching experience-by-school type) factorial ANOVAs. The independent samples t-tests and one-way ANOVAs were conducted to compare the means and standard deviations and further determine if there were any significant differences in the responses to the items on the survey. The purpose of factorial ANOVAs was to examine the main effects (i.e., the type of schools and year of teaching experience) as well as the interaction effect between the years of teaching experience and the type of schools). As shown in the data set, there were two types of schools, namely, schools in good standing and schools not in good standing; there were three groups in terms of the number of years of teaching experience: less than 10 years, 10-15 years, and over 15 years.
In order to answer the second and third research questions, using the
G-theory framework data were further analyzed in the following two stages.
First, instructional strategy-by-rater random effects G-studies were conducted for each rater group across the type of schools and the year of teaching experience, respectively. The reason for the random effects deign was to ensure that the findings can be more generalizable. The purpose of these
G-studies was to obtain variance component estimates for the following three
sources of variation of each G-study: instructional strategy, rater, and strategy-by-rater. The information obtained from the above G-studies was used to compare the raters’ rating variability in terms of the effectiveness of the instructional strategies across the type of schools and years of teaching experience. In other words, these G-studies were conducted to answer the second research questions, namely, how did the ranking variability of the effectiveness of the instructional strategies differ between teachers of different years of teaching experience and at different types of schools? Putting the current study in a norm-referenced score interpretation context would mean that each instructional strategy effectiveness score is interpreted relative to the effectives scores of all other instructional strategies. Therefore, a difference among rater groups was expected.
Second, using the variance components of each of the above G-studies, i.e., the variance components of instructional strategy, rater, and strategy-by- rater, the G-coefficients for all rater groups were calculated. A G-coefficient is a reliability coefficient, which is the ratio of the universe score variance to itself plus relative error variance ( 2 2/ ( 2 2)
). Using this formula,
the G-coefficients for all rater groups were calculated to answer the third research question, namely, how did the rating reliability of the effectiveness of the instructional strategies differ between teachers of different years of teaching experience and at different types of schools?
Computer Programs
Microsoft EXCEL was used for data preparation. Further, SPSS was used to conduct both descriptive and inferential (i.e., independent samples t-tests, one-way ANOVAs, and factorial ANOVAs) statistical analyses. SPSS is a popular data-analysis program used by researchers in social sciences. SPSS can be used for manipulating data, analyzing data, and generating graphs and tables.
In addition, the computer program GENOVA (Crick & Brennan, 1983) was used for the G-theory analyses of the data. GENOVA is a computer program used to estimate the variance components for the main and interaction effects as well as their standard errors using the formulas provided above and where the design is balanced.
Results
The following results are reported in this section: (a) demographic characteristics of the participants; (b) reliability of the survey; (c) descriptive and inferential statistical results; and (d) G-theory analyses results.
Demographic Characteristics of the Participants
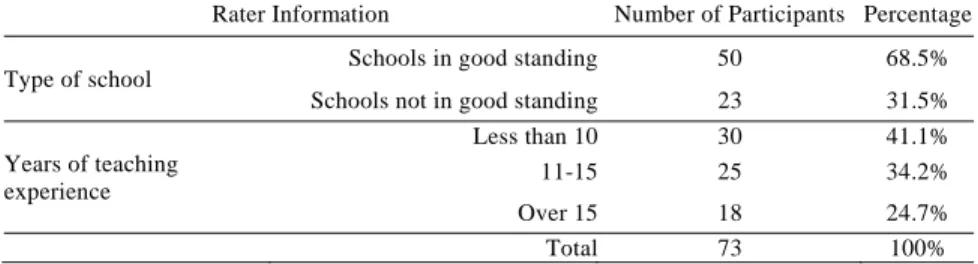
Table 1 presents a summary of demographic characteristics of the 73 participants. As shown in Table 1, among the 73 participants 50 were working at schools in good standing (68.5%) and 23 were at schools not in good standing (31.5%). Thirty of them had less than ten years of teaching experience (41.1%), 25 of them had 11 to 15 years of teaching experience (34.2%), and 18 of them had over 15 years of teaching experience (24.7%).
Reliability of the Survey
The original survey required the participants to give a rating on each of the 13 instructional strategies in terms of the likelihood (i.e., 1 very unlikely and 5 very likely) they would implement in their classrooms and the effectiveness (i.e., 1 very ineffective and 5 very effective) of each instructional strategy in the classroom. The entire survey has been shown to be
Table 1
A Summary of the Participants
Rater Information Number of Participants Percentage
Type of school Schools in good standing 50 68.5%
Schools not in good standing 23 31.5%
Years of teaching experience Less than 10 30 41.1% 11-15 25 34.2% Over 15 18 24.7% Total 73 100%
reliable, with Cronbach’s alpha (i.e., internal consistency reliability) coefficients of .89. The likelihood section of the survey has also been shown to be reliable, with alpha reliability coefficients of .88 for the 13 instructional strategies. The effectiveness section of the survey has been shown to be reliable as well, with alpha reliability coefficients of .84 for the 13 instructional strategies.
Descriptive Results
All 73 participants rated the likelihood (i.e., 1 very unlikely and 5 very likely) they would implement the 13 instructional strategies in their classrooms as well as the effectiveness (i.e., 1 very ineffective and 5 very effective) of the same instructional strategies in the classrooms. Table 2 provides the descriptive statistical results (i.e., the mean and standard deviation). For each instructional strategy the descriptive statistical results are summarized below.
The results shown in Table 2 indicate that the 73 participants rated the 13 instructional strategies in terms of the likelihood they would implement them in their classroom practices in the following order: (a) Reinforcement (m 4.77; sd .61); (b) Questioning (m 4.67; sd .65); (c) Stimulus variation (m 4.66; sd .67); (d) Set induction/anticipatory set (m 4.62; sd .72); (e)
Planned repetition (m 4.62; sd .68); (f) Closure (m 4.38; sd .81); (g) Group work (m 4.25; sd .97); (h) Differentiated instruction (m 4.14; sd .87); (i) Graphic organizers (m 4.12; sd .99); (j) Lecturing (m 4.11; sd .81), (k) Constructivist activities (m 4.03; sd .83), (l) Race, gender, and class inclusion (m 3.88; sd 1.03), and (m) Student directed learning
(m 3.75; sd 1.04).
The results shown in Table 2 also indicate that the 73 participants rated the 13 instructional strategies in terms of the effectiveness in the classrooms in the following order: (a) Reinforcement (m 4.59; sd .57); (b) Stimulus
variation (m 4.47; sd .58); (c) Questioning (m 4.47; sd .69); (d) Planned repetition (m 4.42; sd .69); (e) Set induction/anticipatory set (m
4.41; sd .62); (f) Closure (m 4.40; sd .66); (g) Graphic organizers (m 4.32; sd .94); (h) Differentiated instruction (m 4.22; sd .75); (i) Group
work (m 4.19; sd .74); (j) Lecturing (m 4.01; sd .68); (k) Constructivist activities (m 4.00; sd .83); (l) Student directed learning (m 3.96; sd
Table 2
Descriptive Statistics of 13 Instructional Strategies
Instructional Strategy N Mean Standard Deviation
Likelihood of implementation
Set induction/anticipatory set 73 4.62 .72
Stimulus variation 73 4.66 .67
Reinforcement 73 4.77 .61
Questioning 73 4.67 .65
Planned repetition 73 4.62 .68
Closure 73 4.38 .81
Race, gender and class inclusion 73 3.88 1.03
Graphic organizers 73 4.12 .99
Constructivist activities 73 4.03 .83 Differentiated instruction 73 4.14 .87
Group work 73 4.25 .97
Student directed learning 73 3.75 1.04
Lecturing 73 4.11 .81
Effectiveness in teaching
Set induction/anticipatory set 73 4.41 .62
Stimulus variation 73 4.47 .58
Reinforcement 73 4.59 .57
Questioning 73 4.47 .69
Planned repetition 73 4.42 .69
Closure 73 4.40 .66
Race, gender and class inclusion 73 3.74 1.11
Graphic organizers 73 4.32 .94
Constructivist activities 73 4.00 .83 Differentiated instruction 73 4.22 .75
Group work 73 4.19 .74
Student directed learning 73 3.96 .96
Lecturing 73 4.01 .68
Independent Samples t-Tests Results
The independent samples t-tests were conducted to compare the mean differences for the instructional strategies as rated by the 73 participants at different types of schools (i.e., schools in good standing vs. schools not in good standing). The significant results are presented in Table 3.
As shown in Table 3, among the 13 instructional strategies only ‘lecturing’ received significant higher likelihood scores from the participants at schools in good standing (m 4.28) than the participants at schools not in good standing (m 3.74) (p .05). However, the instructional strategy ‘stimulus variation’ received significant higher effectiveness scores from the participants at schools not in good standing (m 4.65) than the participants at schools in good standing (m 4.38) (p .05). Similarly, the instructional strategy ‘reinforcement’ received significant higher effectiveness scores from the participants at schools not in good standing (m 4.78) than the participants at schools in good standing (m 4.50) (p .05).
Table 3
Significant Independent Samples t-Tests Results for Participants at Different Types of Schools
Strategy Group N Mean Df t Sig.
Likelihood Lecturing A 50 4.28 71 2.774 .007 B 23 3.74 Effectiveness Stimulus variation A 50 4.38 71 1.898 .045 B 23 4.65 Reinforcement A 50 4.50 61 2.286 .026 B 23 4.78
Note. A Schools in good standing; B Schools not in good standing.
One-way ANOVA Results for Years of Teaching Experience
For the independent variable of years of teaching experience one-way ANOVAs were conducted to examine the significant mean differences for the instructional strategies as rated by the 73 participants of different years of teaching experience (i.e., less than 10, 11-15, and over 15). For significant ANOVAs, Bonferroni post hoc multiple comparisons were performed to examine exact group differences. The significant results are presented in Table 4.
As shown in Table 4, the independent variable of years of teaching experience was found to have significant effects on two instructional strategies, i.e., closure and constructivist activities. For instructional strategy ‘closure’ teachers of less than 10 years of teaching experience (m 4.67) had a significantly higherratingthanteachersof11-15(m 4.20)and over15(m 4.22)years of
Table 4
One-way ANOVA and Post Hoc Results for Independent Variable of Years of Teaching Experience
Bonferroni Multiple Comparison
Item Source N F p
Significantly
Different Groups Mean Effectiveness of Closure Less than 10 30 4.664 .013 Less than 10 & 11-15 4.67
11-15 25 4.20
Over 15 18 Less than 10 & over
15 4.22
Effectiveness of
Constructivist Activities Less than 10 30 3.012 .042
Less than 10 & over
15 4.20
11-15 25 4.04
teaching experience, respectively (p .05). Similarly, for instructional strategy ‘constructivist activities’ teachers of less than 10 years of teaching experience (m 4.20) had a significantly higher rating than teachers of 11-15 (m 4.04) and over 15 (m 3.61) years of teaching experience, respectively (p .05).
G-theory Analyses Results
The following section presents the G-analyses results. Specifically, for both variables (i.e., the type of schools and years of teaching experience) the results of the instructional activity-by-rater random effects G-studies for each rater group across the type of schools and years of teaching experience were presented, followed by the G-coefficients for all rater groups.
G-theory Results for Type of Schools
The instructional strategy-by-rater (s x r) random effects G-studies for raters from both schools in good standing and schools not in good standing for the effectiveness of instructional strategies yielded the following variance components for each rater group: strategy (s), rater (r), and strategy-by-rater (sr). Table 5 presents the results for these two G-studies.
As shown in Table 5, the results for teachers at schools in good standing show that the residual yielded the largest variance (62.87% of the total variance). The residual contains the variability due to the interaction between raters and instructional strategies, and other unexplained systematic and unsystematic sources of error. Rater (r) yielded the second largest variance component (32.42% of the total variance), suggesting that the teachers at schools in good standing differed greatly from one another in terms of rating consistency. Instructional strategies (s), the object of measurement yielded the third largest variance component (4.71% of the total variance), suggesting that the 13 instructional strategies are not very different in terms of their effectiveness in the classrooms.
Table 5
Variance Components for Random Effects s x r G-studies for Effectiveness of Instructional Strategies for Type of Schools
Type of School Source of Variability Df 2 %
Schools in good standing s 12 0.0218 0.0471 r 22 0.1500 0.3242 sr 264 0.2909 0.6287 Total 298 0.4627 100
Schools not in good standing
s 12 0.098 0.1332
r 22 0.1233 0.1675
sr 264 0.5146 0.6993
Total 298 0.7359 100
The results for teachers at schools not in good standing are considerably different. The residual yielded the largest variance (69.93% of the total variance). Rater (r) yielded the second largest variance component (16.75% of the total variance). Instructional strategies (s), the object of measurement yielded the third largest variance component (13.32% of the total variance).
G-theory Results for Year of Teaching Experience
The instructional strategy-by-rater (s x r) random effects G-studies for raters from different years of teaching groups (i.e., less than 10, 11-15, and over 15) for the effectiveness of instructional strategies yielded the following variance components for each rater group: strategy (s), rater (r), and strategy- by-rater (sr). Table 6 presents the results for these three G-studies.
As shown in Table 6, the results for teachers of less than 10 years of teaching experience show that the residual yielded the largest variance (57.19% of the total variance). The residual contains the variability due to the interaction between raters and instructional strategies, and other unexplained systematic and unsystematic sources of error. Rater (r) yielded the second largest variance component (36.23% of the total variance), suggesting that the raters of less than 10 years of teaching experience differed considerably from one another in terms of rating consistency. Instructional strategy (s), the object of measurement yielded the third largest variance component (6.58% of the total variance), suggesting that the 13 instructional strategies are slightly different in terms of their effectiveness in the classrooms.
The results for teachers of 11-15 years of teaching experience show that the residual yielded the largest variance (76.12% of the total variance). Rater (r) yielded the second largest variance component (14.68% of the total variance). Instructional strategy (s) yielded the third largest variance component (9.20% of the total variance).
Table 6
Variance Components for Random Effects s x r G-studies for Effectiveness of Instructional Strategies for Years of Teaching Experience
Year of Teaching Source of Variability Df 2 %
Less than 10 s 12 0.038 0.0658 r 17 0.2092 0.3623 sr 204 0.3303 0.5719 Total 233 0.5775 100 11-15 s 12 0.045 0.0920 r 17 0.0718 0.1468 sr 204 0.3724 0.7612 Total 233 0.4892 100 Over 15 s 12 0.0603 0.0711 r 17 0.1931 0.2278 sr 204 0.5943 0.7011 Total 233 0.8477 100
The results for teachers of over 15 years of teaching experience show that the residual yielded the largest variance (70.11% of the total variance). Rater (r) yielded the second largest variance component (22.78% of the total variance). Instructional strategy (s) yielded the third largest variance component (7.11% of the total variance).
The Calculation of G-coefficients for All Rater Groups
Using the formula 2 2/ ( , the G-coefficients for all rater 2 2) groups were calculated to compare the rating reliability of the effectiveness of the instructional strategies between teachers at different types of schools and of different years of teaching experience. The results are presented in Table 7.
As shown in Table 7, the G-coefficient obtained for participants at schools in good standing for the current 23-rater scenario was .63, whereas the
G-coefficient for participants at schools not in good standing was .81. Comparing the reliability of teachers at schools in good standing to teachers at schools not in good standing reveals a much larger difference in terms of reliability. Further research is needed to examine what exactly caused this difference.
Table 7
Summary of G-coefficients for Different Rater Groups
Rater Groups Number
of Strategies
Number of Raters
G-
coefficients
Type of Schools Schools in good standing 13 23 .63
Schools not in good standing 13 23 .81
Years of Teaching
Less than 10 years 13 18 .67
11-15 years 13 18 .68
Over 15 years 13 18 .65
Also as shown in Table 7, the G-coefficients obtained for participants of less than 10 years, 11-15, and over 15 years of teaching experience for the current 18-rater scenario were .67, .68, and .65, respectively. Comparing the reliability of teachers of different years of teaching experience reveals little difference in terms of reliability.
Discussion and Conclusions
Discussion of Major Findings
The results of this study provide insight as to the teaching strategies that are used by teachers in various performing schools and teachers of different experience levels. It also allows for interpretation as to the perceived effectiveness of these same instructional practices. Through the entire sample of 73 respondents the perceived most effective teaching strategies included reinforcement, stimulus variation, and questioning. Similarly, these three teaching strategies have also been identified as the most likely to be implemented in the classrooms of the respondent teachers. The fact that these three instructional strategies align similarly in terms of their perceived effectiveness and likelihood of implementation supports the validity of the study determined with mathematical calculations. The G-theory statistical analysis gave insight as to the variation as to how teachers rated the perceived effectiveness of each instructional practice and likelihood of its implementation.
One item of particular interest is the fact that lecturing was identified by teachers in schools in good standing as an instructional practice likely to be utilized in class significantly more likely than schools not in good standing. Many recent studies point towards lecturing as ineffective or as a dated instructional practice. Schools not in good standing showed a significantly higher likelihood of using reinforcement and stimulus variation in their classrooms.
Within schools in good standing the teachers who responded showed less variability in their interpretation of how effective the 13 teaching strategies function in their experience. Teachers who have less than ten years of teaching experience have a significantly higher variance in rating the instructional strategies in terms of their effectiveness. Schools not in good standing also yielded a higher variance in their interpretation of effective teaching strategies.
Newer teachers with less than ten years of experience were observed to put more significance on the inclusion of closure in an activity when compared to the other two experience groups. These same newer to the profession teachers also had a significantly higher impression of constructivism. This could be due to the fact that these practices were not as common in teacher education programs decades ago, or termed something differently at least. Within each group as the number of years of experience increased the familiarity with constructivism decreased.
The ultimate goal of this study was to try and identify an instructional practice that was being employed by teachers at highly effective schools and bring a recommendation for using the same strategy to schools which are failing. There has not been an instructional practice that can be identified by this study to be the magic bullet per say. That being said additional research could be done to attempt to identify a variable that can assist struggling schools improve their performance with their students.
Limitations
The first limitation of this study was its relatively small sample size, i.e., 73 participants in total. An additional limitation would be that all of the teacher respondents are from a relatively small geographic area, i.e., western New York. For a more comprehensive analysis, the demographics of the sample should be greatly broadened in terms of size and geographic area of study. Related to the demographics of the sample is also the concern that there was a higher concentration of teacher participants from schools in good standing. The overall sample also included relatively few teachers with more than 15 years of service.
Another limitation associated with the instrument itself is the use of some ambiguous terms. This was intentionally done because through the past decades at various times a single teaching strategy or educational philosophy has had multiple names. This was considered due to the fact that some educators who responded may have had only a few years of teaching experience, while others may have had decades.
Conclusions
It is concluded that there is not a single effective strategy for the teachers to use in their practice of teaching. Within both schools in good standing and those not in good standing there is variation in perceived effectiveness of strategies and also variation in the likelihood of use of these strategies. A practice that works for one teacher in one subject in one school may not generate similar results in another teacher’s classroom.
Through the entire sample the use of reinforcement, stimulus variation, and questioning has been observed to be both perceived effective and likely used in both school types. These teaching strategies can be applied to all content areas and age levels of students which could be why they have been identified as the most effective and likely to be used by the participants.
With this being the case, where there has not been a significant statistical presence of one or more strategies being used in schools in good standing that is absent in chronically struggling schools no recommendation for implementation can be made from this study concretely.
Policy Implications
As a result of this study it is apparent that there are some instructional practices that are more familiar with newer to the profession teachers, those with ten or fewer years of professional service. Currently, the state of New York has multiple teaching certifications that a teacher can possess. Permanent certification, no longer still available, but senior teachers with about ten to fifteen years of experience can still hold does not require teachers to continue with professional development to maintain their teaching certifications. More recently certified teachers are granted professional certification. These after mentioned certified teachers need to complete 175 hours of professional development within five years and continue this to maintain their professional certification. In general more professional development for all types of teaching certification is an excellent way to make learning more applicable in an ever changing world.
The results of this study indicate that teachers who have been in the profession longer, those with permanent certification are less familiar with the most contemporary teaching strategies identified on the instrument. This gives rise for a need to perhaps alter their certification and mandate that these teachers maintain professional development as do newer teachers with professional and provisional teaching certification.
It is suggested that the State Education Department increases funding to schools which are not in good standing to allow for more resources to assist with the diversified needs of their high concentration of vulnerable student population. These vulnerable populations include students with learning disabilities, students who are living below the poverty line, and those who have a native language other than English.
Directions for Future Research
Future research in educational practices can focus on further identifying instructional practices and other support systems that are in place in schools that excel and then attempt to mimic these practices and systems in schools that chronically struggle with student performance. Likewise, more focus can be pointed towards the variability of school type and specific demographics of the school and that school (type) response to teaching practices. Additional time should be afforded to attempt to identify other variables and factors that are likely to affect students’ performance between different school types.
References
Bloch, R., & Norman, G. (2012). Generalizability theory for the perplexed: A practical introduction and guide: AMEE Guide No. 68. Medical Teacher, 34(11), 960-992. doi:10.3109/0142159X.2012.703791
Brennan, R. L. (2001). Generalizability theory: Statistics for social science and public
policy. New York, NY: Springer Verlag.
Cobb, R. B., Abate, S., & Baker, D. (1999). Effects on students of a 4 4 junior high school block scheduling program. Education Policy Analysis Archives, 7(3), 1-23.
Crick, J. E., & Brennan, R. L. (1983). GENOVA: A general purpose analysis of
variance system. Version 2.1. Iowa City, IA: American College Testing Program.
Cronbach, L. J., Gleser, G. C., Nanda, H., & Rajaratnam, N. (1972). The dependability
of behavioral measurements: Theory of generalizability for scores and profiles.
New York, NY: Wiley.
Darling-Hammond, L., Barron, B., Pearson, P. D., Schoenfeld, A. H., Stage, E. K., Zimmerman, T. D., …Chen, M. (2008). Powerful learning: What we know about
teaching for understanding. New York, NY: Wiley.
Dewey, J. (1916). Democracy and education: An introduction to the philosophy of
education. New York, NY: Free Press.
Ellis, E. (2004). What’s the big deal about graphic organizers? Retrieved from https://mcsold1.monet.k12.ca.us/Academics/el712/Graphic%20Organizers/Q%20 and%20A%20about%20G%20O.pdf
Exley, K., & Dennick, R. (2010). Giving a lecture: From presenting to teaching. New York, NY: Routledge.
Fletcher, R. K. (1997). A study of the block scheduling movement in six high schools in
the Upper Cumberland region of Tennessee. Paper presented at the Annual
Meeting of the Tennessee Academy of Sciences, Sewanee, TN.
Gormley, K., & McDermott, P. (2014). Differentiating literacy instruction--There’s an app for that. The Language and Literacy Spectrum, 24, 49-75.
Hamdy, M., & Urich, T. (1998). Perceptions of teachers in South Florida toward block scheduling. NASSP Bulletin, 82(596), 79-82.
Hanson, J., & Ahorn, A. (2008). Differentiated instruction and understanding by
design. Retrieved from
http://design.test.olt.ubc.ca/Differentiated_Instruction_and_Understanding_by_Design Harasim, L. (2011). Learning theory: Design and educational technology. New York,
NY: Routledge.
Hunter, M. (1984). Mastery teaching (4th ed.). Needham Heights, MA: Allyn & Bacon.
Hussin, H. (2010). Dimensions of questioning in the classroom: Teachers’ questioning
Iding, M., Crosby, M. E., & Speitel, T. (2002). Teachers and technology: Beliefs and practices. International Journal of Instructional Media, 29(2), 153-171.
Knight, S. L., De Leon, N. J., & Smith, R. G. (1999). Using multiple data sources to evaluate an alternative scheduling model. The High School Journal, 83(1), 1-13. Lewin, L. (2010). Teaching comprehension with questioning strategies that motivate
middle school readers. New York, NY: Scholastic.
Lewis, A. (2011). The art of lecturing. New York, NY: B & R Samizdat Express. Lightweis, S. K. (2013). College success: A fresh look at differentiated instruction and
other student-centered strategies. College Quarterly, 16(3), 72-81.
Lunenburg, F. C., & Irby, B. J. (2011). Instructional strategies to facilitate learning.
International Journal of Educational Leadership Preparation, 6(4), 1-12.
Maltese, A. V., Dexter, K. M., Tai, R. H., & Sadler, P. M. (2007). Breaking from tradition: Unfulfilled promises of block scheduling in science. Science Educator,
16(1), 1-7.
Marzano, R. J., & Brown, J. L. (2010). A handbook on the art and science of teaching. Alexandria, VA: Association of Supervision and Curriculum Development. Minott, M. A. (2010). Portfolio development, reflection, personal instructional theory
and the scholarship of teaching and learning. College Quarterly, 13(2), 21-27. Neville, E. (2010). Utilizing a school-university collaborative partnership to design,
present and support pre-K-12 coursework on differentiated instruction. School-
University Partnership, 4(2), 92-95.
NYSED. (2016). Office of teaching initiatives/teacher certification. Retrieved from New York State Education Department website: http://www.nysed.gov/
Piaget, J. (1973). To understand is to invent: The future of education. New York, NY: Grossman.
Polka, W. S. (2002). Designing and implementing personal course portfolios: A practical strategy to initiate, develop and personalize effective classroom interactions and implement constructivist’s principles. Educational Planning,
14(1), 13-20.
Polka, W. S., VanHusen, M. J., Young, W. M., & Minervino, K. J. (2016). Facilitating greater instructional differentiation via research-based teacher reflection and site-based procedural guidelines. Educational Researcher: Theory & Practice,
28(1), 37-52.
Rakes, G. C., Fields, V. S., & Cox, K. E. (2006). The influence of teachers’ technology use on instructional practices. Journal of Research on Technology in Education,
36(4), 411-426.
Richardson, V. (Ed.). (1997). Constructivist teacher education: Building a world of
new understandings. Washington, DC: Falmer Press.
Rodriguez-Valls, F. (2009). Culturally relevant poetry: Creating esperanza (hope) with stanzas. Multicultural Education, 17(1), 11-14.
Shavelson, R. J., & Webb, N. M. (1991). Generalizability theory: A primer. Newbury Park, CA: Sage.
Shavelson, R. J., Webb, N. M., & Rowley, G. L. (1989). Generalizability theory.
American Psychologist, 44(6), 922-932.
Shippen, M. E., Flores, M. M., Crites, S. A., Patterson, D., Ramsey, M., Houchins, D. E., & Jolivette, K. (2011). Classroom structure and teacher efficacy in serving students with disabilities: Differences in elementary and secondary teachers.
International Journal of Special Education, 26(3), 36-44.
Slavin, R. E. (2011). Educational psychology: Theory and practice. Boston, MA: Allyn & Bacon.
Stanford, B., & Reeves, S. (2009). Making it happen: Using differentiated instruction, retrofit framework, and universal design for learning. Teaching Exceptional
Children Plus, 5(6), 2-9.
Stanford, P., Crowe, M. W., & Flice, H. (2010). Differentiating with technology.
Teaching Exceptional Children Plus, 6(4), 2-9.
Tomlinson, C. A. (2005). The differentiated classroom: Responding to the needs of all
learners. Upper Saddle, NJ: Merrill Prentice Hall/ASCD.
Zollman, A. (2009). Students use graphic organizers to improve mathematical problem-solving communications. Middle School Journal, 41(2), 4-12.