Profitability of
Value-Based Investing
Strategies in Taiwan’s
Stock Market
February 24, 2015
Sponsored by:Value Partners Center for
Investing
2 | 7 P a g e s
Profitability of Value-Based Investing Strategies
in Taiwan’s Stock Market
Introduction
This newsletter investigates the performance of five strategies for investing in stocks in the Taiwan stock market in the past 20 years. We find that four of these value-based strategies significantly outperformed the aggregate stock market and brought huge positive returns in the period from January 1991 to December 2013.
Data Sample and Portfolio Construction
We download the daily total return index and the market value of each stock and of the aggregate Taiwan stock market from Datastream. We also retrieve book value, earnings, cash flow, debt, and dividend from Thomson Reuter’s Worldscope. All exchange-traded funds (ETFs) and warrants are removed from our data sample, as are the bottom one-third of stocks each month to exclude penny stocks. The sample period of our analysis is from January 1991 to December 2013. A stock’s value measures are its book-to-market (B/M) ratio, dividend yield (DY), earnings-to-price (E/P) ratio, cash flow-earnings-to-price ratio (OCF), and leverage-earnings-to-price ratio (LP).
All stocks are sorted into five portfolios based on these five value measures at the end of each month. We then construct the equal-weighted one-month future returns of each portfolio which is the simple average of the returns of all stocks in the portfolio. We also construct the value-weighted returns of each portfolio by weighting each stock’s returns based on its market capitalization. The five sorted portfolios are rebalanced monthly.
The Performance of Value-Based Investing Strategies
We find that the equal-weighted portfolios with the highest P/B ratio, dividend yield, E/P ratio, and cash flow-to-price ratio generated returns of 2.2%, 2.61%, 1.96%, and 3.42% respectively as shown in Table 1. The value-weighted portfolios with the highest P/B ratio, dividend yield, E/P ratio, and cash flow-to-price ratio also brought returns of 2.07%, 1.72%, 1.25% and 2.66% respectively. We also find that the equal- and value-weighted portfolios with the highest P/B ratio, dividend yield, E/P ratio, and cash flow-to-price ratio significantly outperformed stocks with the lowest values of these measures. The equal-weighted zero-cost portfolios that long the stocks with the highest values of these measures (5) and short the stocks with the lowest values of these measures (1) offered returns of 1.53%, 2.88%, 1.32%, and 4.17% as well as market-adjusted excess returns (alpha) of 1.51%, 2.91%, 1.40%, and 4.19% in CAPM per month, respectively. The value-weighted portfolios based on these four value measures achieved slightly lower returns and market-adjusted excess returns over the same period. The equal- and value-weighted portfolios with the lowest leverage-to-price ratio generated 1.54% and 1.35% per month. However, the zero-cost portfolio based on the leverage-to-price ratio failed to generate significant returns or alphas.
3 | 7 P a g e s
Table 1: Returns of Value-Based Investing Strategies
Portfolio Book to Market Dividend Yield Earnings to Price Cash Flow to Price Leverage to Price ew_ret vw_ret ew_ret vw_ret ew_ret vw_ret ew_ret vw_ret ew_ret vw_ret 1 0.80% 1.13% 0.53% 0.30% -0.31% -0.48% -0.87% -1.13% 1.54% 1.35% (1.33) (1.86) (0.83) (0.47) (-0.46) (-0.71) (-1.48) (-1.98) (2.83) (2.54) 2 0.86% 0.74% 1.50% 1.42% 0.65% 0.88% 0.48% 0.60% 1.26% 1.11% (1.45) (1.28) (2.29) (2.12) (1.09) (1.45) (0.75) (0.95) (2.18) (1.90) 3 0.98% 1.05% 1.05% 0.80% 0.91% 0.71% 0.59% 0.48% 0.87% 0.83% (1.72) (1.90) (1.92) (1.49) (1.62) (1.28) (1.02) (0.85) (1.44) (1.43) 4 1.04% 1.03% 1.08% 1.00% 1.63% 1.45% 1.92% 1.43% 1.17% 1.04% (1.84) (1.84) (1.98) (1.86) (2.90) (2.66) (3.56) (2.75) (2.00) (1.76) 5 2.20% 2.07% 1.96% 1.25% 2.61% 1.72% 3.42% 2.66% 1.06% 1.03% (3.28) (3.10) (3.56) (2.45) (4.46) (3.10) (6.27) (5.09) (1.64) (1.60) 5-1 1.53% 1.06% 1.32% 0.82% 2.88% 2.14% 4.17% 3.63% -0.24% -0.07% (2.88) (1.97) (3.75) (1.98) (6.85) (4.57) (13.11) (10.25) (-0.54) (-0.15) Alpha 1.51% 1.09% 1.40% 0.94% 2.91% 2.21% 4.19% 3.66% -0.32% -0.22% (2.83) (2.00) (4.14) (2.46) (6.95) (4.80) (13.19) (10.30) (-0.74) (-0.48) Note: Adjusted t-statistics are in parentheses
Superior Performance against Taiwan’s Stock Market
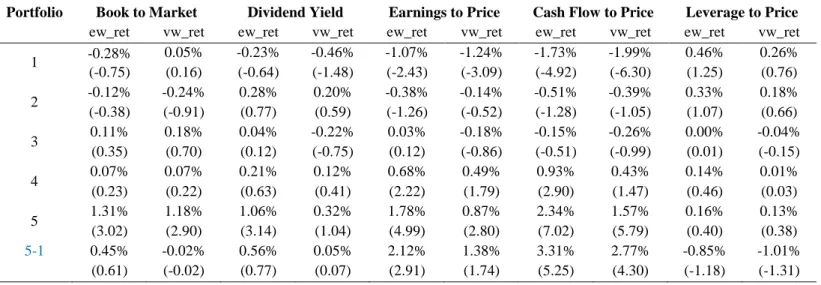
We now investigate how the five value investing strategies performed against Taiwan’s aggregate stock market. We subtract the total stock market return (including dividend) from the equal- and value-weighted returns of each portfolio to obtain its excess returns. As reported in Table 2, we find that the equal-weighted portfolios with the highest P/B ratio, E/P ratio, dividend yield, and cash flow-to-price ratio significantly outperformed the aggregate stock market by 1.31%, 1.18%, 1.78%, and 2.34% per month in this period, respectively. The corresponding value-weighted portfolios also significantly outperformed the aggregate stock market. However, the portfolios based on the leverage-to-price ratio did not outperform the aggregate stock market in the same period. On the other hand, only the zero-cost (5-1) portfolios based on the E/P ratio and cash flow-to-price ratio significantly outperformed the aggregate stock market in Taiwan.
Table 2: Excess Returns of Value-Based Investing Strategies
Portfolio Book to Market Dividend Yield Earnings to Price Cash Flow to Price Leverage to Price ew_ret vw_ret ew_ret vw_ret ew_ret vw_ret ew_ret vw_ret ew_ret vw_ret 1 -0.28% 0.05% -0.23% -0.46% -1.07% -1.24% -1.73% -1.99% 0.46% 0.26% (-0.75) (0.16) (-0.64) (-1.48) (-2.43) (-3.09) (-4.92) (-6.30) (1.25) (0.76) 2 -0.12% -0.24% 0.28% 0.20% -0.38% -0.14% -0.51% -0.39% 0.33% 0.18% (-0.38) (-0.91) (0.77) (0.59) (-1.26) (-0.52) (-1.28) (-1.05) (1.07) (0.66) 3 0.11% 0.18% 0.04% -0.22% 0.03% -0.18% -0.15% -0.26% 0.00% -0.04% (0.35) (0.70) (0.12) (-0.75) (0.12) (-0.86) (-0.51) (-0.99) (0.01) (-0.15) 4 0.07% 0.07% 0.21% 0.12% 0.68% 0.49% 0.93% 0.43% 0.14% 0.01% (0.23) (0.22) (0.63) (0.41) (2.22) (1.79) (2.90) (1.47) (0.46) (0.03) 5 1.31% 1.18% 1.06% 0.32% 1.78% 0.87% 2.34% 1.57% 0.16% 0.13% (3.02) (2.90) (3.14) (1.04) (4.99) (2.80) (7.02) (5.79) (0.40) (0.38) 5-1 0.45% -0.02% 0.56% 0.05% 2.12% 1.38% 3.31% 2.77% -0.85% -1.01% (0.61) (-0.02) (0.77) (0.07) (2.91) (1.74) (5.25) (4.30) (-1.18) (-1.31) Note: 5-1 is actually portfolio 1 minus portfolio 5 (1-5) for portfolios sorted on leverage to price.
4 | 7 P a g e s
Performance Adjusted for Market Risk Factors
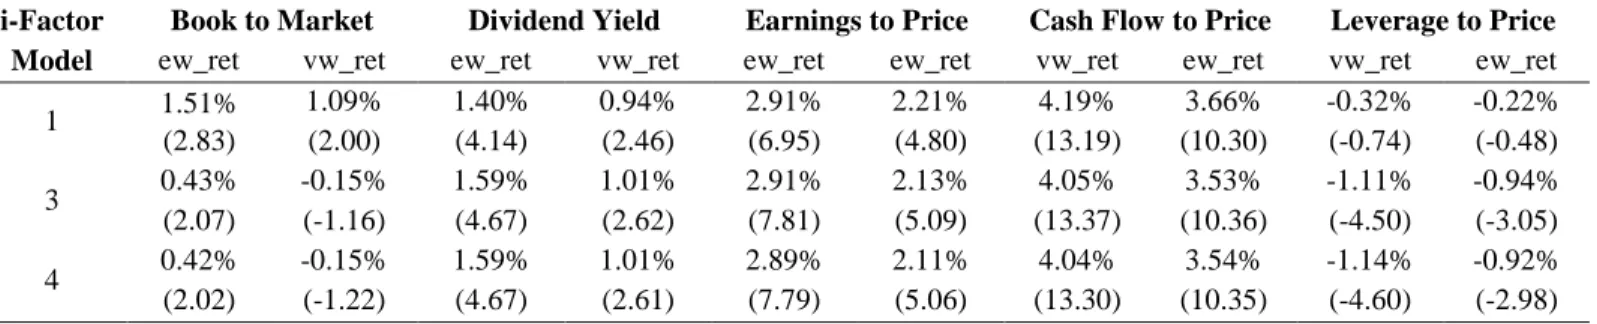
We now investigate how the value investing strategies performed after controlling for Taiwan’s systematic market risk factors—the market, value, size and momentum factors. We regress the zero-cost portfolios based on our five quantitative measures on these market risk factors and obtain the multifactor risk-adjusted returns (alphas). The Capital Asset Pricing Model (CAPM) is the one-factor model and has the market risk factor. The three-factor model has market, value (HML) and size (SMB) factors. The four-factor model additionally includes the momentum factor. As shown in Table 3, we find that both equal-weighed and value-weighted zero-cost portfolios based on the earnings-to–price ratio, dividend yield and cash flow-to-price ratio generated significantly abnormal excess returns (alphas) in all multifactor models. The zero-cost portfolios based on the leverage-to-price ratio actually generated negative alphas. This implies that the portfolio with the lowest leverage-to-price ratio significantly outperformed the one with the highest leverage-to-price ratio. On the other hand, the equal-weighted zero-cost portfolio based on the book-to-market ratio generated significant abnormal excess returns (alphas) in all multifactor models
Table 3: Alphas of the zero-cost portfolios adjusted for market risk factors
i-Factor Model
Book to Market Dividend Yield Earnings to Price Cash Flow to Price Leverage to Price ew_ret vw_ret ew_ret vw_ret ew_ret ew_ret vw_ret ew_ret vw_ret ew_ret 1 1.51% 1.09% 1.40% 0.94% 2.91% 2.21% 4.19% 3.66% -0.32% -0.22% (2.83) (2.00) (4.14) (2.46) (6.95) (4.80) (13.19) (10.30) (-0.74) (-0.48) 3 0.43% -0.15% 1.59% 1.01% 2.91% 2.13% 4.05% 3.53% -1.11% -0.94% (2.07) (-1.16) (4.67) (2.62) (7.81) (5.09) (13.37) (10.36) (-4.50) (-3.05) 4 0.42% -0.15% 1.59% 1.01% 2.89% 2.11% 4.04% 3.54% -1.14% -0.92% (2.02) (-1.22) (4.67) (2.61) (7.79) (5.06) (13.30) (10.35) (-4.60) (-2.98)
The Astonishing Returns of Value-Based Investing Strategies
In Figure 1, we report the cumulative payoff of investing $1 in the portfolios having the highest values of the book-to-market ratio, dividend yield, earnings-to-price ratio, cash flow-to-price ratio, and leverage-to-price ratio, with monthly portfolio rebalancing in the 1991–2013 period. We also compare this payoff with the cumulative payoff from a dollar invested in the aggregate stock market and with other investing strategies studied in previous newsletters that are based on a stock’s momentum, size, return reversal, idiosyncratic volatility and total volatility. We find that the investing strategies based on the book-to-market ratio (B/P), dividend yield (DY), earnings-to-price ratio (E/P), cash flow-to-price ratio (OCF), and leverage-to-price ratio (LP) grew $1 into $47.79, $110.65, $600.51, $2635.74, and $10.76 respectively while the aggregate stock market turned $1 into just $4.17 in the 1991–2013 period. This implies that these five value investing strategies rewarded investors between 2.58 and 632.42 times more than the Taiwan stock market did. The effective monthly compound returns of these five value investing strategies from 1991 to 2013 are 1.41%, 1.71%, 2.36%, 2.92%, and 0.87% while the aggregate stock market only delivered 1.06% in the same period. Our findings suggest that the value investing strategy based on the cash flow-to-price ratio can reward investors with the highest returns.
5 | 7 P a g e s Figure 1. Cumulative Payoff of $1 Invested in Taiwan’s Total Market Index and in Portfolios with the Lowest Market Value (size), Total Volatility, and Return for the Past One Month (Reversal) as well as the Highest Return for the Past Six Months (Momentum), the Highest Book-to-Market Ratio, Dividend Yield, Earnings-to-Price Ratio, Cash Flow-to-Price Ratio, and Leverage-to-Flow-to-Price Ratio with Monthly Portfolio Rebalancing in Taiwan’s Stock Market.
Conclusion
We find that the value investing strategies based on a stock’s book-to-market ratio, dividend yield, earning-to-price ratio, and cash flow-to-price ratio significantly outperformed Taiwan’s stock market in the 1991–2013 period. In particular, these investing strategies turned a $1 investment into $47.79, $110.65, $600.51, $2635.74 in the Taiwan stock market in the said period. This means that they rewarded investors 10.9, 26.5, 144.09, and 632.42 times more than the aggregate stock market did. 0 500 1000 1500 2000 2500 3000 2/1/1991 11/1/1991 8/1/1992 5/1/1993 2/1/1994 11/1/1994 8/1 /19 95 5/1/1996 2/1/1997 11/1/1997 8/1/1998 5/1/1999 2/1/2000 11/1/2000 8/1/2001 5/1/2002 2/1/2003 11/1/2003 8/1/2004 5/1/2005 2/1/2006 11/1/2006 8/1/2007 5/1/2008 2/1/2009 11/1/2009 8/1/2010 5/1/2011 2/1/2012 11/1/2012 8/1/2013
CUMULATIVE PAYOFF OF INVESTING STRATEGIES AND TAIWAN's MARKET RETURN INDEX
February 1991 - December 2013
Leverage to price Book to market Dividend yield
Earnings to price OCF to price Momentum
Reversal Past size TDVOL
6 | 7 P a g e s About Value Partners Center for Investing (http://vpcenter.ust.hk/)
The Value Partners Center for Investing of the Hong Kong University of Science and Technology Business School is an academic and intellectual center supporting research and training on investing with an
emphasis on China and Hong Kong financial markets. It aims to promote Hong Kong's role as the regional asset management center. The center is sponsored by Value Partners Group Limited.
About Value Partners Group Limited (http://www.valuepartners.com.hk/en/home.html)
Value Partners is one of Asia’s largest independent asset management firms. Since its establishment in 1993, the firm has been a dedicated value investor with a focus on the Greater China region. Value Partners manages absolute return long-biased funds, long-short hedge funds, fixed income products, exchange-traded funds, as well as quantitative funds for institutional and individual clients in Asia Pacific, Europe and the United States.
Author Contact Information Dr. Samuel Xin Liang
Associate Director
Value Partners Center for Investing Tel: +852 2358 8204
Mobile: +852 9175 8951 Fax: +852 2358 1749 Email: [email protected]
Supporting Researchers: Ms. Cheuk, Man Yin Mr. Wei Yue