Subscriber access provided by NATIONAL TAIWAN UNIV
Industrial & Engineering Chemistry Research is published by the American Chemical Society. 1155 Sixteenth Street N.W., Washington, DC 20036
Article
Generalized Geometric Interpretation of
Temperature Control for Ternary Distillation
Michael L. Luyben, Min-Te Lin, Jian-Kai Cheng, and Cheng-Ching Yu
Ind. Eng. Chem. Res., 2007, 46 (24), 8130-8137 • DOI: 10.1021/ie070624e Downloaded from http://pubs.acs.org on November 28, 2008
More About This Article
Additional resources and features associated with this article are available within the HTML version:
• Supporting Information
• Access to high resolution figures
• Links to articles and content related to this article
Generalized Geometric Interpretation of Temperature Control for Ternary
Distillation
Michael L. Luyben,†Min-Te Lin,‡Jian-Kai Cheng,‡and Cheng-Ching Yu*,‡
E. I. du Pont de Nemours & Co., Inc., 1007 Market St.-B7434, Wilmington, Delaware 19898, and Department of Chemical Engineering, National Taiwan UniVersity, Taipei 106-17, Taiwan
A previous paper introduced the concept of traveling distance to quantify how much the composition profile in a distillation column has to change when certain tray temperatures are held constant under single-end temperature control. The larger the traveling distance for a given temperature-control selection, the slower the composition dynamics and, hence, the poorer the control performance are expected to be. This work generalizes the concept of traveling distance in distillation-temperature control for different levels of complexity in a ternary distillation column separating components A, B, and C, in order of decreasing volatility. For the direct separation between A and B/C with a high purity of A at the top, the analysis shows that the conflict between process and control direction becomes more severe (larger traveling distance) with (1) increasing overhead purity of A, (2) decreasing relative volatility between light and heavy key components (A and B, respectively), (3) increasing relative volatility between the heavy and heavier-than-heavy key components (B and C, respectively), and (4) decreasing feed composition of the light key component (A). The results can be inverted to the indirect separation between A/B and C with a high purity of C at the bottom, while substituting heavy for light in the above conclusions.
1. Introduction
In a previous paper (Lin et al.1), we proposed a geometric interpretation of distillation column temperature control in the triangular composition space for a ternary system. We examined a specific column design with components of a certain assumed constant relative volatility as a way to illustrate the basic concepts concerning the choice of control-tray temperature.
In spite of the many advances in the technology to have direct, fast on-line measurement of product purities, the controlled variable for product quality in many industrial distillation columns is tray temperature. Many approaches have been proposed over the decades for selecting the proper temperature-control points and for composition estimation in distillation columns.2-11 Our previous paper explained physically why certain temperature locations are superior to others, particularly in ternary (or multicomponent) columns. We considered a general three-component mixture of A, B, and C in order of decreasing volatility. If we assume constant relative volatility, then isotherms in the triangular composition space are straight lines with a slope directly proportional to the ratio of relative volatilities of components A and B.
We showed the interaction between the direction of the process composition profile in triangular space to achieve the desired component separation and the direction of the control composition profile to maintain a constant tray temperature. A potential conflict can arise between the process and control directions. The traveling distance can be used as a quantitative measure to calculate how much the column composition profile must change with certain tray temperatures held constant. The traveling distance can be computed from steady-state gain matrices but provides useful dynamic information about control performance. The larger the value of the traveling distance for
a given temperature-control selection, the slower the composition dynamics and, hence, the poorer the control performance is expected to be.
The objective of this paper is to generalize these concepts on the temperature control of multicomponent distillation columns by studying design parameters for (1) different product purity levels, (2) different relative volatilities between A/B and B/C, (3) different feed compositions, and (4) different separation structures (direct split and indirect split).
2. Effects of Product Purities
Here we look at how product-purity levels affect the column temperature control. Because of process nonlinearity, control of a high-purity distillation column has received some attention in the past.11-15 Here, we want to determine whether the traveling distance can be used as a measure of the expected temperature-control performance (e.g., speed of response) as the product-purity specifications become more severe. Our results from the linearized transfer functions will be validated via nonlinear dynamic simulation.
* Corresponding author. Tel.: 3366-3037. Fax: +886-2-2362-3040.
†E. I. du Pont de Nemours & Co., Inc. ‡National Taiwan University.
Figure 1. Steady-state composition profiles for different bottoms product
purities and the material balance line (feed and top and bottoms product composition) also indicated in the ternary composition space.
10.1021/ie070624e CCC: $37.00 © 2007 American Chemical Society Published on Web 10/16/2007
2.1. Process Description. We consider first the direct split where component A goes overhead and components B and C go out the bottom of the column. So component A is the light key (LK), component B is the heavy key (HK), and component C is the heavier-than-heavy key (HHK). Three different values of bottoms product purity were studied with a fixed feed composition. The composition or mole fraction of impurity A in the bottoms (XB,A) is varied with about the same constant distillate mole fraction of A (XD,A). For a given base composi-tion, the column is redesigned by assuming a reflux ratio that is 1.2 times the minimum. This varies the reflux ratio, the total number of theoretical stages, and the feed stage. A value of XB,Aof 10-3is the base case, whereas XB,Aof 10-4moves the composition profile closer to the edge of the triangular diagram and XB,Aof 10-1moves it away from the edge. Table 1 gives the steady-state designs and operating conditions for these three alternatives. Figure 1 shows that, as XB,Aincreases (impurity A increases), the composition profile moves away from the B-C edge.
2.2. Temperature Control. In this work, single-end tem-perature is studied. If the bottoms product composition is of interest, we use reboiler duty to maintain a tray temperature in the stripping section as shown in Figure 2. If the top composition is of interest, the reflux flow rate is used to maintain a tray temperature in the rectifying section. Also notice here that the proposed traveling distance approach can be extended to multivariable control in a straightforward manner.1
2.3. Dynamics. The potential temperature-control trays for each of the three designs can be selected according to a sensitivity analysis looking at reboiler duty (Figure 3), or we can look at using the first theoretical stage from the bottom (T1) for temperature control. Note that, in this work, we count the tray number from bottoms upward with the column base as tray zero. The results of the sensitivity analysis are as follows:
The traveling distance is defined as the change in compo-sition profile needed with tray temperatures held
con-stant.1It can be derived from the linearized open-loop transfer function
where xj,iis molar fraction of the component i of the jth tray, Tj
is the temperature of the jth tray, Gj,idenotes the process transfer
function of the component i of the jth tray, GTjis the process transfer function of the jth temperature control tray, GLj,istands for the load transfer function of the component i of the jth tray, GLTjis the load transfer function of the jth temperature-control
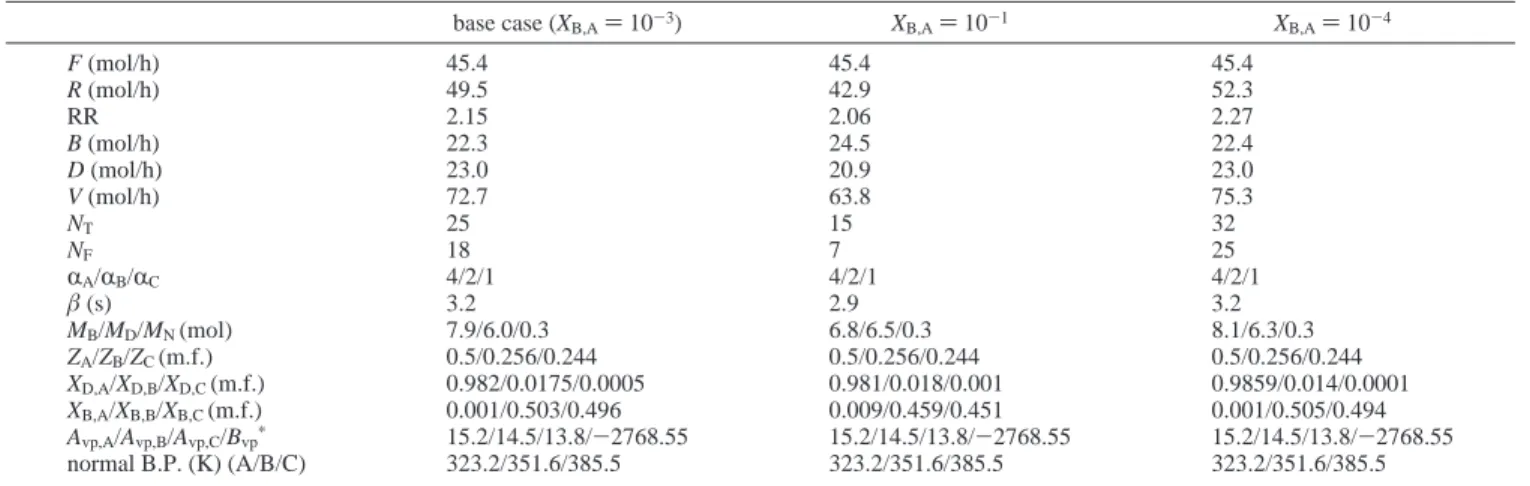
Table 1. Steady-State Operating Conditions for Different Product Purities
base case (XB,A) 10-3) XB,A) 10-1 XB,A) 10-4
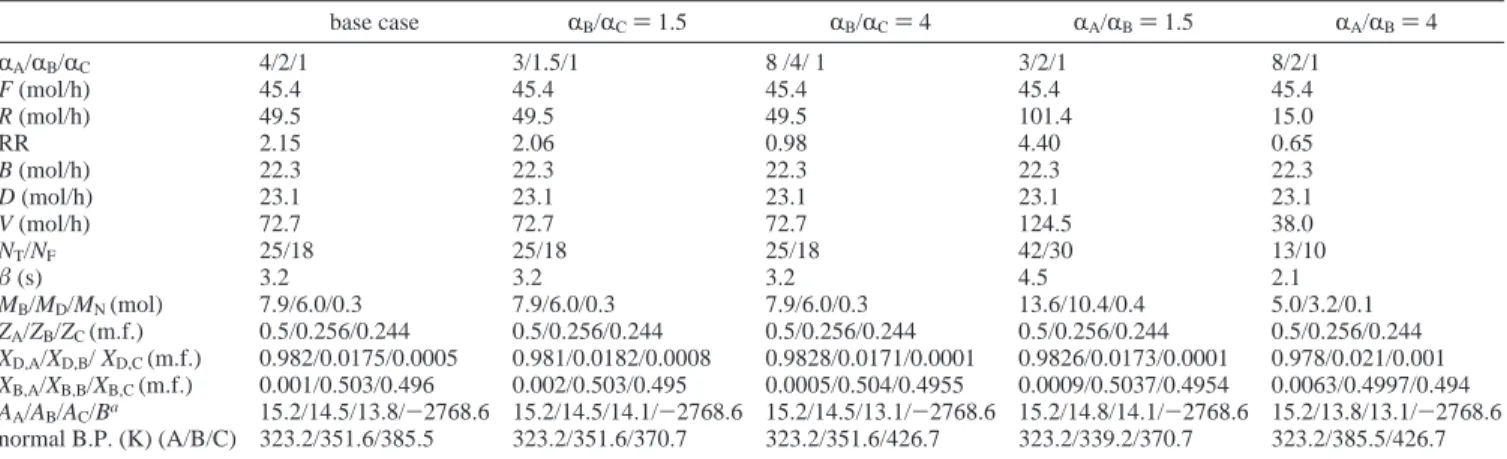
F (mol/h) 45.4 45.4 45.4 R (mol/h) 49.5 42.9 52.3 RR 2.15 2.06 2.27 B (mol/h) 22.3 24.5 22.4 D (mol/h) 23.0 20.9 23.0 V (mol/h) 72.7 63.8 75.3 NT 25 15 32 NF 18 7 25 RA/RB/RC 4/2/1 4/2/1 4/2/1 β (s) 3.2 2.9 3.2 MB/MD/MN(mol) 7.9/6.0/0.3 6.8/6.5/0.3 8.1/6.3/0.3 ZA/ZB/ZC(m.f.) 0.5/0.256/0.244 0.5/0.256/0.244 0.5/0.256/0.244 XD,A/XD,B/XD,C(m.f.) 0.982/0.0175/0.0005 0.981/0.018/0.001 0.9859/0.014/0.0001 XB,A/XB,B/XB,C(m.f.) 0.001/0.503/0.496 0.009/0.459/0.451 0.001/0.505/0.494 Avp,A/Avp,B/Avp,C/Bvp* 15.2/14.5/13.8/-2768.55 15.2/14.5/13.8/-2768.55 15.2/14.5/13.8/-2768.55 normal B.P. (K) (A/B/C) 323.2/351.6/385.5 323.2/351.6/385.5 323.2/351.6/385.5 aln Pisat) A
vp,i+ (Bvp)/(T), where T is in Kelvin.
XB,A) 10-1: T2(most sensitive tray, Figure 3A) XB,A) 10-3: T10(most sensitive tray, Figure 3B) XB,A) 10-4: T13(most sensitive tray, Figure 3C)
[
x1,1 l xNT,1 x1,2 l xNT,2 T1 l TNT]
)[
G1,1 l GNT,1 G1,2 l GNT,2 GT1 l GTNT]
[u] +[
GL1,1 l GLNT,1 GL1,2 l GLNT,2 GLT1 l GLTNT]
[d] (1)Figure 2. Control a tray temperature in the stripping section using reboiler
duty while keeping the reflux flow rate constant.
tray, u denotes the manipulated variable, and d is the load variable. If Tkis held constant, one obtains
After some algebraic manipulation, the normalized traveling distance becomes
The traveling distance can be computed from the steady-state gain matrices of the process and load transfer functions for a given assumed disturbance involving a change in feed flow (F) shown in Figure 4A, feed composition of component A (ZA) shown in Figure 4B, or feed composition of components B and C (ZB/ZC) shown in Figure 4C. The results clearly show that the traveling distance increases significantly when the purity level increases when T1is under control.
Dynamic simulations were also carried out using the most sensitive temperature for control (Tsensitive) and T1as tempera-ture-control trays for the three bottoms purity levels. First, we explore the load responses for a 20% decrease in feed flow. Figure 5 shows the relatively slower dynamic responses observed when T1 is used for control compared with the response using Tsensitive for control. The snapshots of the composition profile of intermediate component B indicate (for T1control) that, at time ) 30, the profile is far away from the
Figure 3. Sensitivity analysis to heat input change when (A) XB,A) 10-1, (B) XB,A) 10-3, and (C) XB,A) 10-4.
Figure 4. Traveling distance: (A) with F change with different bottoms product purities, (B) with ZAchange for different bottoms product purities, and (C)
with ZB/ZCchange for different product purities. (Note: fractions 0 and 1 correspond to the bottom and top of the column, respectively.)
Figure 5. Snapshots of composition profile of component B for -20% F change with T1control when (A) XB,A) 10-1, (B) XB,A) 10-3, (C) XB,A) 10-4,
and with Tsensitivecontrol when (D) XB,A) 10-1, (E) XB,A) 10-3, and (F) XB,A) 10-4.
[
x1,1 l xNT,1 x1,2 l xNT,2]
)[
GL1,1- G1,1(GLTk/GTk) l GLNT,1- GNT,1(GLTk/GTk) GL1,2- G1,2(GLTk/GTk) l GLNT,2- GNT,2(GLTk/GTk)]
[d] (2) distance(Tk) )[
∑
j)1 NT∑
i)1 NC-1(
GLj,i- Gj,i(
GLTk GTk))
2]
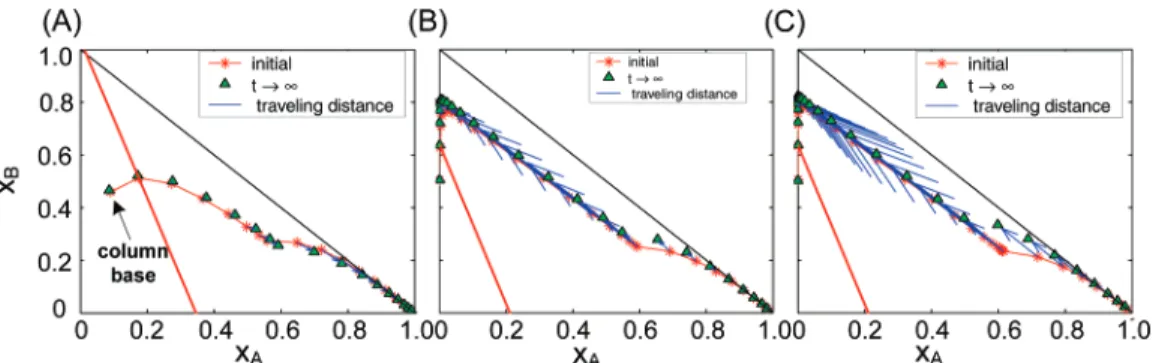
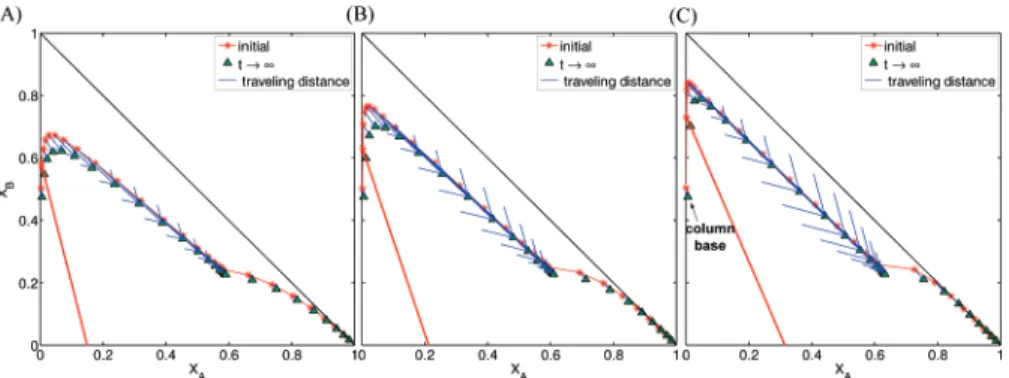
1/2 /NT (3)final steady state. The difference between t ) 30 and t ) infinity gets larger as the bottoms purity increases. Figure 6 shows that the traveling distance, as indicated by the arrows in the composition space, goes up quickly when the bottoms composi-tion becomes more pure.
Second, Figure 7 shows the profiles of component B when the feed composition of A decreases by 10%. The traveling distance increases moderately when T1is under control, but little difference in the distances is observed if the most sensitive tray is held constant. Third, we examine a 10% decrease in the feed composition of component B (based on the feed mole fraction ratio ZB/ZC). The results of dynamic simulation show that T1 temperature control is much slower than the Tsensitivecontrol, especially for the high purity case. Moreover, little change in the composition profile is observed when the most sensitive tray is under temperature control. This is due to a significant traveling distance for T1control and the fact that the distance increases as the purity goes up.
The conflict between process and control directions will be more severe when the column product purity level increases. Because the composition profile moves closer to the edge of the triangular diagram if XB,Abecomes smaller, we essentially lose a degree of freedom for the temperature controller to move the composition profile where it needs to go.
3. Effects of Relative Volatilities
3.1. Process Description. We have so far assumed constant relative volatilities among the three components with relative volatilities of 4/2/1. For the system where A ) LK, B ) HK, and C ) HHK, we can examine how the volatilities affect the
expected control performance. Two cases and four systems are studied. In case 1, we can vary the relative volatility between LK/HK components (RA/RB):
In case 2, we can vary the relative volatility between HK/HHK components (RB/RC):
Table 2 gives the steady-state operating conditions for all four cases explored. Figure 8 shows that the slope of the temperature isotherm changes as the relative volatilities between LK/HK and HK/HHK vary. Figure 8A indicates that, relatively speaking, the case of RA/RB/RC ) 3/2/1 has two distinct disadvantages: (1) it is closer to the XB-XCedge and (2) it has the smallest slope in all three cases. Similarly, Figure 8B indicates that, relatively speaking, the case of RA/RB/RC) 8/4/1 also has two distinct disadvantages: (1) it is closer to the edge and (2) it has the smallest slope in all three cases. These characteristics indicate potential temperature-control problems if the temperature-control tray is not carefully selected.
3.2. Dynamics. Before we go into the details, the most sensitive temperature control trays for all four cases were selected from sensitivity analyses by changing the reboiler duty. The results are as follows:
Comparisons will be made between temperature control using Tsensitiveand T1.
3.2.1. Traveling Distance for Different Relative Volatilities. First, let us look at case 1 (changing relative volatility between LK/HK). For the ZB/ZCdisturbance, the RA/RB/RC) 3/2/1 case indeed gives the worst-case scenario if T1is used for control as
Figure 6. Reshaping composition profile and corresponding traveling distance for T1control with -20% F change when (A) XB,A) 10-1, (B) XB,A) 10-3,
and (C) XB,A) 10-4(with the straight line indicating the temperature isotherm, the control direction, and the size of the arrow representing the magnitude
and the direction the tray composition traveling, the process direction).
Figure 7. Transient response for -10% ZAchange; T1) const: (A) XB,A
) 10-1, (B) X
B,A) 10-3, and (C) XB,A) 10-4; Tsensivity tray) constant:
(D) XB,A) 10-1, (E) XB,A) 10-3, and (F) XB,A) 10-4.
Difficult separation: RA/RB/RC) 3/2/1 Easy separation: RA/RB/RC) 8/2/1
Difficult separation: RA/RB/RC) 3/1.5/1 Easy separation: RA/RB/RC) 8/4/1
Base Case: T10(recall Figure 3) Case 1 R A/RB/RC) 3/2/1: T19 R A/RB/RC) 8/2/1: T3 Case 2 R A/RB/RC) 3/1.5/1: T9 R A/RB/RC) 8/4/1: T11
indicated by the traveling distance in Figure 9A. Similar results can be found for F and ZAdisturbances.16Next, we examine case 2 (changing relative volatility between HK/HHK). For the ZB/ZCdisturbance, the RA/RB/RC) 8/4/1 case indeed gives the worst-case scenario if T1is used for control as indicated by the traveling distance in Figure 9B. Actually, this can be foreseen by qualitative arguments, but it is reconfirmed here.
3.2.2. Validation using Dynamic Simulation. Dynamic simulation using Tsensitiveand T1 as temperature-control trays was carried out for all cases. First, we look at the case of changing relative volatility between LK/HK. The results show that, for the T1 temperature control, the case of RA/RB/RC ) 3/2/1 takes a rather long time to reach the final steady-state profile, as compared to the case of RA/RB/RC ) 4/2/1. The
Figure 8. Steady-state composition profiles for different relative volatilities: (A) RA/RBchange and (B) RB/RCchange (with the straight lines indicating the
corresponding temperature isotherms, when the column base temperature was held constant).
Figure 9. Traveling distance: (A) with ZB/ZCchange for different RA/RB, (B) with ZB/ZCchange for different RB/RC. (Note: fractions 0 and 1 correspond
to the bottom and top of the column, respectively.)
Table 2. Steady-State Operating Conditions for Different Relative Volatilities
base case RB/RC) 1.5 RB/RC) 4 RA/RB) 1.5 RA/RB) 4 RA/RB/RC 4/2/1 3/1.5/1 8 /4/ 1 3/2/1 8/2/1 F (mol/h) 45.4 45.4 45.4 45.4 45.4 R (mol/h) 49.5 49.5 49.5 101.4 15.0 RR 2.15 2.06 0.98 4.40 0.65 B (mol/h) 22.3 22.3 22.3 22.3 22.3 D (mol/h) 23.1 23.1 23.1 23.1 23.1 V (mol/h) 72.7 72.7 72.7 124.5 38.0 NT/NF 25/18 25/18 25/18 42/30 13/10 β (s) 3.2 3.2 3.2 4.5 2.1 MB/MD/MN(mol) 7.9/6.0/0.3 7.9/6.0/0.3 7.9/6.0/0.3 13.6/10.4/0.4 5.0/3.2/0.1 ZA/ZB/ZC(m.f.) 0.5/0.256/0.244 0.5/0.256/0.244 0.5/0.256/0.244 0.5/0.256/0.244 0.5/0.256/0.244 XD,A/XD,B/ XD,C(m.f.) 0.982/0.0175/0.0005 0.981/0.0182/0.0008 0.9828/0.0171/0.0001 0.9826/0.0173/0.0001 0.978/0.021/0.001 XB,A/XB,B/XB,C(m.f.) 0.001/0.503/0.496 0.002/0.503/0.495 0.0005/0.504/0.4955 0.0009/0.5037/0.4954 0.0063/0.4997/0.494 AA/AB/AC/Ba 15.2/14.5/13.8/-2768.6 15.2/14.5/14.1/-2768.6 15.2/14.5/13.1/-2768.6 15.2/14.8/14.1/-2768.6 15.2/13.8/13.1/-2768.6 normal B.P. (K) (A/B/C) 323.2/351.6/385.5 323.2/351.6/370.7 323.2/351.6/426.7 323.2/339.2/370.7 323.2/385.5/426.7 aln P i sat) A
situation improves a little for the case of RA/RB/RC ) 8/2/1. On the other hand, when the most sensitive temperature-control tray is selected, we have approximately the same speed of response for all three cases. Note that here we only show the results for the ZB/ZCdisturbance. Similar results can be found for the other two disturbances (ZA and F). Next, the case of changing relative volatility between HK/HHK is studied. Figure 10 (parts A-C) shows the traveling distance for each tray, and as predicted, the case of RA/RB/RC ) 8/4/1 gives the largest traveling distance. Note that here we only show the results for the ZB/ZCdisturbance. Similar results can be found for the other two disturbances (ZAand F).
3.3. Summaries. The conflict between process and control directions will become more severe for the following cases: (1) the relative volatility between LK/HK decreases and (2) the relative volatility between the HK/HHK increases. The results can be visualized in the composition space or can be computed quantitatively using the traveling distance. The result is con-firmed via rigorous nonlinear dynamic simulation. Qualitatively, the “control” direction is indicated by the isotherm as indicated by the straight lines in Figure 8, and the “process” direction toward the bottoms product end is along the B-C edge. In other words, from the process perspective, we would like to keep impurity level (composition of A) under control (thus, on the B-C edge). Thus, the angle between these two directions can be interpreted as the mismatches between them.13The two more severe cases reveal larger mismatches in these directions (e.g., RA/RB/RC) 3/2/1 and RA/RB/RC) 8/4/1 give the smallest slopes in the corresponding categories, while the process direction gives a slope approaching infinity). Even simpler, in terms of the composition profile, these worst cases have the largest maximum XB composition (most severe wrong way behavior in XB, as shown in Figure 8).
4. Effect of Feed Conditions
4.1. Steady-State Process Description. Here we look at what happens when we change the feed composition. Three cases are considered:
• ZA) 0.5: base case
• ZA) 0.1: less light component • ZA) 0.9: more light component
Distillation columns are designed for each feed composition, and Table 3 gives the steady-state operating conditions for all three cases. Figure 11 shows the composition profiles. The results show that, as the light component decreases in the feed, the composition profile moves closer to the ZB-ZCedge, where we lose a degree of freedom. It is expected that the selection of the temperature-control tray will be crucial when ZAdecreases. 4.2. Dynamics. Temperature-control trays are selected ac-cording to a sensitivity analysis. The results are as follows:
• ZA) 0.1: T16(selected by most sensitive tray) • ZA) 0.5: T10(selected by most sensitive tray) • ZA) 0.9: T7(selected by most sensitive tray)
Note that, for ZA) 0.1, the most sensitive temperature-control tray is located in the rectifying section (above the feed point), which is not a typical location for controlling the impurity in the bottom.
4.2.1. Traveling Distance for Different Feed Conditions. The traveling distances are computed for the ZB/ZCdisturbance for all three cases. The results (Figure 12) show that it is important to select the right temperature-control tray, especially when we try to control the composition close to the edge.
4.2.2. Validation using Dynamic Simulation. The results of dynamic simulation reveal significant traveling distances, and slower dynamics, as the light component (A) feed composition decreases (e.g., ZA) 0.1) when T1is under control (Lin).16It
Figure 10. Reshaping composition profile for T1control with -10% ZB/ZCfor different RB/RC: (A) RA/RB/RC) 3/1.5/1, (B) RA/RB/RC) 4/2/1, and (C)
RA/RB/RC) 8/4/1.
Table 3. Steady-State Operating Conditions for Different Feed Conditions
base case ZA) 0.9 ZA) 0.1 RA/RB/RC 4/2/1 4/2/1 4/2/1 F (mol/h) 45.4 45.4 45.4 R (mol/h) 49.5 36.7 50.8 RR 2.15 0.89 11.16 B (mol/h) 22.3 4.1 40.8 D (mol/h) 23.1 41.2 4.6 V (mol/h) 72.7 77.9 55.4 NT/NF 25/18 29/25 22/13 β (s) 3.2 3.3 2.6 MB/MD/MN(mol) 17.44/13.34/0.59 15.07/14.31/0.632 17.67/10.17/0.46 ZA/ZB/ZC(m.f.) 0.5/0.256/0.244 0.9/0.056/0.046 0.1/0.449/0.451 XD,A/XD,B/XD,C(m.f.) 0.982/0.0175/0.0005 0.9895/0.01/0.0001 0.9833/0.0166/0.0001 XB,A/XB,B/XB,C(m.f.) 0.001/0.503/0.496 0.0024/0.491/0.5066 0.0014/0.4975/0.501 AA/AB/AC/Ba 15.2/14.5/13.8/-2768.6 15.2/14.5/13.8/-2768.6 15.2/14.5/13.8/-2768.6 normal B.P. (K) (A/B/C) 323.2/351.6/385.5 323.2/351.6/385.5 323.2/351.6/385.5 aln P i sat) A
vp,i+ (Bvp)/(T), where T is in Kelvin.
also shows that a small tray composition redistribution occurs when the most sensitive temperature-control tray is held constant. Similar results have also been found for the ZB/ZC disturbance, with a larger traveling distance for the case of ZA ) 0.1.
4.3. Summary. The results presented here clearly show that the large traveling distances resulting from the loss of a degree of freedom and the conflict between process and control directions also apply to different feed conditions. It is important to select the appropriate temperature-control tray to avoid a large traveling distance. When the light component in the feed decreases, the conflict amplifies.
5. Indirect Split
5.1. Process Description. Can the same analysis be carried over to the indirect separation mode? Here we have a column with ZA) ZB) 0.25 and ZC) 0.5, in which pure C (∼0.98) is withdrawn from the bottom and the mixture of A and B is taken out from the top with C as the distillate impurity. Table 4 gives the steady-state operating conditions. Toward the column top, we have a loss of a degree of freedom when the separation
is performed between A and B with almost no C. In a sense, this can be viewed as a mirror image of the direct separation. Figure 13 shows the composition profile.
5.2. Dynamics. 5.2.1. Traveling Distance for Indirect Separation. Traveling distance can be computed from steady-state gain matrices, for any given disturbance. Dynamic simula-tions were also carried out using the most sensitive temperature for control (T12) and the top tray (T25) as temperature-control trays for the three top purity levels. The figures clearly show that the traveling distance increases significantly when T25is under control (Figure 14) for ZB/ZAdisturbance. Slow dynamics is expected for T25temperature control, while good control will be achieved using T12temperature control.
Figure 11. Composition profiles for different feed conditions with straight
line indicating material balance line with corresponding feed composition,
ZA.
Figure 12. Traveling distance for ZB/ZC change with different feed
conditions. (Note: fractions 0 and 1 correspond to the bottom and top of the column, respectively.)
Figure 13. Feed and composition profile for the indirect separation system.
Figure 14. Traveling distance for ZB/ZAchange with indirect separation.
Table 4. Steady-State Operating Condition for Indirect Separation
indirect separation RA/RB/RC 4/2/1 F (mol/h) 45.4 R (mol/h) 51.6 RR 2.313859 B (mol/h) 22.3 D (mol/h) 73.9 V (mol/h) 45.4 NT/NF 25/10 β (s) 3.2 MB/MD/MN(mol) 8.1/6.2/0.3 ZA/ZB/ZC(m.f.) 0.2436/0.2564/0.5 XD,A/XD,B/XD,C(m.f.) 0.4956/0.5039/0.0005 XB,A/XB,B/XB,C(m.f.) 0.00006/0.0171/0.98284 AA/AB/AC/Ba 15.2/14.5/13.8/-2768.6 normal B.P. (K) (A/B/C) 323.2/351.6 /385.5 aln P i sat) A
5.2.2. Validation using Dynamic Simulation. Dynamic simulations using T12and T25as temperature-control trays were carried out for three disturbances (F, ZC, ZB/ZAchanges). For a -20% F change, the case of T25temperature control takes a longer time to reach the final steady-state profile as compared with T12 temperature control. This is also true for the ZB/ZA disturbance.
5.3. Summary. The indirect split shows the mirror image of the direct split, and the same arguments apply about the loss of a degree of freedom plus the conflict between process and control directions.
6. Conclusions
This paper explores potential problems of temperature-control locations in multicomponent distillation columns. Explanations of the problem are given with different levels of complexity. Qualitatively, we experience a potential conflict between the process and control directions, which can be visualized in the triangular composition space. The situation is worsened when we have a loss of a degree of freedom as the composition profile travels along one of the sides of the triangle. Quantitatively, the traveling distance can be computed, and the potential dynamic problem can be seen directly. Rigorous dynamic simulations are carried out to validate the results. These principles apply to various conditions, and we explore the severity for different situations. For the direct separation between A(LK), B(HK), and C (HHK) with a high purity of A at the top, the results are as follows: (1) the conflict between process and control directions becomes more severe as the product purity increases; (2) the conflict between process and control directions becomes worse as the separation between light and heavy key components becomes more difficult; (3) the conflict between process and control directions deteriorates as the separation between heavy and heavier-than-heavy key components be-comes easier; and (4) the conflict worsens as the feed composi-tion of the light component decreases. The results can be translated over to the indirect separation between A(LLK), B(LK), and C (HK) with a high purity of C on the bottom, while substituting heavy for light in the above principles. Nomenclature
Avp,i) Antoine coefficient for component i
Bvp) Antoine coefficient (same for all components) B ) bottoms flow rate, mol/h
D ) distillate flow rate, mol/h
d ) load variable representing F, ZA, or ZB/ZC changes F ) feed flow rate, mol/h
Gj,i(k)) process transfer function of component i of the jth tray (xj,i) under the kth manipulated variable (uk)
GLj,i ) load transfer function of component i of the jth tray (xj,i) under load variable d
GTj
(k)) process transfer function of the temperature of the jth tray (Tj) under the kth manipulated variable (uk)
GLTj) load transfer function of the temperature of the jth tray (Tj) under load variable d
MB) liquid holdup of bottoms base, mol MD) liquid holdup of reflux drum, mol MN) liquid holdup of each tray, mol NT ) total number of trays
NF ) feed location
Pisat) vapor pressure of component i R ) reflux flow rate, mol/h
RR ) reflux ratio (R/D) Tj) jth tray temperature, K
u ) manipulated variable V ) vapor boilup rate, mol/h
xi) liquid-phase composition of the ith component, m.f.
xj,i) ith component liquid-phase composition on the jth tray,
m.f.
XB,i) bottoms composition of the ith component, m.f. XD,i) distillate composition of the ith component, m.f. yi) vapor-phase composition of the ith component, m.f.
Zi) feed composition of the ith component, m.f.
Greek Symbols
Ri) relative volatility of component i β ) liquid hydraulic time constant, s Literature Cited
(1) Lin, M. T.; Yu, C. C.; Luyben, M. L. Interpretation of temperature control for ternary distillation. Ind. Eng. Chem. Res. 2005, 44, 8277-8290. (2) Yu, C. C.; Luyben, W. L. Control of multicomponent distillation columns using rigorous composition estimators. Inst. Chem. Eng. Symp.
Ser. 1989, 104, A29-A69.
(3) Mejdell, T.; Skogestad, S. Estimation of distillation compositions from multiple temperature measurements using partial least-squares regres-sion. Ind. Eng. Chem. Res. 1991, 30, 2543-2555.
(4) Baratti, R.; Bertucco, A.; Da Rold, A.; Morbidelli, M. A composition estimator for multicomponent distillation columnssDevelopment and experimental tests on ternary mixtures. Chem. Eng. Sci. 1998, 53, 3601-3612.
(5) Kano, M.; Miyazaki, K.; Hasebe, S.; Hashimoto, I. Inferential control system of distillation compositions using dynamic partial least squares regression. J. Process Control 2000, 10, 157-166.
(6) Pannocchia, G.; Brambilla, A. Consistency of property estimators in multicomponent distillation control. Ind. Eng. Chem. Res. 2003, 42, 4452-4460.
(7) Tronci, S.; Bezzo, F.; Barolo, M.; Barolo, R. Geometric observer for a distillation column: Development and experimental testing. Ind. Eng.
Chem. Res. 2005, 44, 9884-9893.
(8) Luyben, W. L. Guides for the Selection of Control Structures for Ternary Distillation Columns. Ind. Eng. Chem. Res. 2005, 44, 7113-7119. (9) Luyben, W. L. Evaluation of criteria for selecting temperature control trays in distillation columns. J. Process Control 2006, 16, 115-134.
(10) Hori, E. S.; Skogestad, S. Selection of control structure and temperature location for two-product distillation columns. Chem. Eng. Res.
Des. 2007, 85, 293-306.
(11) Castellanos-Sahagun, E.; Alvarez-Ramirez, J.; Alvarez, J. Two-point composition-temperature control of binary distillation columns. Ind.
Eng. Chem. Res. 2006, 45, 9010-9023.
(12) Chien, I. L.; Ogunnaike, B. A. Modeling and control of a temperature-based high-purity distillation column. Chem. Eng. Commun.
1997, 158, 71-105.
(13) Fuentes, C.; Luyben, W. L. Control of high-purity distillation columns. Ind. Eng. Chem. Process Des. DeV. 1983, 22, 361-366.
(14) Wang, S. J.; Yu, S. W. Nonlinear control of a high-purity distillation column. J. Chin. Inst. Chem. Eng. 1998, 29, 183-192.
(15) Zhu, Y.; Liu, X. G. Dynamics and control of high purity heat integrated distillation columns. Ind. Eng. Chem. Res. 2005, 44, 8806-8814. (16) Lin, M. T. Interpretation of temperature control for multicomponent distillation. MS Thesis, National Taiwan University, Taipei, Taiwan, 2004.
ReceiVed for reView May 3, 2007 ReVised manuscript receiVed August 7, 2007 Accepted August 10, 2007 IE070624E Ind. Eng. Chem. Res., Vol. 46, No. 24, 2007 8137