國
立
交
通
大
學
資訊學院 資訊學程
碩
士
論
文
以內容觸發降低嵌入式行動裝置上
虛擬機器垂直性能分析之負擔
Low Overhead Context-sensitive Vertical Profiling for
Virtual Machine Based Mobile Embedded Devices
研 究 生:蘇資翔
指導教授:陳添福 教授
以內容觸發降低嵌入式行動裝置上虛擬機器垂直性能分析之負擔
Low Overhead Context-sensitive Vertical Profiling for
Virtual Machine Based Mobile Embedded Devices
研 究 生:蘇資翔 Student:Tzu-Hsiang Su
指導教授:陳添福博士 Advisor:Dr. Tien-Fu Chen
國 立 交 通 大 學
資訊學院 資訊學程
碩 士 論 文
A Thesis
Submitted to Degree Program College of Computer Science National Chiao Tung University in partial Fulfillment of the Requirements
for the Degree of Master In Computer Science September 2011 Hsinchu, Taiwan
2011 年 9 月
i
以內容觸發降低嵌入式行動裝置上虛擬
機器垂直性能分析之負擔
研究生:蘇資翔
指導教授:陳添福博士
國 立 交 通 大 學 資 訊 學 院 資 訊 學 程 碩 士 班
摘
要
Android 系統採用了 Dalvik 應用層虛擬機器以便支援各種處理器硬體架構。但是 使用 Dalvik 虛擬機器卻在應用虛擬機器層與 Linux 核心層間產生了 Android 上現有效 能分析工具無法跨越的障礙。這道障礙使得現有效能分析工具無法有效判斷應用程式 的執行瓶頸究竟來自於應用層的程式碼演算法、Linux 使用者空間函式庫、或是更底 層的 Linux 核心與驅動。本論文提出利用 Dalvik 虛擬機器的架構特色與虛擬記憶體替 換通道技術達成不導入大量負擔即可克服訊息傳遞障礙的可調鎖定觸發機制垂直性能 分析平台。這個性能分析平台可以簡化 Android 系統上的軟硬體協同設計過程。
ii
Low Overhead Context-sensitive Vertical Profiling for
Virtual Machine Based Mobile Embedded Devices
Student: Tzu-Hsiang Su
Advisor: Dr. Tien-Fu Chen
Degree Program of Computer Science
National Chiao Tung University
ABSTRACT
Dalvik virtual machine in the Android system creates a profiling barrier between virtual machine applications and Linux user-space libraries. This barrier makes it difficult for existing profiling tools on the Android system to definitively identify whether a bottleneck occurred in application level, Linux user-space level, or Linux kernel level. The proposed the reconfigurable vertical profiling framework leverages the unique features of Dalvik runtime virtual machine to bridges the gap without introducing large overhead. This profiling framework streamlines the hardware-software co-design process for the Android runtime system.
iii
Table of Contents
Chinese Abstract ... i
English Abstract ... ii
Table of Contents ... iii
List of Tables ... vi
List of Figures ... vii
I. Introduction ... 1
II. Background and Related Work ... 6
2.1 Background ... 6 2.1.1 Android Platform ... 6 2.1.2 Oprofile ... 8 2.2 Opcode Instrumentation ... 11 2.2.1 JVMTI ... 11 2.3 Native-code Instrumentation ... 12 2.3.1 VIProf ... 12 2.4 Binary Instrumentation ... 13 2.4.1 Javana ... 13 2.4.2 ProbeNOP ... 14
2.5 Comparison of Vertical Profilers ... 15
iv
3.1 Design Challenge ... 16
3.1.1 How to Instrument Dalvik Virtual Machine ... 16
3.1.2 How to Reduce Profiling Overhead ... 16
3.1.3 Porting Profiling Tools to Android ... 17
3.2 Memory Tunnel ... 17
3.3 VARI profiler Architecture and Profiling Flow ... 19
IV. Dalvik Instrumentation Module ... 22
4.1 Retrieving Application Information ... 22
4.1.1 Handling Method VMA ... 22
4.1.2 Generating Substitute Symbol File ... 23
4.2 Method Invoke Instrumentation ... 25
4.3 Load Method from dex Instrumentation ... 27
4.4 Profiling Flow with Load Method Instrumentation ... 29
4.5 Memory Allocation and Correlation... 30
4.5.1 Without Hash Replacement Address ... 32
4.5.2 With Hash Replacement Address ... 32
V. Reduce Overhead with Reconfigurable Profiling ... 34
5.1 Reconfigurable Vertical Profiling ... 34
5.1.1 Configurability ... 34
5.2 Profiling Granularity ... 35
5.2.1 Method-level Profiling ... 35
v
5.2.3 Service specific-level profiling ... 36
5.3 Extend Reconfigurability to Context-sensitive Profiling ... 36
VI. Experimental Results ... 37
6.1 DIM Mapping Results ... 37
6.2 VARI Profiling Results ... 39
6.3 DIM Overhead ... 41
VII. Conclusion ... 44
vi
List of Tables
Table 1. Visible layers of performance analysis tools on Android. ... 10
Table 2. Comparison of vertical profiling instrumentation methods. ... 15
Table 3. Testing platform. ... 37
Table 4. Experimental environment. ... 37
Table 5. DIM instrumented results of Newton‟s cradle. ... 38
Table 6. Portions of Newton‟s cradle‟s proc memory map. ... 38
vii
List of Figures
Figure 1. Android architecture. ... 7
Figure 2. Android processes. ... 8
Figure 3. Profiling flow of Oprofile provided by the Android source code. ... 9
Figure 4. Javana system architecture... 13
Figure 5. ProbeNOP format using POWER6‟s vector permute instruction. ... 14
Figure 6. Vertical profiling flow on Android runtime. ... 18
Figure 7. VARI profiler architecture. ... 20
Figure 8. Generating hash replacement address symbol file. ... 24
Figure 9. Instrumenting „method invoke‟ creates more runtime overhead. ... 26
Figure 10. Instrumenting when DVM loads the every method of a dex file. ... 28
Figure 11. Hash replacement and load method instrumentation flow. ... 29
Figure 12. Memory allocation and correlation. ... 31
Figure 13. BallsView.java source code for Newton‟s cradle. ... 39
Figure 14. Method-level reconfigurable profiling call-graph for 0xBench Math. ... 40
Figure 15. Application-level reconfigurable profiling call-graph. ... 40
Figure 16. Total profiling time of different DIM instrument methodologies. ... 41
1
I. Introduction
As smart mobile embedded devices become more prevalent, the demand for their performance also rises. Limited computing resources and energy restraints have always been major design factors for these embedded mobile devices. In order to maximize performance, optimizing application and system software is often the most effective and economical approach. Since how to optimize the software is not always obvious, profiling is an essential methodology for pinpointing performance bottlenecks without introducing excessive overhead which could skew measured results. In addition to optimizing software, profiling can also be used to determine the hardware requirements when a target system software has been chosen, and assist the hardware-software co-design process.
Modern Central Processing Units today provide hardware based performance monitors [1, 2, 3]. These hardware counters are registers that gets updated by specific CPU events. Although different CPU architecture offers their own specific combination of hardware performance monitors, generally they all provide clock cycle based and cache performance related functionalities. Profiling tools, such as Oprofile [4], Gprof [5], and Google Performance Tools [6], make use of these hardware performance monitors, in order to further reduce profiling overhead.
2
selected hardware platforms in order to optimize performance. These types of specific hardware are often locked to prevent users from altering the mobile operation system, fearing it would diminish performance. However, there are still a variety of mobile operation systems that aims to support multiple architectures, such as Meamo [7] and Meego [8]. Currently the most widespread is Android [9].
Android is a fast evolving mobile platform that differentiates itself from the rest by delivering frequent version upgrades, supporting a variety of hardware devices and running applications on top of a runtime virtual machine. This Dalvik Virtual Machine is based on the traditional JAVA Virtual Machine [10], but modified to accommodate low memory requirements and allow multiple VM instances concurrently [11]. It relies on the underlying operating system for process isolation, memory management and threading support. DVM eliminates the need to recompile Android applications for different architecture that Android supports and it is an integral part of Android achieving architecture-neutrality. However, these features make optimizing Android hardware and software a more challenging task, as it becomes difficult to determine whether performance bottlenecks occurred in the virtual machine application level, the user-space libraries or deeper in the Linux kernel level.
The need for a system-wide performance analysis to accelerate the Android hardware-software co-design process has already produced many Java level trace tools, such as Android‟s own Dalvik Debug Monitor Server [12], logcat [13] and Traceview [14]. Most of the tools focus on tracing information on the DVM-level. However some of these tools approximate the time spent on Linux user-space libraries by adding instrumentations to the beginning and end of each function of a test application. By doing so, they create large operational and runtime overheads which introduce inaccuracies to the profiling results.
3
In order to make up for the lack of Linux user-space and kernel space information, Linux systems‟ profiling and tracing tools are used by Android developers along with those DVM-level specific tools. These traditional Linux profiling and tracing tools, such as LTTng [15], strace [16], ltrace [17] and Oprofile are unable to determine the relationship between Linux libraries and Java applications running inside Dalvik virtual machines, since runtime interpreted Dalvik opcode [18] segments for a DVM application are first loaded into its Dalvik virtual machine heap, then executed as the heap itself. Traditional Linux profiling and tracing tools can only see the heap being executed and can not distinguish which method is currently running. Furthermore, Android applications running inside Dalvik virtual machines are forked and controlled by the Zygote parent process. These issues create an information barrier, making it difficult for Linux user-space tools to retrieve useful information past the Dalvik virtual machine layer.
The information gap between host machine and guest virtual machine exists on most Java Virtual Machines. Various vertical profiling methods have been proposed to bridge this gap. Many of the methods are only implemented on Jikes RVM [19], which is a Java implementation of JVM, and by doing so eliminates some physical limitations of those JVM implementations on physical hosts. Others vertical profiling collects appropriate information and saves them to the file system, then modify the post-profiling analysis tool to combine collected virtual machine information and profiling samples. This creates temporal and spatial overheads on top of those already created by native Linux profiling.
To enable vertical profiling on a mobile platform with limited space and computing power, such as Android, overhead must be minimized to reduce interference to the system during execution for the sampled data to remain valuable. To achieve this goal, the following issues must be addressed.
4
Bridging the information barrier. The bridge over the DVM to Kernel space information gap should integrate into existing profiling flow. It should also be modular and avoids being overly intrusive to the host system or DVM. Since the profiler samples frequently, the information should be available in kernel space promptly after a method has been invoked by the virtual machine.
Sending useful DVM application runtime information to the profiler. Vertical profiling on the Android system requires an architecture-neutral method for retrieving and sending the least amount of relevant application information from the virtual machine to the kernel and profiler with the least amount of runtime overhead. The method must also avoid modifying each target Dalvik application for the purpose of profiling.
Correlating Dalvik application methods to profiled samples. Currently the profiler can only map a DVM application sample to the thread‟s Dalvik runtime interpreter heap. There needs to be a mapping mechanism and an algorithm to correlate addresses for the existing profiling flow to correlate samples to the application method-level.
This work proposes the Vertical Virtual Address Remapping Integrated (VARI) profiler for the Android runtime system, in which a low-overhead direct memory map address replacement tunnel, linking virtual machine to kernel, is devised to bridge the information barrier. This thesis focuses on providing techniques to send virtual memory address of Java application methods and relevant information from the Dalvik Instrumentation Module to the Memory Tunnel Virtual device. Additionally, this thesis proposes the mechanism and algorithm allowing the profiler to correlate samples to actual Java application methods, thus provides a way for performance analysis tools to tie the usage of Linux native libraries
5
with those Android applications that utilizes them. It is also this thesis‟ goal to minimize probe effect related inaccuracies. To that end, this thesis adopts a modified virtual machine event-based instrumentation approach that suits the unique process execution and stack management of Android DVM.
Furthermore, this profiler enables reconfigurable profiling by configuring the Dalvik Instrumentation Module to only send information related to the events of interest. The granularity can be classified as three levels: DVM Application method-level, DVM application level and Android service specific profiling. The proposed reconfigurable vertical profiling framework streamlines the difficult task of identifying system bottlenecks and accelerates the Android hardware-software co-design process [20].
This thesis is organized as follows. Chapter 2 surveys background and related works. Chapter 3 presents the VARI profiler architecture and the reconfigurable vertical profiling flow. Chapter 4 contains an overview of the memory map tunnel from the virtual machine to Linux kernel-space and how to instrument the Dalvik virtual machine with the Dalvik Instrumentation Module. In addition, methodologies to ensure accurate correlation between user-space samples and virtual machine applications are introduced. Chapter 5 focuses the technique to lower profiling overhead with different granularity levels. The experiment result and overhead analysis are presented in Chapter 6. Chapter 7 concludes this thesis.
6
II. Background and Related Work
In this chapter, the first section will review the system and the tool that this thesis is based on. The rest of the sections are devoted to related works on integrating Linux system profiling abilities with Java Virtual Machines.
2.1 Background
In order to enable vertical profiling on the Android platform, this thesis made modifications to Dalvik Virtual Machine and Oprofile‟s driver inside Android‟s Linux kernel. Sub-section 1 will go over the unique features of Android and DVM. Sub-section 2 will introduce Oprofile.
2.1.1 Android Platform
Android is primarily a mobile platform. It presently runs on several iterations of ARM and Intel architectures, including single-core and multi-core architectures with varies memory hierarchies. Android platform is built on top of a Linux kernel. In the pursuit of making the system more suitable for mobile devices, many modifications are made to the system, including changes to the basic Linux system libraries, such as libc and ptrace.
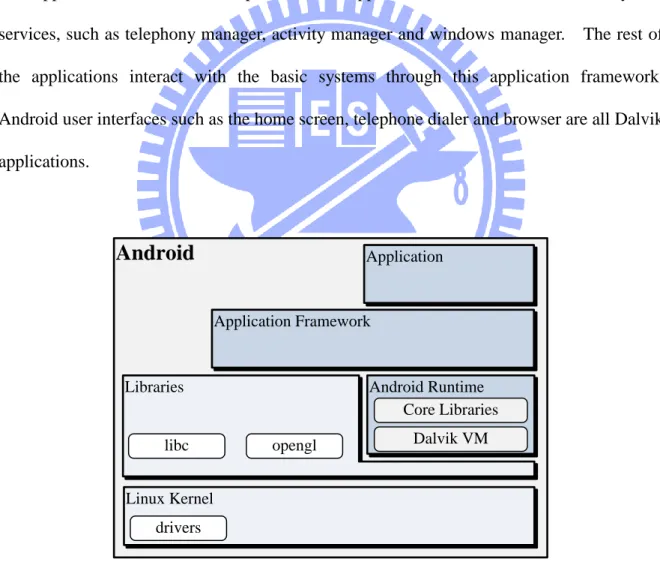
The basic Android framework is shown in Figure 1. Linux kernel and drivers are the foundation of Android framework and directly interact with the hardware. Android runtime is built as a part of the Linux system libraries which consists of the Dalvik Virtual Machine and other libraries that manages DVM thread creation and Inter-Process Communication [21, 22].
7
Although Dalvik Virtual Machine is a modified Java Virtual Machine, unlike most JVM stack machines, DVM implements a register-based design. A register-based machine uses fewer instructions, but since each instruction is longer, it also has larger code size compared to the stack machines. Aiming to reduce code size, Android redesigned the packaging format to share common code and constants between class files. The resulted dex format typically produces files less than half the size of the same code in the uncompressed JAR format [23].
Application framework is a special Dalvik application which contains android system services, such as telephony manager, activity manager and windows manager. The rest of the applications interact with the basic systems through this application framework. Android user interfaces such as the home screen, telephone dialer and browser are all Dalvik applications.
Android
Linux Kernel
Libraries Android Runtime
Dalvik VM Core Libraries Application Framework Application libc opengl drivers
Figure 1. Android architecture.
8
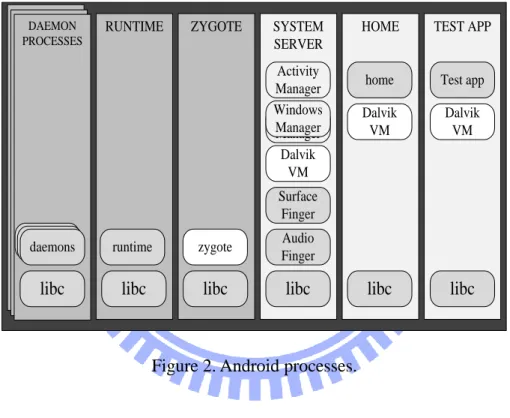
created for each instance, as shown in Figure 2 [24]. A process called Zygote monitors the application initiation and forks it into a new thread when it is ready. Thus, modifications for the virtual machine event-based instrumentation should focus on Zygote and the Dalvik virtual machine. Traditionally, the more important events would be Zygote forking a new thread, Dalvik virtual machine undergoing method creation or garbage collection, new frames being pushed or popped on the thread stack, and other memory related events.
DAEMON PROCESSES
RUNTIME ZYGOTE SYSTEM SERVER
HOME TEST APP
libc libc libc libc libc libc
daemonsdaemonsdaemons runtime zygote
home Test app Dalvik VM Dalvik VM Dalvik VM Audio Finger Surface Finger Activity Manager Package Manager Windows Manager
Figure 2. Android processes.
2.1.2 Oprofile
Oprofile is a system-wide profiler for Linux systems, capable of profiling Linux programs in execution at low overhead. It consists of a kernel driver and a daemon for collecting sample data, and several post-profiling tools for turning data into information. Oprofile utilizes hardware performance counters of different architectures to sample both user-space and kernel-space usage data. Using Oprofile, developers can avoid dramatically
9
affecting accuracy by adjusting sampling frequency to minimize overhead. At the same time using hardware counters further reduces overhead [25].
Android Platform
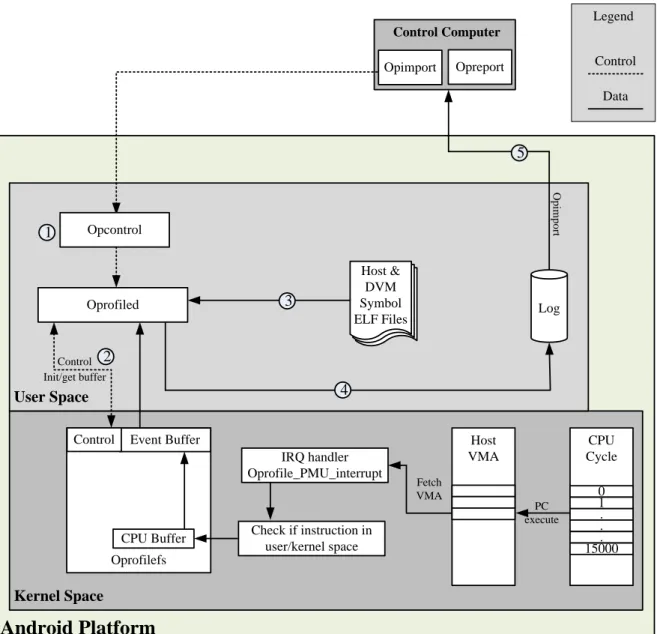
Kernel Space PC execute IRQ handler Oprofile_PMU_interrupt User Space Oprofiled Log Control Computer O p im p o rt Opreport Host VMA Check if instruction in user/kernel space Opimport Legend Data Control Oprofilefs CPU Buffer Event Buffer Control Fetch VMA Control Init/get buffer 1 CPU Cycle 0 1 . . . 15000 Host & DVM Symbol ELF Files Host & DVM Symbol ELF Files Host & DVM Symbol ELF Files Opcontrol 2 3 4 5Figure 3. Profiling flow of Oprofile provided by the Android source code.
The most recent official Oprofile release includes a JIT extension which provides several tools to relay information of JIT‟s dynamic compiled code from a compatible Java virtual machine to the kernel. However, due to the design differences between Java virtual
10
machines and Dalvik virtual machine, the implementation is not functional on Android. It is also not included in the version of Oprofile that comes with Android source code.
Figure 3 illustrates the profiling flow of the Oprofile version included in Android source code. To initiate profiling, Opcontrol first setups sampling frequency and assigns hardware performance counters of interest ○1 . Opcontrol then initiates the Oprofile daemon and sampling begins. Oprofile daemon will halt the system for a short period to empty and process sampled data in the event buffer when the buffer is almost full ○2 .
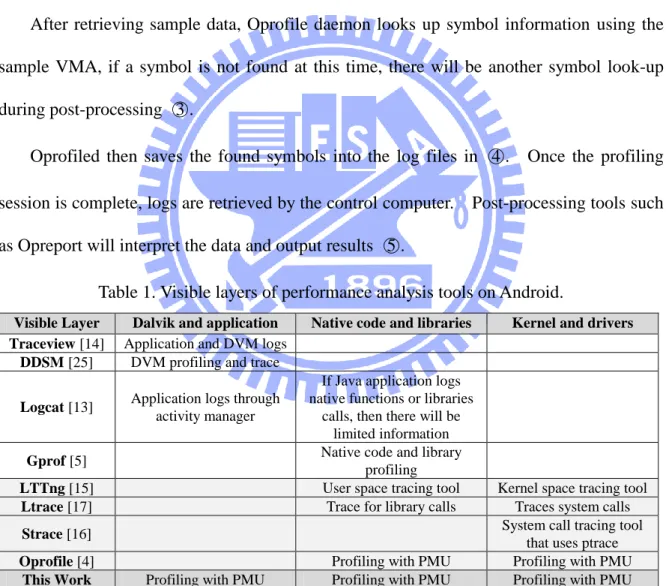
After retrieving sample data, Oprofile daemon looks up symbol information using the sample VMA, if a symbol is not found at this time, there will be another symbol look-up during post-processing ○3 .
Oprofiled then saves the found symbols into the log files in ○4 . Once the profiling session is complete, logs are retrieved by the control computer. Post-processing tools such as Opreport will interpret the data and output results ○5 .
Table 1. Visible layers of performance analysis tools on Android.
Visible Layer Dalvik and application Native code and libraries Kernel and drivers Traceview [14] Application and DVM logs
DDSM [25] DVM profiling and trace
Logcat [13] Application logs through
activity manager
If Java application logs native functions or libraries
calls, then there will be limited information
Gprof [5] Native code and library
profiling
LTTng [15] User space tracing tool Kernel space tracing tool
Ltrace [17] Trace for library calls Traces system calls
Strace [16] System call tracing tool
that uses ptrace
Oprofile [4] Profiling with PMU Profiling with PMU
This Work Profiling with PMU Profiling with PMU Profiling with PMU
Presently, Oprofile can not correlate native code, Linux libraries or kernel space events with Dalvik application events. Moreover, the JIT extension tools have not been integrated
11
into DVM, nor does Android source code include the JIT extension tools. There are other performance analysis tools that Android provides in its source code, as shown in Table 1. They all specialize in providing information for one or two layers in the Android architecture, but none of them can bridge the information gap created by the virtual machine.
2.2 Opcode Instrumentation
Native code instrumentation, opcode instrumentation and binary instrumentation are the three common approaches to alter a virtual machine for the purpose of providing further debugging information.
Opcodes are known as bytecode for Java Virtual Machines because most JVM opcodes are one byte in length due to the fact that most JVMs are stack machines. Bytecode instrumentation monitors runtime generated Java bytecodes. As the result of DVM not employing standard Java bytecodes, standard Java debugging or profiling tools do not work on Android, at least not without significant modification [26, 27]. In addition, most bytecode instrumentation methodology examines every bytecode generated at runtime, thus introduces greater overhead.
2.2.1 JVMTI
JVMTI stands for Java Virtual Machine Tool Interface [28]. It was developed by Sun Microsystems, now owned by Oracle. It offers dynamic bytecode instrumentation functionality which allows users to profile for information, add breakpoints and even make changes to the opcodes of Java methods. These JVMTI functions are made possible by adding events to the code of a method, for example, adding a call to methodEntered() at the
12
beginning of a method. The inserted code is standard bytecodes, which JVM treats as a part of the application [29]. Although these additions do not modify application state or behavior, they introduce additional overhead to the original application. To sum up, JVMTI is a great Java debugging tool but perturbs the original application when utilized as the backend of a profiler.
2.3 Native-code Instrumentation
Native-code instrumentation entails instrumenting virtual machine‟s native source code. Usually native-code instrumentation is event-based and delivers application information to the performance analysis tool when specific virtual machine events take place [31, 32, 33, 34].
2.3.1 VIProf
VIProf extends Oprofile to enable integrated profiling across the virtual layers of a system [34]. The VIProf architecture modifies Oprofile to re-label samples that belongs to the Java heap as a substitute file. The application‟s method information is collected by instrumenting Jikes RVM‟s method compile, recompile and flags GC move method. VIProf is implemented on Jikes, which produces a static image in a Jikes internal format and an associated map. VIProf is able to modify Oprofile post processing tool to associate samples with static image produced by Jikes.
Most native-code instrumentation methodologies and Javana mentioned below are implemented on Jikes RVM. Jikes is a Research Virtual Machine, which is a JVM implemented as a Java runtime application. The issue with employing Jikes is that it is designed to be flexible. There is a MAGIC class defined in Jikes‟ compiler which allows
13
users to implement machine code and interact with system memory [35]. Barriers imposed by regular virtual machines are easier to circumvent on Jikes if functionalities like MAGIC are utilized.
2.4 Binary Instrumentation
Binary instrumentation modifies the interpreter of a virtual machine to monitor for codes of interest. When an interested native instruction occurs, the modified code utilizes special native instructions to deliver stack information relevant to the monitored instruction. These special native instructions can also be dynamically inserted to trigger profiling [36].
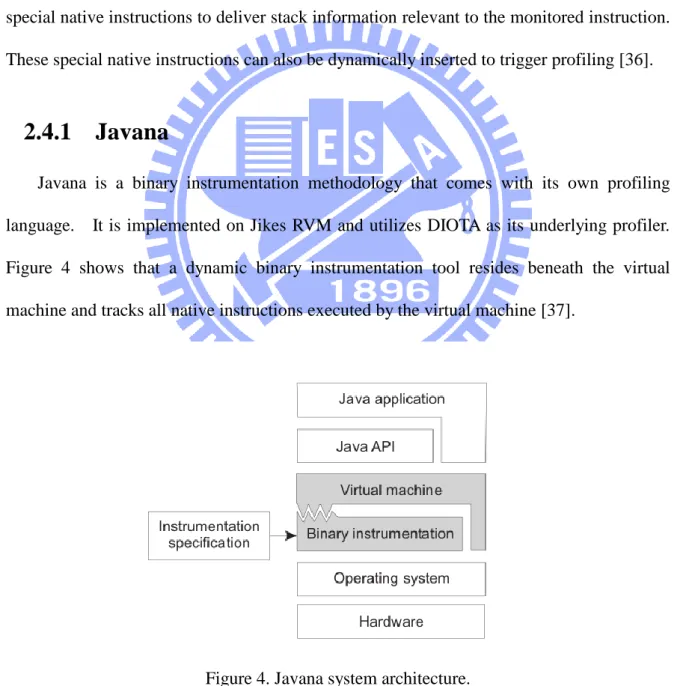
2.4.1 Javana
Javana is a binary instrumentation methodology that comes with its own profiling language. It is implemented on Jikes RVM and utilizes DIOTA as its underlying profiler. Figure 4 shows that a dynamic binary instrumentation tool resides beneath the virtual machine and tracks all native instructions executed by the virtual machine [37].
14
The binary instrumentation needs to keep track of events, such as thread creation, thread switching, thread termination, class loading, object allocation, object relocation, method compilation, garbage collection and etc. Similar to other binary instrumentation methods, tracking all native instructions introduces considerable overheads.
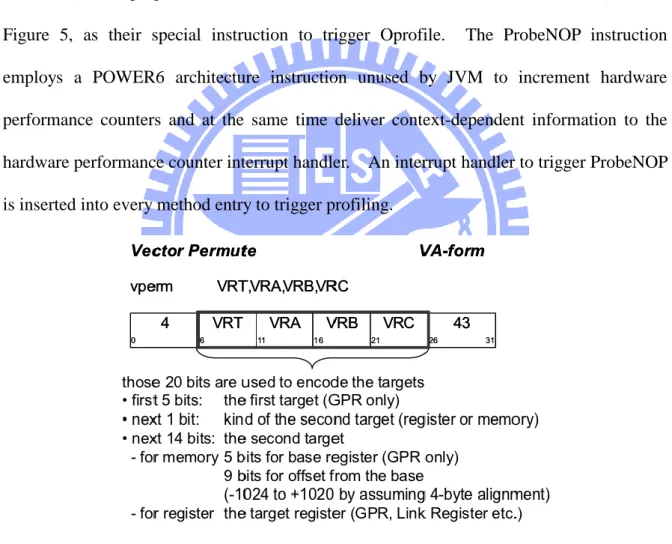
2.4.2 ProbeNOP
Inoue, et al. [38] utilized an unused instruction in the POWER6 architecture, seen in Figure 5, as their special instruction to trigger Oprofile. The ProbeNOP instruction employs a POWER6 architecture instruction unused by JVM to increment hardware performance counters and at the same time deliver context-dependent information to the hardware performance counter interrupt handler. An interrupt handler to trigger ProbeNOP is inserted into every method entry to trigger profiling.
Figure 5. ProbeNOP format using POWER6‟s vector permute instruction.
The draw back of native code instrumentation is that duplication of efforts is required when applying to different architectures. Some architecture might not have an unutilized instruction to act as the special NOP function. These factors make binary instrumentation
15
less ideal for the Android platform.
2.5 Comparison of Vertical Profilers
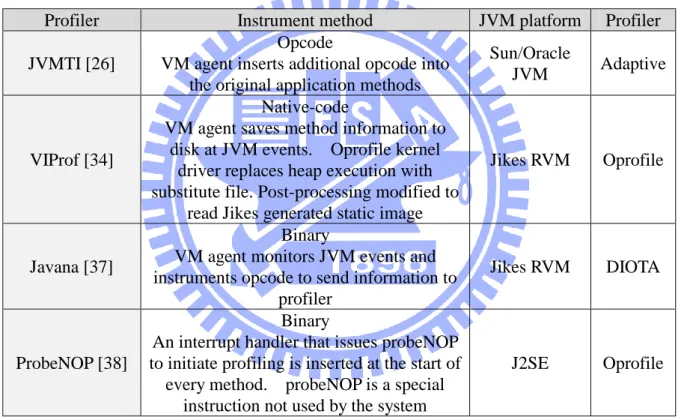
Table 2 compares the instrumentation methods of the works introduced above. Each work provides distinctive benefits to profiling integration on JVM. However, they all have design aspects that are incompatible with the unique designs of DVM.
Table 2. Comparison of vertical profiling instrumentation methods.
Profiler Instrument method JVM platform Profiler
JVMTI [26]
Opcode
VM agent inserts additional opcode into the original application methods
Sun/Oracle
JVM Adaptive
VIProf [34]
Native-code
VM agent saves method information to disk at JVM events. Oprofile kernel
driver replaces heap execution with substitute file. Post-processing modified to
read Jikes generated static image
Jikes RVM Oprofile
Javana [37]
Binary
VM agent monitors JVM events and instruments opcode to send information to
profiler
Jikes RVM DIOTA
ProbeNOP [38]
Binary
An interrupt handler that issues probeNOP to initiate profiling is inserted at the start of
every method. probeNOP is a special instruction not used by the system
16
III. Memory Tunnel Vertical Profiling
This chapter will go over design challenges faced by this thesis, and then explore the purpose and benefits of the proposed memory tunnel between the Dalvik virtual machine and Linux kernel-space. It will be followed by descriptions of this work‟s general architecture and adaptation of the memory tunnel into oprofile‟s existing profiling flow.3.1 Design Challenge
This work picked Oprofile as the profiling tool because it utilizes hardware performance counters to achieve low overhead sampling. However, to make use of this advantage brought by Oprofile, the experiment environment has to run on a CPU with hardware performance counters. Implementing vertical profiling on a physical Android platform means there is no bypassing of issue created by hardware restrictions.
3.1.1 How to Instrument Dalvik Virtual Machine
Investigating how and where to instrument Dalvik virtual machine is crucial, because the accuracy and validity of the profiling results depend on instrumenting DVM appropriately. This work investigates the traditional JVM instrumentation methodology and how DVM behaves differently in order to find a strategy that introduces the least overhead.
3.1.2 How to Reduce Profiling Overhead
17
many time-sensitive real-time applications under hardware limitations such as computing power, energy, memory, and data storage. Therefore, minimizing overhead introduced by vertical integration is critical. This thesis explores the effects of both temporal and spatial overhead and steps to reduce them.
3.1.3 Porting Profiling Tools to Android
The Oprofile source code included with Android is modified to adapt to the differences between Android‟s Linux kernel and regular Linux systems. As a result, Oprofile provided by Android is older in version and stripped of newer features that are needed for the proposed communication flow. To accomplish the proposed profiling framework, this work ported the official Oprofile, version 0.9.6, and a few other Linux components that are required to run with this version of Oprofile, such as Sed and Awk, to the test system.
3.2 Memory Tunnel
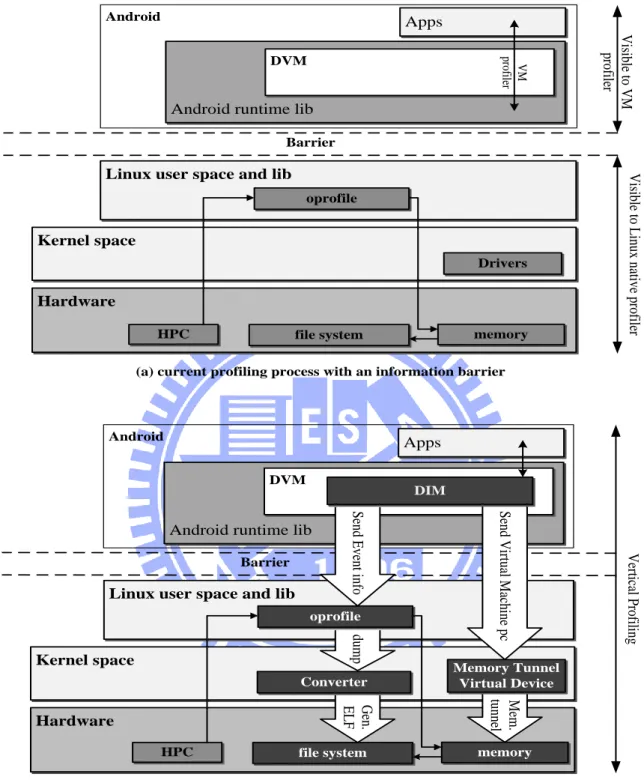
Android and other traditional Java virtual machine behaves as illustrated in Figure 6 (a). Opcodes are first interpreted into assembly code at runtime. They are then loaded into the heap memory section of the DVM Linux process map and directly executed from there. As a result, the actions inside the DVM process, such as which application method is currently being executed, will be hidden from profilers in Linux user-space or kernel-space. Consequently, currently Java-based and Linux-based Profilers have to be run separately. Developers have to rely on trace correlation to see how virtual machine applications interact with the Linux system.
18
Barrier
Android Apps
Android runtime lib DVM
Linux user space and lib
oprofile Kernel space Hardware V er tic al P ro fil in g S en d V irt ua l M ac hin e p c S en d E ve nt in fo Apps
Android runtime lib
Linux user space and lib
Kernel space Hardware V isi ble to V M pr of ile r V isi ble to L in ux n ati ve p ro fil er Barrier
(a) current profiling process with an information barrier
(b) bridging the barrier with even-based instrumentation Android Converter memory file system HPC du m p G en . E L F DIM M em . tu nn el Memory Tunnel Virtual Device oprofile memory file system HPC Drivers DVM V M pr of ile r
Figure 6. Vertical profiling flow on Android runtime.
In the proposed vertical profiling flow in Figure 6 (b), a debugfs virtual device module is first loaded in the kernel-space before profiling begins. When application initiates, each
19
DVM process opens a virtual file in their memory map so that each virtual file corresponds to the PID of respective DVM.
Dalvik Instrumentation Module, which will be discussed in further detail in chapter 4, looks up a method‟s Virtual Memory Address during virtual machine events, such as method invocation, subsequently forwards the VMA of this method to the kernel-space debugfs‟ virtual device file. This is the main implementation of the memory tunnel. The modified Oprofile driver device will monitor the pmnc (Performance Monitor Control) interrupt and replace current sample‟s VMA when memory tunnel changes the virtual device file‟s value from 0 to a VMA. After the replacement, the rest of the flow inside kernel-space remains unchanged from original Oprofile.
3.3 VARI profiler Architecture and Profiling Flow
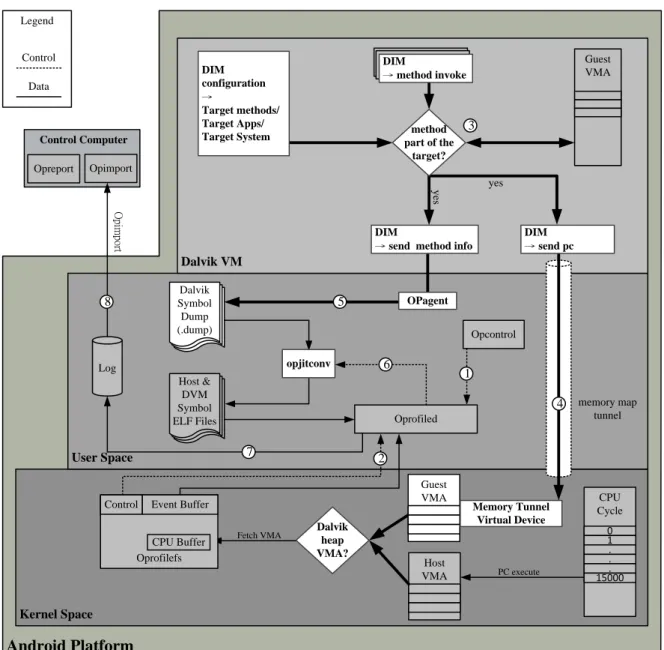
Figure 7 describes the architecture of the proposed Virtual Address Remapping Integrated profiler. Dotted line represents control signal. Solid line represents data flow. To distinguish from Oprofile‟s architecture, the proposed changes and new components of VARI profiler are highlighted in white. VARI profiler employed some components from Oprofile‟s JIT extension, namely opagent and opjitconv. Oprofile‟s JIT extension is comprised of a set of tools for users to implement into compatible JVMs.
The major differences between VARI profiler and the original Oprofile flow are derived from DIM instrumentations, the memory map tunnel virtual device, and the memory replacement algorithm in oprofile‟s kernel driver. The VARI profiling flow is as follows.
After Opcontrol initiates profiling in ○1 and ○2 , the target application initiates and creates a DVM process. When the DVM process begins invoking methods after initiation, DIM looks up the method‟s VMA, which is the VMA of the dex file in the process map plus
20
an offset, then gathers relevant information ○3 .
Android Platform Kernel Space PC execute User Space Oprofiled Opcontrol Log Control Computer Opimport Dalvik VM Guest VMA DVM → EventsDVM→ Events Opreport Fetch VMA yes y es memory map tunnel Host VMA Legend Data Control O pim po rt Host & DVM Symbol ELF Files Host & DVM Symbol ELF Files Host & DVM Symbol ELF Files Oprofilefs CPU Buffer Event Buffer Control CPU Cycle 0 1 . . . 15000 Host & DVM Symbol ELF Files Host & DVM Symbol ELF Files Dalvik Symbol Dump (.dump) Guest VMA DIM → method invoke opjitconv OPagent Memory Tunnel Virtual Device DIM configuration → Target methods/ Target Apps/
Target System part of the method
target?
DIM
→ send method info
Dalvik heap VMA? DIM → send pc 1 2 3 4 5 6 7 8
Figure 7. VARI profiler architecture.
DIM sends the retrieved method VMA through the proposed memory map tunnel to a designated kernel space virtual device ○4 . The virtual device file only contains a valid VMA when a DVM application method is invoked. Once Oprofile‟s kernel driver receives a pmnc (Performance Monitor Control) interrupt, and the modified driver determines this
21
sample belongs to a Dalvik method, the sample VMA is replaced with the VMA in the virtual device file.
DIM then saves the current method name, method VMA and size into a dump file through opagent. Since each individual Android application has its own PID, each application‟s PID is used as a unique identifier for the dump file, e.g. 1234.dump ○5 . Once the profiling is complete, Oprofile daemon calls opjitconv which converts the saved dump files into ELF symbol files. These ELF files contain only the relevant symbol information for Oprofile to correlate samples to Android applications ○6 .
The original Oprofile JIT extension expects that Oprofile will be unable to find symbols of Java applications samples and resort to labeling them as anonymous. Due to Dalvik‟s process management, Oprofile actually identifies these samples as Dalvik heap or Dalvik JIT code cache execution, part of the Android shared memory process (ashmem). In step 4, DIM and Oprofile kernel driver modifications replaced Dalvik method samples with a new VMA to avoid this issue.
At this point, the ideal behavior is for Oprofile daemon to process these ELF files as it would do with regular Linux processes and saves the logs in the file system. However, these replacement VMAs actually point to application dex files on the DVM process memory map, and not the ELF symbol files.
Oprofile daemon saves samples to logs in ○7 , which are retrieved along with the ELF information file in ○8 . Oprofile‟s post processing tools are used to analyze results. The method used to resolve replacement VMAs not pointing to the actual substitute ELF symbol file will be addressed in the next chapter.
22
IV. Dalvik Instrumentation Module
The Dalvik Instrumentation Module is an agent added to DVM for the purpose of retrieving application information within the virtual machine. The DIM is aimed to be architecture-neutral; Therefore this work avoids instrumenting the assembly portion of the DVM‟s opcode interpreter. The applied instrumentation methodology determines accuracy of the final profiling result. This chapter examines instrumenting DVM with the traditional Java instrumentation methodology and how to lower overhead based on DVM‟s distinctive features.
4.1 Retrieving Application Information
This work uses Oprofile as the backend profiler, therefore DIM needs to gather application information which Oprofile can use to correlate the hardware performance counter samples. DIM needs to provide two separate sets of information through two different channels.
4.1.1 Handling Method VMA
To gather sample data, Oprofile retrieves a VMA, PMU sample pair in kernel-space. Without the memory tunnel address replacement methodology, any Dalvik application sample‟s VMA will fall within the range of Dalvik heap, or JIT code cache in Android‟s Anonymous shared memory (ashmem). To enable vertical profiling, DIM needs to send the VMA of the upcoming to be executed method through the Memory Map Tunnel into the debugfs virtual device file. This work modified Oprofile‟s kernel driver, so before logging a sample into oprofilefs‟ CPU buffer, the driver checks with the virtual device file to see
23
whether this is a DVM sample. The value of the debugfs virtual file is 0 for non-DVM samples, otherwise it contains the Dalvik method‟s VMA. In the later case, the VMA of the Dalvik-heap or JIT-code-cache will be replaced by the VMA stored in the virtual file. Now, when Oprofile daemon retrieves the VMA sample pair from oprofilefs, it will map to the dex file which the method came from. Even though the samples are now able to link back to their own dex file, they cannot be traced back to a method because dex file contains Dalvik opcodes, and currently Oprofile only processes ELF format symbol files. To correlate samples to the correct Dalvik application methods, a technique is required for Oprofile to link samples to a substitute symbol file.
4.1.2 Generating Substitute Symbol File
To resolve this issue, DIM needs to provide method name, method VMA, and method code size to an ELF format skeleton symbol file. This work utilizes opagent and opjitconv from Oprofile‟s JIT extension to write the dump file. When target application initiates, it creates an empty substitute symbol file with jo as its extension, named by the application process PID, for instance 1234.jo, and allocates it in the DVM‟s memory map.
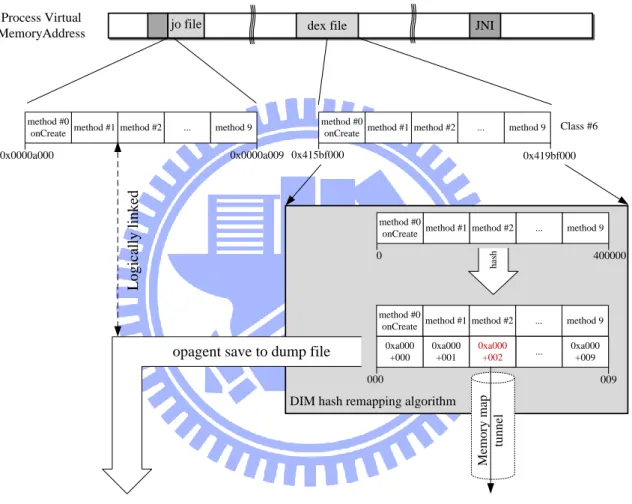
This file‟s mapped address is different from the dex files, hence before DIM sends a method‟s VMA through the memory map tunnel, it will need to recalculate the method‟s new location on the jo file location. The simplest way to do so is to shift all the address by the offset between substitute symbol file‟s address and the address where the dex file is mapped to. If there are more than one dex file in an application‟s memory map, they will also be mapped to the same substitute file with an updated offset to last entry of the file.
The issue with the previous methodology is that since the substitute ELF file contains only the method name and the address, most of the space allocated is wasted. Larger
24
applications could cause allocated section to overflow. Figure 8 shows the remapping algorithm used to reduce memory necessary for mapping the substitution ELF file. A hash table is generated to reduce overhead of looking up the method‟s substituted address during runtime before sending the method VMA through the memory map tunnel.
0x415bf000 0x419bf000
jo file
Class #6
0x0000a000 0x0000a009
DIM hash remapping algorithm
0 400000
Process Virtual
MemoryAddress dex file JNI
h as h 0xa000 +009 ... 0xa000 +002 0xa000 +001 0xa000 +000 000 009
opagent save to dump file method 9
... method #2 method #1 method #0
onCreate method #1method #2 ... method 9
method #0 onCreate method 9 ... method #2 method #1 method #0 onCreate method 9 ... method #2 method #1 method #0 onCreate 0xa000 +002 M em o ry m ap tu n n el L o g ic al ly l in k ed
Figure 8. Generating hash replacement address symbol file.
Ideally, this substitution ELF file is generated by utilizing functionalities provided by opjitconv during runtime from the dump file provided by DIM. However, since symbol searching is carry out again during post-processing by Oprofile analysis tools such as opreport and opannotate; It is not necessary to create this extra overhead. Instead, the dump file will be converted into the ELF format and saved as PID.jo when profiling
25
concludes. Given that there is no longer a need for mapping the actual ELF substitution file to the process‟ virtual memory during runtime, the size of the dump file on the file system is relatively trivial. Therefore by not using the previously mentioned runtime hash remapping methodology actually reduces overhead. However, the hash remapping methodology can still be used to keep track of dynamically compiled methods generated by Android‟s new Just-in-time compilation capabilities. Aside from Android‟s JIT functionalities, the hash remapping method can also be used to adopt VARI profiler to stack machine JVMs.
4.2 Method Invoke Instrumentation
Traditionally, JVM instrumentation for vertical profiling takes place whenever an address has changed. Since typical JVM machines are stack machines, the allocation of a Java method‟s VMA is not known until the interpreter invokes the method. When the stack frame is full, garbage collection and other memory relocation functions also modifies the method‟s address. Therefore, implementing vertical profiling requires instrumenting every JVM function that would alter the memory allocation, such as method compilation, method recompilation, method relocation, garbage collection and etc.
In case of the register based DVM, stack frames also undergoes garbage collection, however, since the dex files are mapped onto the process memory map, the addresses are fixed as long as the process remains running. As a result, method VMA retrieved by DIM remains the valid method address for the duration of profiling. When DVM invokes a method, it loads a section of the mapped dex file starting from the VMA where the method‟s beginning opcode is located.
26
DIM instrumentation captures this action and sends the starting VMA of the invoked method through the memory map tunnel. To ensure DIM instruments all method invocation‟s final entries points, this work examined DVM opcode interpreter‟s assembly file. There are four types of method invocations, this work traced the interpreter back to where these invocations instructions are issued in the DVM native code, and then inserted the DIM instrumentation. The flow of DIM retrieving VMA for methods being invoked is show in Figure 9. The DIM component responsible for delivering VMA through the memory map tunnel is not shown in the figure.
Dalvik Instrumentation Module
Process Virtual Memory Address
0x00008000 0x0000a000 0x00214000 0x415bf000 0x419e7000 0xacb4e000 0xaca00000 dex file: jo file: JNI libc.so: app_process: heap: DVM loads entire dex file from the
memory map
OPagent
1
3
2
I/O access required during runtime for each method invoked
DVM
→ EventsDVM→ EventsInvoke Method
DVM interprets dex opcode into assembly code
Load method from dex virtual methods 1 2 3 4 5 ... n direct methods 1 2 3 4 5 ... n
27
1. DVM will maintain an array of every method and each method‟s dex file process map VMA.
2. When a method is invoked, the interpreter retrieves opcodes of the method from the VMA and loads the interpreted code into the heap. For each method invoked, DIM sends method name and VMA to a dump file through opagent. When a JNI method is invoked, DIM only sends the init method through opagent. When Dalvik-heap executes the JNI call, they are processed by Oprofile as regular Linux user-space execution.
3. By instrumenting method invocation, every method invocation requires additional I/O operations to write the dump file.
The benefit of instrumenting method invocation is that only the information of those method used will be saved, thus reducing the spatial overhead for dump file and the generated substitute ELF file. For mobile devices, sample log files can use up limited storage space quickly. However, I/O operations in step 3 are costly, even if the dump file does not need to be converted into ELF format during runtime. Furthermore, the benefit of reducing spatial overhead is eliminated if most of the methods are invoked during profiling.
4.3 Load Method from dex Instrumentation
Due to DVM‟s design to load dex files into its process virtual memory map, except for the new JIT functionality, VMA of a pre-interpreted method is known before it is invoked. At a Dalvik application‟s initiation, DVM will store the VMA of every method from a dex file into an array. Instead of instrumenting actual method invocation, DIM can write the name and VMA of every method in the dex files into the dump file before the application is executed. This methodology combines previous technique‟s multiple I/O operations
28
during runtime into one single writes operation to the dump file at the initiation of the application. Aside from a slightly slower application start time, which does not affect the profiling results, this methodology reduces overhead introduced by vertical profiling.
Dalvik Instrumentation Module
Process Virtual Memory Address
0x00008000 0x0000a000 0x00214000 0x415bf000 0x419e7000 0xacb4e000 0xaca00000 dex file: jo file: JNI: app_process: heap: DVM loads entire dex file from the
memory map
Send symbol information
DVM
→ EventsDVM→ EventsInvoke Method
DVM interprets dex opcode into assembly code
only once per dex file
OPagent
1 2
3
Load method from dex virtual methods 1 2 3 4 5 ... n direct methods 1 2 3 4 5 ... n
Figure 10. Instrumenting when DVM loads every method of a dex file.
Figure 10 shows the change in DIM flow. While step one remains the same, before methods are invoked, in step 2 DIM sends information for every method to opagent when an application initiates. DVM doesn‟t begin invoking methods until it has completed loading methods into the array in step 3, therefore this instrumentation does not impact the profiling result during runtime.
29
4.4 Profiling Flow with Load Method Instrumentation
Figure 11 shows the modified VARI profiling flow after switching to instrument DVM loading every method from dex files at application initiation and adding hash address replacement. The highlighted portion shows component changes. New components are in bold. Android Platform Kernel Space PC execute User Space Oprofiled Opcontrol Log Control Computer Opimport Dalvik VM DVM → EventsDVM→ Events Opreport Oprofilefs CPU Buffer Event Buffer Fetch VMA Memory Tunnel Virtual Device Dalvik heap VMA? memory map tunnel Host VMA Guest VMA Control Host & DVM Symbol ELF Files Host & DVM Symbol ELF Files Host Symbol Files Legend Data Control O pim po rt CPU Cycle 0 1 . . . 15000 DIM → Method Invoke DIM configuration → Target methods/ Target Apps/ Target System Method part of the target? yes Guest VMA e
Get current VMA
DIM →
JIT Method Invoke
DIM→ send pc OPagent DIM → Load method from dex A opjitconv Host & DVM Symbol ELF Files Host & DVM Symbol ELF Files Dalvik Symbol Dump (.dump) Host & DVM Symbol ELF Files Host & DVM Symbol ELF Files Guest Symbol Files DIM→ hash lookup C D DIM→
generate hash addr. B
30
A. DVM loads every method from application dex files during application initiation. DIM gathers information for all methods and saves it to a dump file via opagent. B. Hash address replacement is only generated to keep track of methods dynamically
compiled by JIT compiler. The generated address is stored in DIM as a hash table for faster lookup. Maximum hash lookups take O(n) time. The generated replacement VMA is sent through the memory tunnel and to the dump file along with method name.
C. For profiling flow that incorporates the hash remapping methodology, reused methods only needs to look up the hash table for their original translated address. In that case all methods will be mapped to the substitute ELF format jo files. Regardless of whether the current method VMA is replaced by the hash lookup, DIM sends it to the kernel space virtual device through the memory tunnel.
D. The dump file created in step A is converted into the substitute ELF file with a jo extension. This substitute ELF file is the guest symbol file. To reduce overhead, this ELF file is generated post profiling. It is only logically mapped to the dex files on the process virtual memory map. However, to enable JIT compiled methods, process needs to logically memory map the jo file, because there is no jo file already allocated on the process virtual memory map like the dex files.
4.5 Memory Allocation and Correlation
The goal of this thesis is to associating DVM methods and Oprofile samples. After executing a profiling flow, post processing needs to correlate the dump files and the Oprofile profiling results. The dump file containing information of DVM methods is not
31
converted to ELF format during runtime in order to minimize overhead. Therefore, at the end of profiling, substitute ELF format symbol file is generated using opjitconv of Oprofile‟s JIT extension. The result is an ELF format skeleton file named by process PID with jo as its extension. This work accomplishes post-processing correlation without making changes to Oprofile‟s post processing tools, such as opreport and opannotate.
VMA of a DVM
source code
0x00008000 0x0000a000 0x00214000 0x415bf000 0x419e7000 0xacb4e000 0xaca00000 /system/bin/app_process /data/oprofile/jitdump/pid.jo /data/dalvik-cache/ system@[email protected]@classes.dex /system/lib/libdvm.so CallMethodV() { if(method.status) interpreter(); else CALL_JNI(); }
Public class GetX() { private int x; provate int y; public return_x(); ... } Init(); hitTestBall(); hitTestBallOverRange(); onTouch(); setApp();
int main(int argc, const char* const argv[])
{ … }
32
Figure 12 shows the virtual memory map of a DVM process as well as how jo and dex files are allocated. On the left is a process‟s sample virtual memory allocation map. On the right is the type of information a profiler can retrieve if the sampled data can be linked to the contents of that segment. The second segment is the jo file, which consist of the content of the DIM dump file. It is capable of method level correlation. By spending additional time and saving extra information to the dump file during runtime, DIM can provide the line number where the method is called within the Java file. The third segment is a dex file and it is capable of source line level correlation, but Oprofile does not have the capability to analyze dex files.
4.5.1 Without Hash Replacement Address
Without the presence of JIT compiler, it is not necessary to replace a method‟s address allocated with its dex file of origin. Consequently, the jo allocation in the process map is not required. While the actual dex files are not ELF format symbol files, once the Oprofile samples and the jo file are pulled to the control computer, the jo files can be renamed as the dex files. Oprofile post processing tools will treat these duplicated and renamed jo files as the original dex files containing ELF symbols. This is the profiling methodology that introduces the least amount of overhead during application runtime.
4.5.2 With Hash Replacement Address
The hash replacement address mechanism is useful for keeping track of dynamically compiled methods from JIT. In this case, the process virtual memory map has to allocate a section of virtual memory for the jo file, to ensure address generated by the replacement
33
algorithm will not create a conflict with other allocations. By remapping both the JIT compiled and interpreted methods into the address range of the jo file, no renaming is required during post processing. Oprofile‟s post process analysis tools will search for the symbols for DVM related symbols within the jo file. But in comparison, renaming the jo file post profiling process is still the methodology that introduces the lowest runtime overhead.
34
V. Reduce Overhead with
Reconfigurable Profiling
The proposed Dalvik instrument module modifies the DVM to gather information for every method invoked. Due to the fact that Android platform‟s system services and user interface are all essentially special Dalvik applications, modifications made by DIM will also gather information from these Android system services unless specified not to. The mechanism implemented to profile only desired components can also be utilized to achieve reconfigurable profiling and reduce undesired profiling overhead.
5.1 Reconfigurable Vertical Profiling
DIM employs two techniques to achieve reconfigurable profiling. For finer granularity, DIM can be set to only write information for specified methods from the profiling target method list to the dump file. For larger granularity, DIM can be configured to only profile DVM process of an application by checking the process command line, which is the equivalent of Java package name.
5.1.1 Configurability
Hard-coding the desired application to profile will require recompilation of the entire Dalvik virtual machine every time a new application needs to be profiled. A configuration file informing DIM which application or methods to profile avoids having to recompile DVM. This configurability can be provided by modifying a simple text file. Tool with
35
user interface helps users quickly select a set of targets, such as the system services which consist of a group of methods.
5.2 Profiling Granularity
By utilizing the two granularity configurations and combining a set of targets, DIM can further reduce instrumentation overhead by triggering vertical profiling flow only for user‟s profiling target. Such measures reduce the overhead of writing unnecessary information to the file system when the developer only wants to track down bottlenecks in a specific application or a section of code.
5.2.1 Method-level Profiling
If the user knows the bottleneck exists within a specific method, DIM can be set to send information only for the specific method and its children. Line information can also be attached to the method name with extra lookup time. This works best with large methods with a heavy workload. It will avoid I/O interference from instrumenting other unwanted methods.
5.2.2 Application-level specific
This allows DIM to trigger profiling flow only for specified applications. Users can first use this granularity to identify which method is the bottleneck before switching to finer method-level granularity for more accurate profiling results. It avoids measurement perturbation by I/O operations from instruments of other applications.
36
5.2.3 Service specific-level profiling
By combining several method-level or application-level configurations, DIM can provide a better picture of specific events, for example, combining methods from the system server DVM process to evaluate video performance. By only writing the dump files of Android‟s System Service process to the file system, Oprofile daemon can organize samples by system services. Services specific profiling can identify power hotspots and point to possible causes.
5.3 Extend Reconfigurability to Context-sensitive
Profiling
This thesis originally intended to bring context-sensitive profiling to the Android platform. Due to time constraints, the framework for achieving context-sensitive profiling is put in place, but context-sensitive profiling has yet to be implemented. Reconfigurability is only the first step to enabling context-sensitive profiling. Further work on opcode instrumentation is required for true context-sensitivity. Dalvik Instrumentation Module will need to intercept an instruction fetch from the DVM interpreter, and call a predefined macro to send information through the Memory Tunnel after verifying the instruction is a target of interest. Users can target a specific instruction such as OP_IF_LT to monitor the performance of for loops.
37
VI. Experimental Results
Testing is conducted on Beagleboard Rev. C development board running Android 2.3 Gingerbread. Android 2.3 is the newest available version on this development board and incorporate a JIT compiler. Beagleboard development board only differs from commercial mobile devices in that the root file system is not loaded into the ROM, but instead resides on a special SD card partition.
Table 3. Testing platform. Development Board
Beagleboard Rev. C4
CPU OMAP3530DCBB72 720MHz
CPU Arch. CPU: ARM V7
POP Memory Micron
2Gb NAND (256MB) 2Gb MDDR SDRAM (256MB)
Table 4. Experimental environment. Experimental Environment Android 2.3 Gingerbread Kernel 2.6.29-00261 Compiler gcc version 4.4.0 Oprofile 0.9.6 Benchmarks Newton‟s Cradle [39]
0xBench Math [40] Linpack [41]
Scimark2 [42] 0xBench VM [40]
6.1 DIM Mapping Results
The next two tables illustrate how results from the Dalvik Instrumentation Module can be correlated to symbol files mapped to the process virtual memory map. Table 5
38
demonstrates the capability of DIM. DIM is able to retrieve information for a method‟s virtual machine program counter, VMA, method name, Java class description, the name of its source Java file and the line number of the method in source file. Table 6 is the process memory map for the test application.
Table 5. DIM instrumented results of Newton‟s cradle. VMA can trace back to the line number of source Java file. PC VMA Method Name Class Description Source File
Name Line#
6 0x42729240 run Ljava/lang/Runnable; ViewRoot.java 2044 636 0x43966df0 atan Ljava/lang/Math; BallsView.java 616
725 0x254608 native_drawBitmap Landroid/graphics/Canvas; Canvas.java -2
The first method, named run, has VMA value of 0x42729240, which falls into the range of process map address belonging to the Android framework dex file. The VMA of the second method atan falls into the test application‟s dex address range, and this function can be found in the BallsView.java application source file as show in Figure 13.
Table 6. Portions of Newton‟s cradle‟s proc memory map.
VARI profiler and VMA replacement flow, correlates heap executions to respective dex files.
Start Addr. End Addr. Mod Nod. Mapped File Name 0000a000 002bd000 rwxp 0 [heap]
4245b000 42b01000 r-xp 293 /data/dalvik-cache/system@[email protected]@classes.dex
43964000 4396b000 r-xp 723 /data/dalvik-cache/data@[email protected]@classes.dex
The third method native_drawBitmap is a graphics library function of the Android system. Its VMA was not replaced by memory map tunnel, therefore falls into the heap section of the process map. Consequently, Oprofile will be unable to correlate the samples
39
of this function back to its Java method and source location.
603 for(int p=0;p<numPointers;p++) 604 {
605 if(mObjectTouched && mObjectsTouchedIds[p]!=-1)
606 {
607 mBallVelocity[mObjectsTouchedIds[p]]=0; 608
609 //translate the roational origin
610 float transX = reflectGetXForPointer(event, p)-mCenterOfRotationX[mObjectsTouchedIds[p]]; 611 float transY = reflectGetYForPointer(event, p)-mCenterOfRotationY;
612
613 if(!isOrientNormal) {transX=-transX; transY=-transY;} 614
615 //figure out the angle the ball is now at
616 if(transY>0) mBallAngle[mObjectsTouchedIds[p]] = ((float) (-Math.atan(transX/transY))+PI_F);
617 else mBallAngle[mObjectsTouchedIds[p]] = (float) -Math.atan((transX/transY));
618 }
619 }
Figure 13. BallsView.java source code for Newton‟s cradle.
6.2 VARI Profiling Results
Table 7 is a sample of call graph information generated by opreport after a profiling session. This particular call graph shows that after Kubench benchmark finishes one round of testing, it tries to use another Linux system library.
Table 7. Opreport call-graph result for 0xBench Math.
$ opreport –m tgid –cgl ../samples/
CPU: ARM V7 PMU, speed 0 MHz (estimated)
Counted CPU_CYCLES events (clock cycles counter) with a unit mask of 0x00 (No unit mask) count 15000
samples % image name symbol name Code
1 33.3333 libandroid_runtime.so app_process android::register_android_content_res_ Configuration(_JNIEnv*)
1 33.3333 libdvm.so app_process dvmCallMethodV
1 33.3333 system@framework@services [email protected]
app_process sleepBetweenRound:Kubench.java:47
0 0 libandroid_runtime.so app_process __on_dlclose
0 0 libandroid_runtime.so app_process __on_dlclose [self]
40
using the last shared library. The graphical representation of this call graph is show in Figure 14. The call graph diagram is generated by dot [43] using Gprof2Dot [44].
Figure 14. Method-level reconfigurable profiling call-graph for 0xBench Math. System framework triggered by Kubench.java.
A method level reconfigurable profiling call-graph is shown in Figure 15. For this example it shows methods from four dex files calling private methods within the same dex file.
41
6.3 DIM Overhead
Sending VMA through the memory tunnel and writing method information to the dump file are the two most significant DIM events. It is essential to implement these two functions appropriately as they greatly affect profiling performance and accuracy. This section examines whether the proposed methodology is efficient.
Figure 16. Total profiling time of different DIM instrument methodologies. The Y-axis is the total profiling time of different DIM instrument methodologies running 3 benchmarks. The units are in seconds.
Figure 16 shows the total profiling time utilizing different Dalvik virtual machine instrumentation methodologies. Figure 17 shows the overhead analysis. The analysis is done by running these methodologies through three benchmarks. Newton‟s cradle [39] is a two dimensional simulation of the conservation of momentum and energy. User controls
42
the application through drag and release motions. 0xBenchmark‟s [40] math test consists of Linpack [41] and Scimark2 [42]. 0xBenchmark‟s VM test consists of a garbage collection test that creates a large binary tree and a large array of doubles to test GC performance.
Figure 17 Overhead of different DIM instrumentation methodologies.
The DIM overhead statistics are measured with performance counter cycle count. The original executing time for the application is used as control statistics. The x-axis shows DIM instrumentation methodology overhead with each benchmark for both figures.
Instrumenting at each „method invoke‟ involves writing method information to a log file when the method is called during runtime. It is the traditional vertical profiling approach to instrument JVM. Since it writes to file frequently during runtime, the overhead is large in comparison to instrumenting „load method from dex‟, which only writes to file once when the test application initiates. An addition of at least 8 seconds is added to