行政院國家科學委員會專題研究計畫 成果報告
公司理財整合型研究--子計畫九:不動產投資信託之公司
理財相關議題研究(第 3 年)
研究成果報告(完整版)
計 畫 類 別 : 整合型 計 畫 編 號 : NSC 95-2416-H-004-059-MY3 執 行 期 間 : 97 年 08 月 01 日至 98 年 07 月 31 日 執 行 單 位 : 國立政治大學財務管理學系 計 畫 主 持 人 : 盧秋玲 計畫參與人員: 學士級-專任助理人員:盧筱穎 報 告 附 件 : 出席國際會議研究心得報告及發表論文 處 理 方 式 : 本計畫涉及專利或其他智慧財產權,2 年後可公開查詢中 華 民 國 98 年 10 月 26 日
行政院國家科學委員會補助專題研究計畫
x
成 果 報 告
□期中進度報告
不動產投資信託之公司理財相關議題研究
(計畫名稱)
計畫類別:□ 個別型計畫 x 整合型計畫
計畫編號:NSC 95-2416-H-155-021-MY3
執行期間:2006 年 08 月 01 日至 2009 年 07 月 31 日
計畫主持人:
盧秋玲
共同主持人:
計畫參與人員:張芸菁、王韻婷、盧筱穎
成果報告類型(依經費核定清單規定繳交):□精簡報告 x 完整報告
本成果報告包括以下應繳交之附件:
□赴國外出差或研習心得報告一份
□赴大陸地區出差或研習心得報告一份
x 出席國際學術會議心得報告及發表之論文各一份
□國際合作研究計畫國外研究報告書一份
處理方式:除產學合作研究計畫、提升產業技術及人才培育研究計畫、
列管計畫及下列情形者外,得立即公開查詢
□涉及專利或其他智慧財產權,□一年□二年後可公開查詢
執行單位:國立政治大學
中 華 民 國 98 年 10 月 18 日
Content
FIRST YEAR... 2
I. INTRODUCTION...3
II. STYLIZED FACTS OF EQUITY REIT IPOS ...7
III. THE DETERMINANTS OF LOCKUP LENGTH...11
IV. THE MARKET REACTION TO LOCKUP EXPIRATION...18
V. CONCLUSION...29
REFERENCES ...31
SECOND YEAR... 44
I. INTRODUCTION...45
II. DATA AND METHODOLOGY...45
III. EMPIRICAL RESULTS...46
IV. CONCLUSION...50
REFERENCE ...52
THIRD YEAR ... 65
I. INTRODUCTION...66
II. DATA AND METHODOLOGY...66
III. EMPIRICAL RESULTS...67
第一年 中文摘要 本文探討不動產投資信託初次上市上櫃時閉瑣期設定的動機。我們發現不動產投資信託 的閉瑣期期間比一般產業來的長,並不以 180 天為標準。閉瑣期的主要作用在於顯示經 理人對公司的承諾,而非嘗試傳遞公司訊息。另外,因為沒有創投參與不動產上市櫃, 閉瑣期打開時並沒有發生股價下跌的現象。最後在閉瑣期打開時,我們發現並沒有任何 的內部經理人有出售股票的行為,更加應證經理人對公司的信心。 關鍵字:不動產投資信託、初次上市上櫃、閉瑣期、訊息理論、道德危機
First Year Abstract
We analyze how the unique characteristics of real estate invest trusts (REITs) affect IPO lockup agreements from 1980 to 2006. The findings show that, unlike industrial IPOs, lockup periods for REIT IPOs do not cluster at 180 days, tend to cover longer periods, and vary over time. Our results support the commitment device hypothesis instead of signaling hypothesis, i.e. REIT managers apply lockup agreements to show their confidence on the company rather sending signals to investors. Finally, contrary to previous studies, we find no significant negative abnormal returns around the unlock date for the whole sample. The lack of aggressive sales by insiders and the fact that REITs are not backed by venture capitalists can explain our finding.
Keywords: Real estate investment trust, Lockup, Initial public offering, Signaling hypothesis, Commitment device, Moral hazard
I. Introduction
Most initial public offerings (IPOs) include a lockup agreement that prohibits pre-IPO shareholders from selling their holdings for a specified period. Industrial IPO lockup periods commonly extend for 180 days, which can vary based on the agreement reached between insiders and underwriters. A lockup agreement assures the market that pre-IPO shareholders do not cash out immediately following the IPO and therefore aligns their interests with those of outside investors.
Lockup agreements can provide a commitment solution to control the moral hazard problem or act as a signal to reduce the level of asymmetric information. Results from previous studies on the relative importance of these two functions of lockup agreements are mixed. While Brav and Gompers (2003) find evidence to support the commitment device hypothesis, Brau, Lambson and McQueen (2005) support the signaling argument. Examining IPOs in Singapore, Chong and Ho (2007) find a positive relation between lockup length and voluntary earnings forecast disclosure. Their findings show that firms with greater asymmetric information and moral hazard problems feature longer lockup periods.
Another important issue related to IPO lockups is the market reaction to lockup expiration. The terms of lockup agreements are public information; the number of locked shares and the unlock date are reported in the IPO prospectus. The efficient market hypothesis suggests that investors will respond only to unexpected information; therefore, no abnormal returns should be observed around the unlock date. However, the extant evidence does not support this hypothesis. Field and Hanka (2001), Bradley, Jordon, Roten, and Yi (2001), and Ofek and Richardson (2000) find significantly negative abnormal returns around the unlock date for U.S. industrial IPOs. These negative abnormal returns around the unlock date could possibly be
caused by a downward sloping demand curve, unexpected sales by insiders, or aggressive sales by venture capitalists. Several studies report that negative market responses are more acute for firms with venture capital backing. For example, Bradley et al. (2001) examine a sample of 2,539 IPO firms and find that significant abnormal returns exist only for IPO firms backed by venture capitalists.
Previous studies on IPO lockups focus on industrial IPOs and exclude Real Estate Investment Trusts (REITs). Although Brau, Lambson, and McQueen (2005) incorporate investment funds into their study, they do not separate REITs from other types of investment funds. REITs are different from other investment funds in at least two ways. First, they operate as corporations under certain specific regulatory requirements set up by Internal Revenue Service. Second, the underlying assets of REITs are real assets instead of financial assets. Consequently, the general conclusions drawn from the studies of IPO lockups for industrial firms or investment funds may not apply to REIT IPOs.
Lockups in REIT IPOs warrant investigation for several reasons. First, the REIT market has grown tremendously in the past 30 years, especially after several regulatory changes in the early 1990s, making REITs a viable investment option for both individual investors and institutional investors. Between 1971 and 2007, the number of REITs in the United States increased from 34 to 152, and their market capitalization increased by more than 200 times, from $1.5 billion to $312 billion. According to the National Association of Real Estate Investment Trusts (NAREIT), at the end of 2007, the 35-year annual return for the FTSE NAREIT Equity REITs index was 14.15%, compared with 8.6% for the Merrill Lynch Corporate/Government Bond Index, 12.95% for the S&P 500, and 9.67% for the Dow Jones Industrial Average.
venture capital backing, on the market reaction to lockup expiration. REITs are not normally backed by venture capital, if abnormal returns are mainly caused by aggressive sales by venture capitalists; as reported for industrial IPOs, price movement around the unlock date for REIT IPOs should be relatively stable. However, if abnormal returns occur around the unlock date for REIT IPOs, factors other than aggressive sales by venture capitalists are likely affecting the market response.
Third, examining REIT IPOs would shed new light on the debate on the relevance of the commitment device and signaling hypothesis in explaining IPO lockup length and market reaction around lockup expiration. Asymmetric information and moral hazard problems have been reported as important determinants of lockup length and market responses to lockup expiration for industrial IPOs. REITs have different nature of agency conflict and asymmetric information problems due to several unique characteristics, which in turn, may uniquely impact lockup agreements or result in different market reactions around the unlock date.
Compared to industrial firms, REITs are more liquid and highly regulated, and thus are more transparent. The relative informational symmetric nature of REITs implies that REITs would not rely on lockup length as a signal device, and proxies for asymmetric information would have no significant impacts on the market reaction to lockup expiration.
Whether REITs have more severe agency problems than industrial firms is less straightforward. On one hand, REITs are expected to have a less severe agency problem due to restrictions on income source and payout distribution. REITs are required to distribute at least 90% of their income as dividends to investors, and to earn a minimum of 75% of their incomes from real estate properties or mortgage loans. As fewer free cash flows are left and managers have less discretion over the types of assets they can invest, the moral hazard problem is reduced.
On the other hand, the restrictions on income source and asset type, together with the restriction on ownership structure, weaken the mechanism of corporate control market in the REIT industry (see Ghosh and Sirmans, 2003). In addition to restrictions on income source and asset type, no more than 50% of REIT shares may be held by five or fewer individuals during the second half of any taxable year. These restrictions make inter-industry acquisition extremely difficult and reduce the possibility of hostile takeover, an alternative mechanism that can be used to control the agency problem. For these reasons, Campbell, Ghosh, and Sirmans (2001) find no evidence of any hostile REIT takeovers during the 1990s. Also, Ghosh and Sirmans (2003) find that outside board members of REITs are ineffective in performing their monitoring function.
Lastly, REITs have unique management structure choices. Unlike industrial firms, since 1986 REITs have had the option of being internally or externally managed. The effectiveness of IPO lockup as a commitment device would depend on management types because of different moral hazard problems associated with different structures. If the commitment device hypothesis holds, management structure should have an impact on the choice of lockup length as well as on the market reaction to lockup expiration.
In this study, we use a sample of REIT IPOs for the period from 1980 to 2006 to analyze the motivation behind the lockup agreement, examine the determinants of lockup length, and evaluate the market reaction on lockup expiration. Lockup lengths and market reaction to lockup expiration are two major issues related to IPO lockup. Examining two issues together allows us to have a better understanding on the decision of lockup agreement. Brav and Gompers (2003) also examine both issues and claim that “examine whether cross-sectional differences in abnormal returns around this event can shed light on the competing hypotheses for the existence of lockups” (Brav and Gompers (2003), p.20).
Our findings for REIT IPO lockups are quite different from those reported in previous studies (e.g. Bradley et al. 2001; Brav and Gompers, 2003; Field and Hanka, 2001). Although a smaller percentage of equity REIT IPOs, compared with industrial IPOs, feature a lockup, REIT IPOs have a longer average lockup period. We find a close relation between management structure and lockup length. The Tobit analysis indicates that lockup length increases with offer size and the choice of self-management style. Offer size can be a proxy for asymmetric information and moral hazard problems. Although the positive impact of offer size on lockup length lends support to the commitment solution argument, it contradicts the prediction of the signaling hypothesis. The positive and significant relation between the self-managed dummy and lockup length also illustrates the important role of moral hazard in explaining lockup length. Contrary to the findings for industrial IPOs in the current literature, our results show no significant abnormal returns for REIT IPOs around lockup expiration for the full sample. Our results imply that there are no unanticipated supply shocks or drastic demand drops around the unlock date, which can be explained by the unique characteristics of REITs. The regression analysis indicate that moral hazard problem, rather than asymmetric information, can partly explain the cross sectional difference in abnormal returns around the unlock date.
This study is organized as follows. We first provide the stylized facts of equity REIT IPOs. We then analyze the determinants of lockup length for REIT IPOs. Next, we examine the market reaction around the unlock date and the determinants of market reaction. Finally, we conclude.
II. Stylized Facts of Equity REIT IPOs
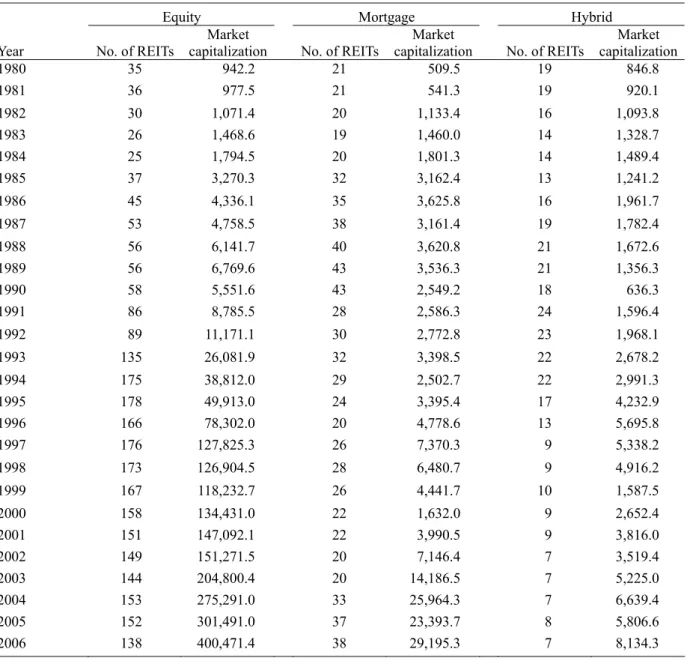
Table 1 reports the number and market capitalization of REITs for the period from 1980 to 2006. Equity REITs clearly dominate the market, accounting for 75% in terms of the number of REITs and 91.5% in terms of market capitalization in 2006. As mortgage REITs and hybrid REITs account for only a small percentage, we exclude them from our study. Due to data availability, the final sample consists of 169 equity REIT IPOs. Daily share prices, the CRSP value-weighted index, and trading volume are collected from the CRSP database. The management type and structure of the REIT are defined by SNL Real Estate Securities Quarterly.
[TABLE 1 ABOUT HERE]
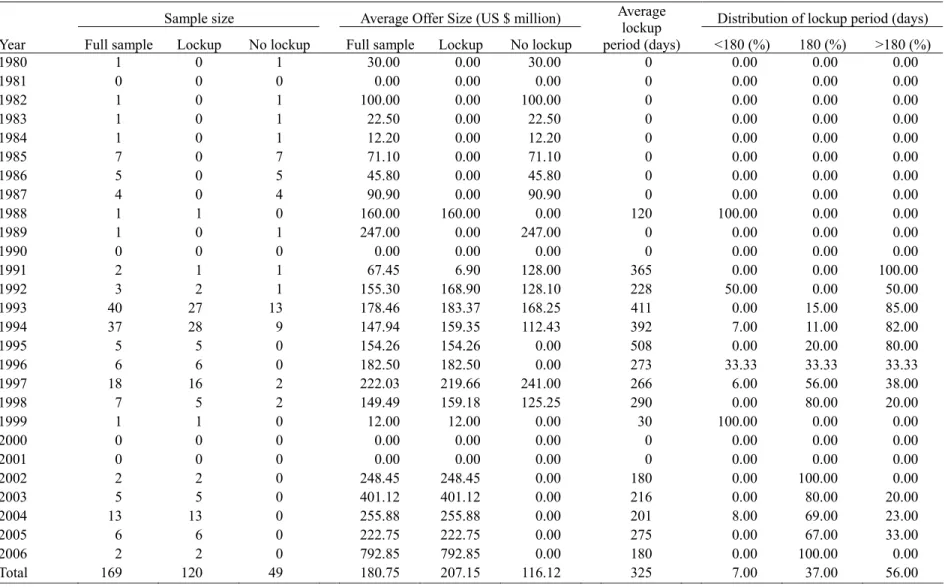
Table 2 shows the distribution of IPO offer size and lockup length. About 71% (120 out of 169) of REIT IPOs include a lockup agreement, which is somewhat lower than the 80% reported in Brau, Lambson, and McQueen (2005). The average offer size is $181 million for the whole sample, and the average offer size for REIT IPOs with lockups is almost twice that for REIT IPOs without lockups ($207 million vs. $116 million). As for the length of lockup period, the distribution of our REITs sample is quite different from those for industrial IPOs. Field and Hanka (2001), who examine 1,948 industrial IPOs for the period from 1988 to 1997, find an average lockup length of 187 days; 80% of the IPOs in their sample have a lockup period of exactly 180 days. Of 2,794 IPOs in their sample, Brav and Gompers (2003) report 64% have a lockup length of 180 days. Similarly, Bradley, Jordan, Roten, and Yi (2001) find that 75% of sample of 2,693 IPOs have a 180-day lockup. We do not find strong clustering of lockup lengths. In our sample of equity REIT IPOs, only 37% have a lockup period of exactly 180 days, and 56% have a lockup period of more than 180 days.
Interestingly, none of the 20 REIT IPOs listed before 1988 had a lockup agreement. This may not simply be a result of the timing effect. Before the Tax Reform Act of 1986 went into effect, REITs were not allowed to be self-managed; therefore, all these 20 equity REIT IPOs were externally managed. Once REITs were allowed to self-select management types, the majority became self-managed. Of those that decided remain externally managed, most featured a lockup when they went public. These externally managed REIT IPOs exhibit an average shorter lockup period than that of their self-managed counterparts. Since 1988, 27 externally managed REIT IPOs have included a lockup agreement with an average lockup period of 258 days. By contrast, internally managed REITs IPO lockup periods averaged 348 days. These observations imply a close relation between management structure and lockup length.
While the average lockup period for our REIT IPOs (325 days) is longer than those reported in the studies of industrial IPOs, it has been declining over time. Before 1997, among the REIT IPOs with a lockup, 78% (54 out of 69) had a lockup of longer than 180 days; only 14% (10 out of 69) had a lockup period of exactly 180 days. Since 1997, the lockup periods for REIT IPOs have trended toward the 180-day mark. Among the REIT IPOs with a lockup during the period from 1997 to 2006, 68% (34 out of 50) had a 180-day lockup. A possible explanation for this trend is that a learning curve existed for REIT IPOs. That is, because investors were not familiar with the REIT industry at its early development stage, REIT IPOs offered a much longer lockup period to demonstrate the commitment of the company and ensure the confidence of public investors. As the market built its credibility and more underwriters increasingly involved in the REIT IPO market, the lockup periods slid toward the 180-day norm established by the industrial IPOs. Similar learning effect was observed by Chen and Lu (2006) on underwriting
fees of REIT IPOs.
[TABLE 2 ABOUT HERE]
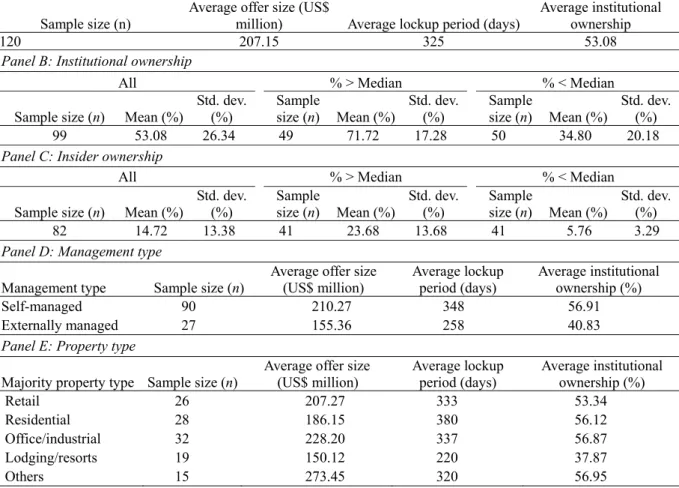
Table 3 shows the distribution of institutional ownership, insider ownership, management type, and property type for REIT IPOs with a lockup for the full sample. The institutional ownership is the percentage of shares owned by institutional investors in the quarter of IPO or the following quarter if ownership data are not available. We divide the sample into two groups based on the median institutional ownership and median insider ownership. A REIT is considered as having high (low) institutional ownership if its institutional ownership is greater (less) than the median of the sample. Panel B presents that institutional investors own 53% of the REITs, 71.7% for the high institutional ownership group and 34.8% for the low institutional ownership group. Panel C indicates that, on average, insiders own 14.72% of the REITs, 23.68% for the high insider ownership group and 5.76% for the low insider ownership group. Panel D shows that 77% of REIT IPOs with a lockup are self-managed, with an average offer size of $210 million; the average offer size of externally managed REIT IPOs is $155 million.
As previously mentioned, a significant difference exists between self-managed and externally managed REIT IPOs in terms of lockup length. The average lockup period for self-managed REITs is 90 days longer than that for externally managed REITs. In addition, institutional investors own a higher proportion of self-managed REITs (56.9%) than they do of externally managed REITs (40.8%). According to the NAREIT, the property types for equity REITs include retail, residential, office/industrial, self-storage facilities, health care, hotel/lodging, and specialty and diversified. Panel E reports that lodging/resort REITs exhibit
smaller offer size, shorter lockup periods, and lower institutional ownership when compared to REITs with other property types.
[TABLE 3 ABOUT HERE]
III. The Determinants of Lockup Length Tobit analysis
Lockups can be used as a signal to reduce information asymmetry or as a commitment solution to mitigate moral hazard problems. Previous studies have provided different results regarding the relative importance of these two arguments in explaining IPO lockup length. Due to the unique characteristics of REITs, we may expect the determinants of lockup length for REIT IPOs to differ from those for industrial IPOs. We use the following Tobit model to examine the determinants that are specific to the lockup length of REITs IPOs:
LOCKUP = α + β1TOP6_AUDITOR + β2UNDERWRITER_RANK + β3LNPROCEEDS + β4MSE + β5SELF_MGT + β6RETAIL + β7RESIDENTIAL + (1) β8OFFICE_INDUSTRIAL + β9LODGING_RESORT + β10BULL,
where LOCKUP is the natural logarithm of 1 plus lockup length, which could be zero or positive. TOP6_AUDITOR is a dummy variable to proxy for the quality of the issuing firm’s auditor, which is equal to 1 if the auditing firm is one of the top six auditing firms, and zero otherwise.1
UNDERWRITER_RANK is the Carter–Manaster reputation rank, which measures the reputation
1 These auditing firms are Arthur Andersen, Coopers & Lybrand, Deloitte & Touche, Ernst & Young, KPMG, and
of a lead underwriter. Based on the Carter–Manaster ranking, we classify the reputations of underwriters into 10 categories ranging from zero to 9, with 9 being the highest reputation rank. LNPROCEEDS is the offer size of a REIT IPO, which is the natural logarithm of the product of the number of IPO shares offered and the offer price. MSE is the mean square error of the market model regression, which proxies for idiosyncratic risk. We regress the daily REIT returns against the daily CRSP value-weighted index returns over the 60-day period after the IPO. SELF_MGT is a dummy variable, which equals 1 if the REIT is self-managed, and zero otherwise. RETAIL, RESIDENTIAL, OFFICE_INDUSTRIAL and LODGING_RESORT are dummy variables, which equal 1 for the corresponding property type, and zero otherwise. They are used as control variables to capture the property effect. BULL is a dummy variable, which equals 1 if the CRSP value-weighted index return is greater than the T-bill return over the 12–month period preceding the IPO, and zero otherwise.
Previous studies have found relations between lockup length and firm value, auditor quality and underwriter reputation, and venture capital backing. For example, by developing a signaling model, Courteau (1995) shows that the use of lockup agreement can signal the value of a firm. Brau, Lambson, and McQueen (2005) argue that auditor quality or underwriter reputation can provide certification for offerings to investors and improve transparency. Consequently, firms with high-quality auditors or reputable underwriters are more transparent and may rely less on lockups for the purpose of signaling. Conversely, opaque firms are more likely to impose longer lockups. Arthurs, Busenitz, Hoskisson, and Johnson (2009) show that a longer lockup period serves as a substitute for venture backing and that underwriter reputation serves as a signal to reduce the uncertainty embedded in industrial IPOs. Therefore the signaling hypothesis predicts a negative relation between auditor quality and underwriter rank and the lockup length.
A lockup agreement may also serve as a commitment device for alleviating moral hazard problems. Brav and Gompers (2003) find that, holding the quality of the firm constant, a firm with more severe moral hazard problems tend toward longer lockups whereas firms with other forms of certification suffice with shorter lockups. Consequently, if the commitment hypothesis holds, we expect an inverse relation between underwriter reputation/auditor quality and lockup length.
Firm size has been widely used in the finance literature as a proxy for both information asymmetry and moral hazard. In general, large firms are more transparent due to higher levels of analyst and media coverage and thus do not require long lockups to provide positive signals to investors. Thus, according to the signaling hypothesis, the LNPROCEEDS variable, which serves as a proxy for firm size, is expected to be negatively related to lockup length.
Previous studies show that larger firms are less likely to be disciplined by the market for corporate control due to a higher percentage of atomistic shareholders. In addition, due to the complexity of large firms, monitoring management may be more difficult. In testing their moral hazard theory of managerial compensation, Gayle and Miller (2009) show that the divergence of interests between managers and shareholders increases with firm size. If, in fact, moral hazard increases with firm size, firms with a large offer size are likely to have a longer lockup period to mitigate moral hazard problems. Thus, a positive relation between LNPROCEEDS and lockup length is consistent with the prediction of the commitment device hypothesis.
MSE is used as a proxy for idiosyncratic risk. A high level of idiosyncratic risk is associated with the high cost of being undiversified; therefore, pre-IPO shareholders are not likely to prefer a long lockup period. Consequently, short lockup periods signal that insiders are unwilling to hold risky assets for the long term. In addition, Brau et al. (2005) argue that risky
firms set up shorter lockups to avoid sending out costly, false signals. From this perspective, if the signaling hypothesis holds, we expect an inverse relation between MSE and lockup length.
SELF_MGT is included to control for the impact of management style. As previously discussed, lockup length is closely related to the management style of REITs. To analyze this relation, we must understand the possible impact of management style on the nature of the moral hazard problem. At first glance, externally managed REITs are expected to have a more severe moral hazard problem and higher agency costs than their self-managed counterparts. Prior evidence seems to support this claim. For example, Capozza, and Seguin (1988, 2000), using different performance measures, find that externally managed REITs underperform self-managed REITs. Such results imply that the operation of externally managed REITs is more complicated and costly. Thus, we expect that the decision making of self-managed REITs is more straightforward and transparent, resulting in a negative relation between SELF_MGT and lockup length.
However, self-managed REITs may have longer lockups than externally managed REITs for several reasons. First, as previous studies show, self-managed REITs outperform externally managed REITs. That is, pre-IPO shareholders of self-managed REITs are more willing to be long-term investors and accept a longer lockup period to demonstrate their commitment than pre-IPO shareholders of externally managed REITs.
Second, managers of self-managed REITs and externally managed REITs are compensated on the basis of different performance measures. External managers are compensated on the basis of property level income and asset size, and self-managed REITs are compensated according to shareholder value. Most important, external managers are less likely to invest in REITs under their own management, meaning that lockups do not serve as an
effective bonding solution to the moral hazard problem. Because external managers have no (or limited) investments in the companies they manage, lockup agreements are less relevant to them. In contrast, internal managers are compensated according to performance measures that are closely related to the share values of their companies, making a lockup agreement a more effective tool in controlling the moral hazard problem for self-managed REITs.
Third, other mechanisms such as financial leverage are used to control the moral hazard problem for externally managed REITs. The extant evidence indicates that externally managed REITs are more leveraged than self-managed REITs. For example, Capozza and Seguin (2000) report that the debt ratio for self-managed (externally-managed) REITs is approximately 33% (44%). Jensen (1986) suggests that leverage can reduce the agency cost of free cash flows. Accordingly, the moral hazard problem of externally managed REITs is under control to some extent, and externally managed REITs are not necessarily more associated with longer lockup periods than self-managed REITs.
As previously discussed, REITs with different property types have different characteristics (see Table 3, Panel E), and these differences are likely to affect the lockup decision. For example, Gyourko and Nelling (1996) show that the systematic risk of equity REITs varies by property type. They find that REITs with a large proportion of their assets invested in retail properties have higher betas. To control for the impact of property type, we include dummy variables for the four major types of REITs (retail, residential, office/industrial, and lodging/resort) in the Tobit analysis.
Market conditions may also affect lockup length because lower levels of asymmetric information may prevail during a market upturn. Therefore, a shorter (longer) lockup period is expected during a bullish (bearish) market. In a bull market, investors may be too optimistic to
be concerned about the moral hazard problem and thus are willing to accept a shorter lockup period.
Empirical results
Table 4 presents the results of Tobit regression. Model 1 includes the key variables used to test the signaling hypothesis and the commitment device hypothesis, with MSE controlling for idiosyncratic risk. Model 2 incorporates dummy variables for property types, and Model 3 controls for market conditions by including the variable BULL.
[TABLE 4 ABOUT HERE]
In Model 1, auditor quality is not significantly associated with lockup length, but the coefficient of UNDERWRITER_RANK is negative and significant at the 5% level. We find that REITs that hire more reputable underwriters tend to have shorter lockup periods. This result is consistent with the signaling argument in that reputable underwriters can use lockups as a substitute to reduce the degree of investor uncertainty. It is also consistent with the prediction of the commitment hypothesis as set forth by Brav and Gompers (2003).
The coefficients of offer size (LNPROCEEDS) and management structure (SELF_MGT) are significantly positive at the 1% and 5% levels, respectively. Contrary to the prediction of the signaling hypothesis, firms with larger offer size tend to use a longer lockup period. This evidence suggests that large firms may suffer from a more severe moral hazard problem than small firms and thus rely on a longer lockup period to mitigate this problem. Note that our result does not imply that large firms are more informational asymmetric, it just indicates that the
signaling hypothesis cannot explain the negative relation between firm size and lockup length. The significant and positive association between SELF_MGT and lockup length is consistent with the notion that lockups are more relevant to self-managed REITs than to externally managed REITs. Our findings imply that a lockup is a more effective tool in reducing the moral hazard problem for self-managed REITs, thus supporting the prediction of the commitment device hypothesis.
The result in Model 2 shows that the inclusion of property type does not change our major findings in Model 1, except that the coefficient of UNDERWRITER_RANK is no longer significant at the conventional level. Both the coefficients of LNPROCEEDS and SELF_MGT remain positive and significant. Out of the four dummy variables used to control for property type, only LODGING_RESORT is significantly and positively related to lockup length. The result indicates that among all REITs—regardless of whether they have lockups—managers of lodging/resort REITs tend to set longer lockup periods to show a stronger level of commitment. However, as shown in Table 3, Panel E, across all lockup groups, lodging/resort REITs have a much shorter average lockup period than REITs that focus on any other property types.
For Model 3, we find no significant relation between market conditions and lockup length. This result implies that market conditions do not prompt a change in either the level of asymmetric information or the moral hazard problem. The coefficients of LNPROCEEDS and SELF_MGT are again significantly positive. Similar to Brau, Lambson, and McQueen (2005), we find no significant relation between idiosyncratic risk and lockup length in any of the three models. We also find that the coefficients of auditor quality and underwriter reputation remain insignificant.
in Table 4, provide no strong support to the prediction of the signaling hypothesis. While all the coefficients of TOP6_AUDITOR are insignificant, the coefficient of UNDERWRITER_RANK is significant with the expected sign in only one model. In addition, the positive relation between offer size and lockup length is not consistent with the signaling hypothesis. Our results are, however, consistent with the commitment device hypothesis in that the moral hazard problem is more severe for self-managed and larger REITs, which use longer lockups to solve this problem.
IV. The Market Reaction to Lockup Expiration
Because the terms of a lockup agreement are reported in the IPO prospectus, investors are well informed about the possible increase in supply on and after the unlock date. Ofek and Richardson (2000) suggest that the impacts of lockup expiration should already be reflected in both the offer price and price movement shortly following the IPO. If the market is efficient, no abnormal return should be found around the unlock date. However, Bradley, Jordon, Roten, and Yi (2001), Brav and Gompers (2003), and Field and Hanka (2001) provide evidence of abnormal returns around the unlock date for industrial IPOs.
Considering the characteristics of REITs, we expect the market reaction to lockup expiration for REIT IPOs will be different from those of industrial IPOs. Specifically, we hypothesize that there will be no significant abnormal returns around the unlock date.
Our hypothesis is based on the following characteristics of REITs: First, REITs are less volatile and more transparent due to their stable and predictable rental incomes. As REITs are less information asymmetric than industrial firms, outsider demand for REITs does not drop substantially around the unlock date. Second, REITs are generally held by investors with long-term investment horizon, such as pension fund and insurance companies, to capture
dividends. These institutional investors are less sensitive to additional supply of shares, if any, when IPO lockup expires. Third, REITs are not backed by venture capitalists who aim to earn high returns in a relatively short-term period. Without aggressive selling by venture capitalist around the unlock date, the selling pressure for REITs following the lockup is relatively small.
Fourth, Ofek and Richardson (2000) suggest that aggressive selling of unlocked shares is mainly driven by the desire of pre-IPO shareholders for diversification. Compared to industrial stocks, REITs provide a larger diversification benefit. A study by Ibbotson Associates show that the correlation between REIT and other asset classes have been declining, and adding REITs to a portfolio can improve return and reduce risk. For example, for the period 1972-2003, the average return and standard deviation of a portfolio with 10% Treasury bill, 50% stocks, and 40% bonds are 10.9% and 10.6% respectively. Replacing 10% stocks and 10% bonds by REITs (i.e., 10% Treasury bill, 40% stocks, 30% bonds, and 20% REIT), the average return and standard deviation become 11.6% and 10.1% respectively. In addition, Corcoran (2009).show that U.S. REITs are better investment vehicles for diversification than 95 percent of global stock market indexes. The diversification benefit of REITs reduces the incentive of pre-IPO shareholders to sell when the lockup expires. These reasons potentially explain the insignificant market reaction to lockup expiration of REIT IPOs.
In addition to examine the abnormal returns around the unlock date, we are also interested in finding the determining factors of the cross sectional differences in the market reaction for REIT IPOs. We measure abnormal returns using the event study methodology.
Abnormal return and abnormal trading volume
⎥ ⎥ ⎦ ⎤ ⎢ ⎢ ⎣ ⎡ − ⎟⎟ ⎟ ⎠ ⎞ ⎜⎜ ⎜ ⎝ ⎛ + + =
∏
+ − = 1 1 1 , , N T t m t t i i R R CAR ,where Rit equals the daily return for the ith REIT t days from the unlock date; Rmt equals the
daily return for the market portfolio, proxied by the CRSP value-weighted index return, on day t from the unlock date; and T and N represent the starting and ending day in the event window period, respectively.
We also examine the change in trading volume around the unlock date. Shefrin and Statman (1985), Makhija, Haugen, and Ferris (1998) and Odean (1998) suggest that an increasing stock price is an important indicator of abnormal trading volume, because investors tend to realize profit when the stock price is high and rising. In addition, Field and Hanka (2001) find a 40% permanent increase in average trading volume and a statistically significant three-day abnormal return of –1.5% on lockup expiration. They show that aggressive sales by venture capitalists are the major reason behind this observation. Determining whether venture capitalists cause abnormal trading volumes might be clarified by further examining REITs, given that they are not backed by venture capitalists mostly.
We measure abnormal trading volume (ATV) with respect to the average trading volume over a 45-day period, beginning 70 days prior and ending 26 days prior to the unlock date:
1 45 1 26 70 , , , = −
∑
− − = t t i T i T i V V ATV , where∑
− − = 26 70 , 45 1 t t iV is the average daily trading volume for the ith REIT from 70 days to 26 days
Determining factors of the market reaction to lockup expiration
We use the following cross-sectional model to examine the determinants of market reaction to lockup expiration.
CARi = α + β1LNPROCEEDS + β2INSTITUTION + β3SELF_MGT +
β4ATV + β5INSIDER + β6RETAIL + β7RESIDENTAL + (2)
β8OFFICE_INDUSTRIAL + β9LODGING_RESORTS +
β10UNDERWRITER_RANK
where CARi is the CAR for event window i, INSTITUTION is the percentage of institutional
ownership one quarter prior to the lockup expiration, and INSIDER is the insider ownership. Given that a major motivation for lockup agreements is to reduce the level of asymmetric information and mitigate the moral hazard problem, negative abnormal returns around the unlock date are more likely to appear for firms with more severe asymmetric information and/or moral hazard problems.
As defined above, LNPROEEDS is a proxy for firm size. The larger the firm size, the less is the information asymmetry, but more severe the moral hazard problem. According to the signaling hypothesis, we expect a positive relation between IPO proceeds and abnormal returns around the unlock date. Larger firms are more liquid and have more coverage by financial analysts, lockup is less important as a signal and have a less negative impact on price movement when lockups expire. On the other hand, if the unlock agreement is a commitment device to mitigate the moral hazard problem, we expect a negative relation between LNPROCEEDS and abnormal returns. As a lockup expires, the fear of the potential agency problem is likely to reduce demand or encourage more aggressive sales by investors.
Since 1993, investments in REITs by institutional investors have increased rapidly. In particular, pension funds have become major investors. As shown in Panel B of Table 3, institutional investors own more than 50% of REIT shares on average. In general, institutional investors are well informed investors with professional knowledge and respond quickly to new information. Moreover, institutional investors are expected to play a better monitoring role than individual investors. Institutional ownership may substitute lockup as a mean to control the moral hazard problem. Therefore, REITs with more institutional investors are less likely to have negative abnormal returns around the unlock date than REITs owned mainly by individual investors.
As management structure is likely to affect the nature of the moral hazard problem, it might also be a determinant of the market reaction to lockup expiration. Our Tobit analysis suggests that lockups are more relevant to self-managed REITs than to externally managed REITs as a commitment device. Moral hazard problems could be more severe after the unlock date for internally managed REITs because their managers are more likely to hold REIT shares. Therefore, we expect that investors will respond more negatively to the lockup expirations of self-managed REITs than to those of externally managed REITs.
A reputable underwriter provides positive signals about issuer quality because underwriter reputation is at stake. Pre-IPO shareholders of REIT IPOs underwritten by prestigious underwriters have a greater incentive to hold their shares around the unlock date. Therefore, REIT IPOs with prestigious underwriters are less likely to exhibit negative abnormal returns around the unlock date.
We also use abnormal trading volume before the unlock date to examine the relation between transaction frequency and stock price movement. Insider ownership one quarter before
the lockup expiration is used to examine how the level of insiders’ commitment affects the market response. The larger the insider ownership, the larger is the chance of a significant supply shock on or immediately following the unlock date. Therefore, we expect a negative relation between insider ownership and abnormal returns. However, if insiders have strong incentives to retain shares for diversification benefits, insider ownership will have little impact on market reaction to lockup expiration.
Empirical results
We first calculate the abnormal returns for the full sample within an 11-day event window (–5, +5). To examine the impact of institutional ownership, insider ownership, and management structure, we divide our sample into the following categories: high versus low institutional ownership groups, high versus low insider ownership groups, and self-managed versus externally managed groups. For each category, we compare their abnormal returns and then use Equation (2) to estimate the impacts of the selected determining factors.
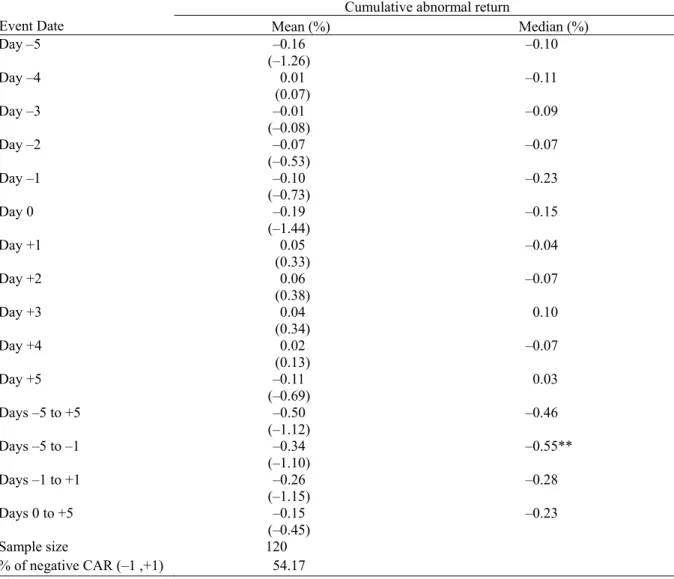
Table 5 reports the results of abnormal returns for the full sample around the unlock date. The results are in sharp contrast to those reported in the current literature (e.g., see Bradley, Jordan, Roten and Yi, 2001; Field and Hanka, 2001). The mean abnormal returns for Day –5 up to Day 0 are all negative, while the abnormal returns for Day 1 up to Day 4 are positive. However, none of the abnormal returns for individual days or any of the CARs for the four selected event windows—(–5, +5), (–5, –1), (–1, +1) and (0, +5)—are significantly different from zero at the conventional levels. The results for the median abnormal returns and CARs are similar, except that the CAR for the pre-expiration period (–5, –1) is –0.55%, which is significant at the 5% level. Figure 1 illustrates the cumulative abnormal returns for the full sample from day
-25 to day 25.
[TABLE 5 ABOUT HERE] [FIGURE 1 ABOUT HERE]
Unlike previous studies, we find no strong evidence of significant negative abnormal returns around the unlock date, indicating no sudden shifts in supply or drastic decreases in demand around lockup expirations, or both. Field and Hanka (2001) have tested the following hypothesis in explaining their finding of significant abnormal returns: i) increase in proportion of trades at the bid, ii) temporary price pressure, iii) increasing trading cost, iv) downward-sloping demand curves, and iv) worse than expected insider sales. As we find no significant abnormal return around the unlock date for REIT IPOs, the testing hypotheses suggested by Field and Hanka are not applicable to our study.
However, our finding is consistent with the results of previous studies for industrial IPOs in that abnormal returns are limited to IPOs with venture capital backing. As REITs are not backed by venture capitalists, the absence of aggressive selling by venture capitalists after the unlock data may explain the insignificant market responses for our sample.
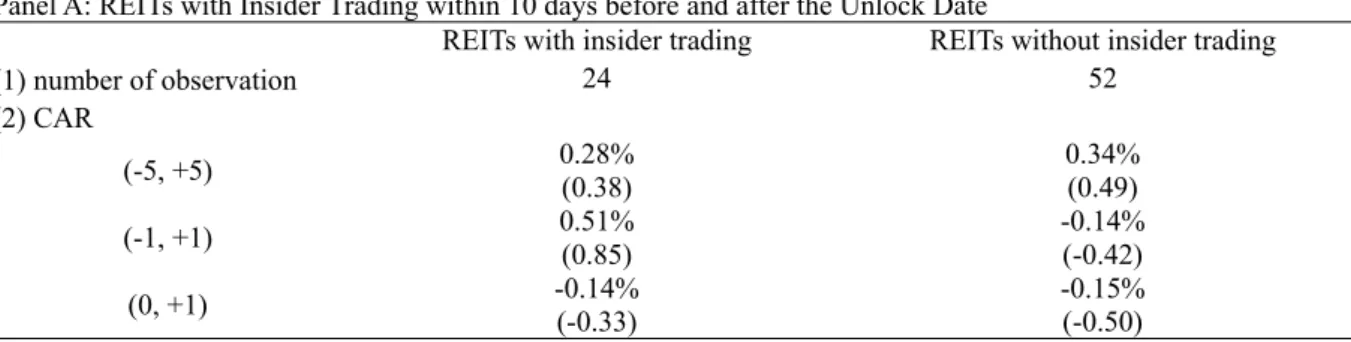
Another possible reason for our finding is that insiders do not have the incentive to sell their holdings when lockups expire. To verify this argument, we examine insider trading behavior 10 days before and after the unlock date. We compare the abnormal returns for those REITs with and without insider trading around the unlock date. The information on insider transaction are available from the U.S. Insiders Data of Thomson Reuters for 76 REITs, of which, 24 REITs have insiders traded during the (-10, +10) period. Unexpectedly, there are only 3 REITs have
insiders selling shares during this event window. This finding reveals that almost all insiders of REITs commit to hold their shares when the lockup restriction is lifted. Table 6 shows that the cumulative abnormal returns for those REITs with insider transactions are not significantly different from zero for three event windows: (-5, +5), (-1, +1), and (0, +1). Similar results are obtained for those REITs without insider trading. For those REITs with insiders selling shares, abnormal returns are also insignificant. Overall, these results indicate that insiders do not intend to cash out immediately following lockup expiration. The diversification benefit of REITs may provide an incentive to pre-IPO shareholders for retaining their shares.
[TABLE 6 ABOUT HERE]
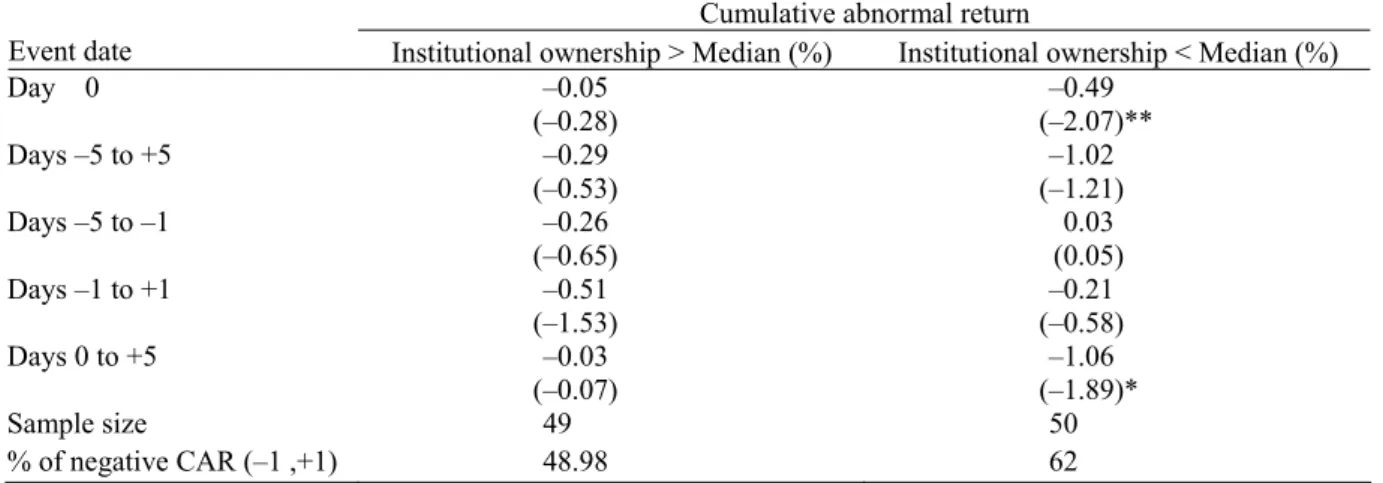
To examine the impact of institutional holdings, insider ownership, and management types on the market response to lockup expiration, we estimate abnormal returns for various subgroups classified by these characteristics. Panel A of Table 7 shows no significant abnormal returns on the unlock date for REITs with high levels of institutional ownership. The CARs for the four selected event windows are also not significantly different from zero. For the subsample with low levels of institutional ownership, the evidence is more aligned with that reported in the literature. The abnormal return on the event day is –0.49%, which is significant at the 5% level. The CAR for the (0, +5) window is significantly below zero at the 10% level. The results for the low institutional ownership subsample implies that without intense monitoring from institutional investors, investors are uncertain about the future of the company following lockup expiration and thus react negatively around the unlock date.
[TABLE 7 ABOUT HERE]
As shown in Panel B, the market responses similarly to lockup expiration for firms with high and low levels of insider ownership. For the high insider ownership group, a significant negative abnormal return of –0.39% is observed on the event day. However, the negative abnormal returns seem to be temporary only. None of the abnormal returns for Day +1 up to Day +5 is significantly different from zero, and the CARs for the four selected windows are insignificant. A similar pattern of market reaction exists for the low insider ownership group. Overall, this pair-wise comparison indicates that insider ownership has no significant impact on abnormal returns around the unlock date. This result is consistent with our finding that insiders do not aggressively sell their holdings when lockups expire.
Panel C presents the results for self-managed and externally managed REITs. These results are compatible with those from the Tobit analysis. For externally managed REITs, no significant abnormal returns are found on the unlock date and for any of the selected event windows. On the other hand, the results for self-managed REITs are aligned with those of previous studies. The cumulative abnormal returns are significantly below zero for three event windows, (–5, +5), (–5,–1) and (–1, +1). As a lockup expires, the bonding imposed on inside managers is no longer in effect. Investors may sell their shares in the midst of uncertainty or due to the fear of managers’ self-serving behavior following lockup expiration. However, due to different compensation structures and their lack of investments in their own trusts, the bonding function of a lockup is less relevant to external managers. As a result, lockup expiration does not generate significant negative abnormal returns around the unlock date for externally managed REITs.
Analysis of abnormal trading volume
Table 8 presents the abnormal trading volume for the full sample within a 51-day event window (–25, +25). Figure 2 provides a graphical representation of the data. The full sample shows an insignificant decline (–12.57%) in trading volume on the unlock date. In contrast to previous studies, we find no permanent increase in trading volume within the 51-day event window. There is only one significant positive abnormal trading volume, which appears one day after the unlock date. While there are some positive big jumps in abnormal trading volume such as days +11, +16 and +22, none of them is significantly different from zero. Field and Hanka (2001) find that unlocking shares result in a 40% permanent increase in trading volume, our result for equity REITs does not indicate any permanent change. As shown in Figure 2, throughout the event window, abnormal trading volume wanders around zero. For the big jumps after the unlock date, trading volume is quickly reverting to zero. The findings for abnormal trading volume are consistent with the results shown in Table 5 in that no significant abnormal returns appear around the unlock date
[TABLE 8 ABOUT HERE] [FIGURE 2 ABOUT HERE] Regression analysis
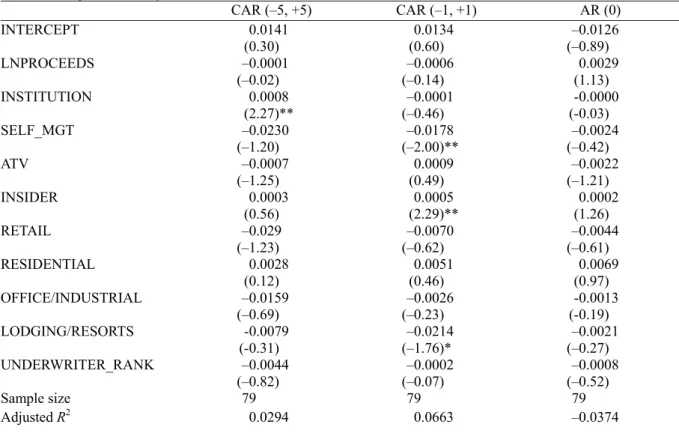
We analyze the cross-sectional difference in market reaction to lockup expiration using CARs for the event windows (–5, +5) and (–1, +1) and the abnormal return on the event date. The results are shown in Table 9. For the event window (–5, +5), the coefficient of institutional ownership is significantly positive at the 5% level. REITs with high levels of institutional
ownership have higher CARs than REITs with low levels of institutional ownership for the 11-day window. This result is consistent with the finding in Table 7 that REITs with low levels of institutional ownership show significant and negative returns on the event date and in the event window (0, +5). In contrast to Brav and Gompers (2003), we find no significant relation between trading volume and abnormal returns. Offer size, property type, management style, and insider ownership are also not significantly related to the CAR for the 11-day event window.
For the event window (–1, +1), institutional ownership is no longer significant. We find a significant negative relation between self-management style and abnormal returns. In addition, the higher the level of insider ownership, the higher the abnormal return. REITs with assets in lodging and resorts show negative and significant abnormal returns, which may be caused by a lower level of commitment due to the shorter lockup periods used than in other types of REITs. The last column of Table 9 shows that none of the explanatory variables can explain the variation in abnormal returns on the event date. In Table 5, abnormal returns on the unlock date, AR(0), are not significantly different from zero.
None of the coefficients on LNPROCEEDS and UNDERWRITER_RANK are significantly different from zero, indicating that the signaling hypothesis cannot explain the cross sectional difference in market reaction to lockup expiration. While the regression results are not very robust, the significant results for INSITUTION and SELF_MGT pinpoint the importance of the moral hazard problem for REIT IPOs. More monitoring effort is implied by a larger institutional ownership, and thus, investors are less likely to liquidate their holdings upon lockup expiration. Nevertheless, our results can partially be attributed to the fact that no significant abnormal returns are found for our sample as a whole.
[TABLE 9 ABOUT HERE]
V. Conclusion
We analyze lockups for REIT IPOs during the period from 1980 to 2006. Unlike industrial IPO lockups, we find that our sample does not cluster at 180 days and varies over time. Our sample of equity REIT IPOs show a longer average lockup period than those reported for industrial IPOs. We find no strong support to the signaling explanation for lockup length. As REITs are highly regulated and relatively transparent when compared to industrial firms, REITs may not necessarily use lockups to reduce the level of asymmetric information. The positive relation between offer size and lockup length from the Tobit analysis lends support to the commitment device hypothesis. While a lockup can be used as a commitment device, it is more relevant for self-managed REITs than for externally managed REITs.
In contrast to previous studies, we find no significant negative abnormal returns around the unlock date. This result is consistent with the previous findings that abnormal returns around lockup expiration are limited to corporations with venture backing. As REITs are not backed by venture capitalists, the lack of aggressive sales by venture capitalists may explain our finding. The lack of negative abnormal returns around lockup expiration can also be explained by other unique characteristics of REITs. REITs are more transparent than industrial companies thus negating the need for urgent sales. A majority of investors of REITs investors are institutional investors, who have a longer investment horizon and are less sensitive to lockup expiration. Finally, the insiders of REITs do not aggressively sell their holdings when lockups expire, possibly for the diversification benefit of REITs.
around the unlock date. Negative abnormal returns exist for REITs with low levels of institutional ownership and self-managed REITs. Regression analysis indicates that REITs that invest in lodging and resorts have lower abnormal returns around the unlock date. The behavior of trading volume for our sample of REITs is different from that for industrial IPOs. Although trading volume sometimes jumps abruptly after the unlock date, there is no sign of permanent increase, which is not consistent with previous studies on industrial IPOs.
References
z Arthurs, J. D., Busenitz, L. W., Hoskisson, R. E., & Johnson, R. A. (2009). Signals and initial public offerings: The use and impact of the lockup period. Journal of Business Venturing, forthcoming.
z Bradley, D. J., Jordan, B. D., Roten, I. C., & Yi, H-C. (2001). Venture capital and IPO lockup expiration: An empirical analysis. Journal of Financial Research, 24, 465–494.
z Brau, J., Lambson, V., & McQueen, G. (2005). Lockups revisited. Journal of Financial and Quantitative Analysis, 40, 519–530.
z Brav, A., & Gompers, P. (2003). The role of lockups in initial public offerings. Review of Financial Studies, 16, 1–29.
z Campbell, R., Ghosh, C., & Sirmans, C. F. (2001). The information content method of payment in mergers: Evidence from real estate investment trusts (REITs). Real Estate Economics, 29, 361–387.
z Capozza, D. R., & Seguin, P. J. (1988). Managerial style and firm value. Journal of Real Estate Research, 26, 131–150.
z Capozza, D. R., & Seguin, P. J. (2000). Debt, agency, and management contracts in REITs: The external advisor puzzle. Journal of Real Estate Finance and Economics, 20, 91–116. z Chen, H-C., & Lu, C. (2006). How much do REITs pay for their IPOs? Journal of Real
Estate Finance and Economics, 33, 105–125.
z Chong, B-S., & Ho, K-W. (2007). Lockup and voluntary earnings forecast disclosure in IPOs. Financial Management, 36, 63–80.
z Corcoran, E. (2009). U.S. REIT Power. Real Estate Portfolio, Special Issue, http://www.nareit.com/portfoliomag/07special/p14.shtml.
z Courteau, L. (1995). Under-diversification and retention commitments in IPOs. Journal of Financial and Quantitative Analysis, 30, 487–517.
z Field, L. C., & Hanka, G. (2001). The expiration of IPO share lockups. Journal of Finance, z 56, 471-500.
z Gayle, George-Levi, and Robert A. Miller (2009). Has moral hazard become a more important factor in managerial compensation? American Economic Review, forthcoming. z Ghosh, C., & Sirmans, C. F. (2003). Board independence, ownership structure and
performance in real estate investment trusts. Journal of Real Estate Finance and Economics, 26, 287–318.
z Gyourko, J., & Nelling, E. (1996). Systematic risk and diversification in the equity REIT market. Real Estate Economics, 24, 493–515.
z Jensen, M. C. (1986). The agency costs of free cash flow: Corporate finance and takeovers. American Economic Review, 76(2), 323–329.
z Makhija, A. K., Haugen, R. A., & Ferries, S. P. (1988). Predicting contemporary volume with historic volume at differential price levels: Evidence supporting the disposition effect. Journal of Finance, 43, 677–697.
z Odean, T. (1998). Are investors reluctant to realize their losses? Journal of Finance, 53, 1775–1798.
z Ofek, E., & Richardson, M. (2000). The IPO lock-in period: Implications for market efficiency and the downward sloping demand curve. Working paper, New York University.
z Shefrin, H., & Statman, M. (1985). The disposition to sell winners too early and ride losers too long: Theory and evidence. Journal of Finance, 40, 777–790.
z White, H. (1980). A heteroskedasticity-consistent covariance matrix estimator and a direct test for heteroskedasticity. Econometrica, 48, 817–838.
Table 1 Number and Market Capitalization of REITs (US$ million)
Equity Mortgage Hybrid
Year No. of REITs
Market
capitalization No. of REITs
Market
capitalization No. of REITs
Market capitalization 1980 35 942.2 21 509.5 19 846.8 1981 36 977.5 21 541.3 19 920.1 1982 30 1,071.4 20 1,133.4 16 1,093.8 1983 26 1,468.6 19 1,460.0 14 1,328.7 1984 25 1,794.5 20 1,801.3 14 1,489.4 1985 37 3,270.3 32 3,162.4 13 1,241.2 1986 45 4,336.1 35 3,625.8 16 1,961.7 1987 53 4,758.5 38 3,161.4 19 1,782.4 1988 56 6,141.7 40 3,620.8 21 1,672.6 1989 56 6,769.6 43 3,536.3 21 1,356.3 1990 58 5,551.6 43 2,549.2 18 636.3 1991 86 8,785.5 28 2,586.3 24 1,596.4 1992 89 11,171.1 30 2,772.8 23 1,968.1 1993 135 26,081.9 32 3,398.5 22 2,678.2 1994 175 38,812.0 29 2,502.7 22 2,991.3 1995 178 49,913.0 24 3,395.4 17 4,232.9 1996 166 78,302.0 20 4,778.6 13 5,695.8 1997 176 127,825.3 26 7,370.3 9 5,338.2 1998 173 126,904.5 28 6,480.7 9 4,916.2 1999 167 118,232.7 26 4,441.7 10 1,587.5 2000 158 134,431.0 22 1,632.0 9 2,652.4 2001 151 147,092.1 22 3,990.5 9 3,816.0 2002 149 151,271.5 20 7,146.4 7 3,519.4 2003 144 204,800.4 20 14,186.5 7 5,225.0 2004 153 275,291.0 33 25,964.3 7 6,639.4 2005 152 301,491.0 37 23,393.7 8 5,806.6 2006 138 400,471.4 38 29,195.3 7 8,134.3
Table 2 Summary Distribution of REITs Sample
Sample size Average Offer Size (US $ million) Distribution of lockup period (days) Year Full sample Lockup No lockup Full sample Lockup No lockup
Average lockup period (days) <180 (%) 180 (%) >180 (%) 1980 1 0 1 30.00 0.00 30.00 0 0.00 0.00 0.00 1981 0 0 0 0.00 0.00 0.00 0 0.00 0.00 0.00 1982 1 0 1 100.00 0.00 100.00 0 0.00 0.00 0.00 1983 1 0 1 22.50 0.00 22.50 0 0.00 0.00 0.00 1984 1 0 1 12.20 0.00 12.20 0 0.00 0.00 0.00 1985 7 0 7 71.10 0.00 71.10 0 0.00 0.00 0.00 1986 5 0 5 45.80 0.00 45.80 0 0.00 0.00 0.00 1987 4 0 4 90.90 0.00 90.90 0 0.00 0.00 0.00 1988 1 1 0 160.00 160.00 0.00 120 100.00 0.00 0.00 1989 1 0 1 247.00 0.00 247.00 0 0.00 0.00 0.00 1990 0 0 0 0.00 0.00 0.00 0 0.00 0.00 0.00 1991 2 1 1 67.45 6.90 128.00 365 0.00 0.00 100.00 1992 3 2 1 155.30 168.90 128.10 228 50.00 0.00 50.00 1993 40 27 13 178.46 183.37 168.25 411 0.00 15.00 85.00 1994 37 28 9 147.94 159.35 112.43 392 7.00 11.00 82.00 1995 5 5 0 154.26 154.26 0.00 508 0.00 20.00 80.00 1996 6 6 0 182.50 182.50 0.00 273 33.33 33.33 33.33 1997 18 16 2 222.03 219.66 241.00 266 6.00 56.00 38.00 1998 7 5 2 149.49 159.18 125.25 290 0.00 80.00 20.00 1999 1 1 0 12.00 12.00 0.00 30 100.00 0.00 0.00 2000 0 0 0 0.00 0.00 0.00 0 0.00 0.00 0.00 2001 0 0 0 0.00 0.00 0.00 0 0.00 0.00 0.00 2002 2 2 0 248.45 248.45 0.00 180 0.00 100.00 0.00 2003 5 5 0 401.12 401.12 0.00 216 0.00 80.00 20.00 2004 13 13 0 255.88 255.88 0.00 201 8.00 69.00 23.00 2005 6 6 0 222.75 222.75 0.00 275 0.00 67.00 33.00 2006 2 2 0 792.85 792.85 0.00 180 0.00 100.00 0.00 Total 169 120 49 180.75 207.15 116.12 325 7.00 37.00 56.00
Table 3 Summary Statistics for REIT IPOs with Lockups Panel A. Full sample
Sample size (n) Average offer size (US$ million) Average lockup period (days) Average institutional ownership
120 207.15 325 53.08
Panel B: Institutional ownership
All % > Median % < Median
Sample size (n) Mean (%) Std. dev. (%) Sample size (n) Mean (%) Std. dev. (%) Sample size (n) Mean (%) Std. dev. (%) 99 53.08 26.34 49 71.72 17.28 50 34.80 20.18
Panel C: Insider ownership
All % > Median % < Median
Sample size (n) Mean (%) Std. dev. (%) Sample size (n) Mean (%) Std. dev. (%) Sample size (n) Mean (%) Std. dev. (%) 82 14.72 13.38 41 23.68 13.68 41 5.76 3.29
Panel D: Management type
Management type Sample size (n) Average offer size (US$ million) Average lockup period (days) Average institutional ownership (%)
Self-managed 90 210.27 348 56.91
Externally managed 27 155.36 258 40.83
Panel E: Property type
Majority property type Sample size (n)
Average offer size (US$ million) Average lockup period (days) Average institutional ownership (%) Retail 26 207.27 333 53.34 Residential 28 186.15 380 56.12 Office/industrial 32 228.20 337 56.87 Lodging/resorts 19 150.12 220 37.87 Others 15 273.45 320 56.95
Table 4 Tobit Analysis
Model 1 Model 2 Model 3
Intercept 0.75 (0.31) –0.72 (–0.30) –1.57 (–0.64) TOP6_AUDITOR 0.12 (0.16) 0.30 (0.40) 0.14 (0.18) UNDERWRITER_RANK –0.39 (–2.01)** –0.24 (–1.18) –0.27 (–1.33) LNPROCEEDS 1.06 (2.87)*** (2.44)** 0.88 (2.71)*** 1.00 MSE 0.08 (0.13) –0.21 (–0.33) –0.12 (–0.19) SELF MGT 1.20 (1.99)** (2.32)** 1.57 (2.24)** 1.51 RETAIL 0.33 (0.40) 0.29 (0.35) RESIDENTIAL 1.27 (1.47) 1.22 (1.42) OFFICE_INDUSTRIAL 1.31 (1.58) 1.22 (1.48) LODGING_RESORT 2.85 (2.99)*** 2.71 (2.84)*** BULL 0.87 (1.54) Sample size 152 152 152
This table reports the results for Tobit analysis. The dependent variable is the logarithm of 1 plus lockup length. TOP6_AUDITOR is a dummy variable with a value of 1 if the auditor is one of the top six auditing firms, and zero otherwise. LNPROCEEDS is the logarithm of offer size, which is the product of the number of IPO shares and the offer price. MSE is the mean square error of the market model; it is used as a proxy for idiosyncratic risk. UNDERWRITER_RANK is a measure of the reputation of the lead underwriter using Carter-Manaster rankings. SELF-MGT is equal to 1 for self-managed REITs, and zero otherwise. RETAIL, RESIDENTIAL, OFFICE_INDUSTRIAL, and LODGING_RESORT are dummy variables with a value of 1 if the REIT concentrates on the type of property indicated, and zero otherwise. BULL is equal to 1 if there was a bull market over the 12 months before the offering, and zero otherwise. *** and ** indicate significance at the 1% and 5% level, respectively.
Table 5 Cumulative Abnormal Return around the Expiration of the IPO Lockup Period
Cumulative abnormal return
Event Date Mean (%) Median (%)
Day –5 –0.16 (–1.26) –0.10 Day –4 0.01 (0.07) –0.11 Day –3 –0.01 (–0.08) –0.09 Day –2 –0.07 (–0.53) –0.07 Day –1 –0.10 (–0.73) –0.23 Day 0 –0.19 (–1.44) –0.15 Day +1 0.05 (0.33) –0.04 Day +2 0.06 (0.38) –0.07 Day +3 0.04 (0.34) 0.10 Day +4 0.02 (0.13) –0.07 Day +5 –0.11 (–0.69) 0.03 Days –5 to +5 –0.50 (–1.12) –0.46 Days –5 to –1 –0.34 (–1.10) –0.55** Days –1 to +1 –0.26 (–1.15) –0.28 Days 0 to +5 –0.15 (–0.45) –0.23 Sample size 120 % of negative CAR (–1 ,+1) 54.17
T-statistics (the Wilcoxon signed rank test) are in parentheses and are used to test whether the mean
Table 6 Cumulative Abnormal Return around the Expiration of the IPO Lockup Period, Classified by
Insider Trading
Panel A: REITs with Insider Trading within 10 days before and after the Unlock Date
REITs with insider trading REITs without insider trading
(1) number of observation 24 52 (2) CAR (-5, +5) 0.28% (0.38) 0.34% (0.49) (-1, +1) 0.51% (0.85) -0.14% (-0.42) (0, +1) -0.14% (-0.33) -0.15% (-0.50)
Panel B: REITs with Insider Sell within10 days before and after the Unlock Date
(1) number of observation 3 (2) CAR (-5, +5) 0.37% (0.12) (-1, +1) -1.56% (-0.50) (0, +1) -0.35% (-0.18) Inside parentheses are t-statistics
Table 7 Cumulative Abnormal Return around the Expiration of the IPO Lockup Period – by Subgroups
Panel A: Classified by Institutional Ownership
Cumulative abnormal return
Event date Institutional ownership > Median (%) Institutional ownership < Median (%)
Day 0 –0.05 (–0.28) –0.49 (–2.07)** Days –5 to +5 –0.29 (–0.53) –1.02 (–1.21) Days –5 to –1 –0.26 (–0.65) 0.03 (0.05) Days –1 to +1 –0.51 (–1.53) –0.21 (–0.58) Days 0 to +5 –0.03 (–0.07) –1.06 (–1.89)* Sample size 49 50 % of negative CAR (–1 ,+1) 48.98 62
Panel B: Classified by Insider Ownership
Cumulative abnormal return
Event date Insider Ownership > Median (%) Insider Ownership < Median (%)
Day 0 –0.39 (–1.79)* –0.31 (–1.11) Days –5 to +5 (–0.10) –0.08 (–0.94) –0.76 Days –5 to –1 –0.22 (–0.34) –0.40 (–0.83) Days –1 to +1 (–0.68) –0.25 (–1.63) –0.69 Days 0 to +5 0.12 (0.29) –0.36 (–0.56) Sample size 41 41 % of negative CAR (–1 ,+1) 51.22 53.66
Panel C: Classified by Management Types.
Cumulative Abnormal Return
Event date Self–managed (%) Externally managed (%)
Day 0 –0.18 (–1.31) –0.24 (–0.66) Days –5 to +5 (–1.68)* –0.72 (0.32) 0.43 Days –5 to –1 –0.61 (–1.95)* 0.62 (0.71) Days –1 to +1 (–1.93)* –0.46 (0.67) 0.38 Days 0 to +5 (–0.23) –0.08 (–0.25) –0.22 Sample size 90 27 % of negative CAR (–1 ,+1) 54.44 48.15
Table 8 Abnormal Trading Volume for Event Window (–25 to +25)
Day All REITs (%)
–25 -15.52* –24 -6.96 –23 -12.15 –22 -21.41** –21 -10.90 –20 -1.11 –19 -7.42 –18 -13.84** –17 86.28 –16 7.90 –15 -3.22 –14 22.02 –13 -14.60 –12 2.20 –11 -10.38 –10 8.20 –9 -10.26 –8 -13.58 –7 12.86 –6 -10.40 –5 3.08 –4 -18.70** –3 12.78 –2 3.21 –1 -18.46** 0 -12.57 1 13.82 * 2 36.23 3 8.54 4 -0.75 5 13.03 6 -0.13 7 -4.42 8 10.70 9 29.55 10 6.83 11 61.56 12 9.82 13 -9.45 14 -7.53 15 -24.16*** 16 69.25 17 11.04 18 2.70 19 -2.47 20 13.12 21 -11.96 22 68.87 23 10.31 24 -13.14 25 -13.59
Table 9 Regression Analysis CAR (–5, +5) CAR (–1, +1) AR (0) INTERCEPT 0.0141 (0.30) 0.0134 (0.60) –0.0126 (–0.89) LNPROCEEDS –0.0001 (–0.02) (–0.14) –0.0006 (1.13) 0.0029 INSTITUTION 0.0008 (2.27)** –0.0001 (–0.46) -0.0000 (-0.03) SELF_MGT –0.0230 (–1.20) (–2.00)** –0.0178 (–0.42) –0.0024 ATV –0.0007 (–1.25) 0.0009 (0.49) –0.0022 (–1.21) INSIDER 0.0003 (0.56) 0.0005 (2.29)** 0.0002 (1.26) RETAIL –0.029 (–1.23) –0.0070 (–0.62) –0.0044 (–0.61) RESIDENTIAL 0.0028 (0.12) 0.0051 (0.46) 0.0069 (0.97) OFFICE/INDUSTRIAL –0.0159 (–0.69) (–0.23) –0.0026 (-0.19) -0.0013 LODGING/RESORTS -0.0079 (-0.31) –0.0214 (–1.76)* –0.0021 (–0.27) UNDERWRITER_RANK –0.0044 (–0.82) (–0.07) –0.0002 (–0.52) –0.0008 Sample size 79 79 79 Adjusted R2 0.0294 0.0663 –0.0374
This table reports the results for the regression analysis of the determinants of market responses around the unlock date. The dependent variables are the cumulative abnormal returns for event windows (–5, +5) and (–1, +1) and the abnormal return on the event date. LNPROCEEDS is the logarithm of offer size, which is the product of the number of IPO shares and the offer price. INSTITUTION is equal to 1 for REITs with institutional ownership greater than the sample mean, and zero otherwise. SELF-MGT is equal to 1 for self-managed REITs, and zero otherwise. RETAIL, RESIDENTIAL, OFFICE_INDUSTRIAL, and LODGING_RESORT are dummy variables, which equal 1 if the REIT concentrates on the type of property indicated, and zero otherwise. UNDERWRITER_RANK is a measure of the reputation of the lead underwriter using Carter–Manaster rankings. ATV is the abnormal trading volume for the corresponding event window. INSIDER is the insider ownership six months before the unlock date. White (1980) heteroskedasticity-consistent standard error and covariance are used. Inside parentheses are t-statistics. ***, ** and * indicate significance at the 1%, 5% and 10% level, respectively.
第二年 中文摘要 本文分析不動產投資信託主併公司的宣告效果。結果發現當公開發行的不動產投 資信託購併公開發行的不動產投資信託時,股價呈現負的異常報酬,但是如果被 併者屬於同一集團時,則沒有任何顯著的正或負報酬產生。當公開發行的不動產 投資信託併購未公開交易的私人不動產投資信託時,主併公司產生相當顯著的正 報酬,然而該報酬主要來自於資產的收購而非公司的合併。 關鍵字: 不動產投資公司、 宣告效果、主併公司、被併公司
Second Year Abstract
We examine the announcement effects for acquirers around REIT merger and acquisitions. The result shows that when REITs announce to merge with a publicly traded REIT that belongs to the same conglomerate, no abnormal returns are observed. However, acquirers have significant negative announcement returns if the target firms are not in the same conglomerate. On the other hand, the market reacts to the announcement significantly positive if the acquires purchase private assets that are not within the same conglomerate.
Keywords: Real Estate Investment Trusts, Announcement Effect, Acquirer, private