Re: Manuscript ID: OI-2010-02-0088 Revision 2
1
A population-based eight-year trend of distal radial fractures in adults in Taiwan
2
New title: A population-based study on trend in incidence of distal radial fractures in
3
adults in Taiwan in 2000-2007
4 1,2.
Chun-Hao Tsai, MD, 3,4.Chih-Hsin Muo, Ms, 1,2 Yi-Chin Fong, MS, 2Wan-Yu Lo, PhD, 5
1
Yen-Jen Chen, MD, 1. Horng-Chang Hsu, MD, 3,4*Fung-Chang Sung, PhD, MPH 6
7 1.
Department of Orthopedics, China Medical University and Hospital, Taichung 404, Taiwan; 8
2
. Graduate Institute of Integrated Medicine, China Medical University and Hospital, 9
Taichung, Taiwan 10
3
Management Office for Health Data, China Medical University and Hospital, Taichung 404, 11
Taiwan; 12
.4
Department of Public health, China Medical University and Hospital, Taichung 404, 13
Taiwan; 14
15
* Horng-Chang Hsu and Fung-Chang Sung contributed equally to this work. 16
17
Address correspondence and reprint requests to: 18
Fung-Chang Sung, PhD, MPH 19
Professor and Dean 20
China Medical University and Hospital College of Public Health 21
91 Hsueh Shih Road, 22 Taichung 404, Taiwan 23 Phone: +884-4-2203-5740 24 Fax: +886-4-2201-9901 25
E-mail: [email protected]; [email protected] 26
27
Word count: 147 in the abstract, 2140 in the text, 3 tables and 2 figures. 28
29
Statement regarding potential conflict of interest/disclosure
1
Neither the authors nor any of their family members have commercial associations or sources 2
of support that might pose a conflict of interest. No benefits in any form have been or will be 3
received from a commercial party related directly or indirectly to the subject of this 4
manuscript. All authors have made substantive contributions to the study, and all authors 5
endorse the data and conclusions. 6
7
Mini-abstract
8
This population-based study was conducted using claims data obtained from the National 9
Health Insurance to investigate the trend in incidence of distal radial fractures in adults in 10
Taiwan from 2000 to 2007. Our results revealed an increasing trend, particularly among 11
women >50 years of age. 12 13 14 15 16 17 18 19
Abstract
1 2
This population-based study used insurance claims data from 2000 to 2007 obtained from 3
the National Health Research Institute to investigate the longitudinal trend in distal radial 4
fractures in adults ≥20 years in Taiwan. We estimated the age- and gender-specific annual 5
incidence rates of distal radial fracture and compared the differences in distribution by 6
sociodemographic status between patients with and those without distal radial fracture and the 7
differences in incidence rates between 2000 and 2007. The incidence of fracture was higher in 8
women than in men. The overall female-to-male rate ratios were 1.52 in 2000 (12.3 versus 9
8.06 per 10,000 persons) and 1.89 in 2007 (18.9 versus 10.0 per 10,000 persons). There was 10
marked increase in age-specific incidence beginning in the 50-54-year age group, particularly 11
among women. These results imply the need for more effective intervention for the 12
prevention of subsequent fracture and disability, particularly for perimenopausal women. 13
14
Key words: chronological trend, distal radial fractures, retrospective cohort study, universal
15 health insurance 16 17 18 19
Introduction
1
Fracture of the distal radius is one of the most common osteoporosis-related fractures. It is 2
well known that previous wrist fracture is associated with a significantly increased risk of 3
future fracture [1-5]. In addition, up to 30% of affected individuals may suffer from long-term 4
complications [6-7]. Population-based studies have suggested that fracture is associated with 5
an increased risk of subsequent hip fracture [8-9]. 6
The epidemiological features of fracture vary among populations and are associated with 7
race, socioeconomic status, culture, degree of urbanization, and other population 8
characteristics [10-25]. The epidemiological features of distal forearm fracture have been 9
reported in general population-based studies in Scandinavian countries, the UK, and North 10
America. 11
Few epidemiological studies have investigated the chronological trend of distal forearm 12
fracture using nation-wide data. Although data on the changes in incidence of distal radial 13
fracture are available for some European populations [13, 16, 24], few studies on the changes 14
in the trend in incidence of distal radial fractures have been conducted in Asian populations 15
[26-27]. 16
The aims of the present study were to report the annual chronological trend in incidence of 1
distal forearm fracture during the period 2000 to 2007 in Taiwan, to explore the factors 2
associated with the trend, and to compare our findings with recent data from other countries. 3
4
Materials and Methods
5
Data source 6
In March 1995, the Bureau of National Health Insurance, Taiwan Department of 7
Health, consolidated all of the health insurance systems into a universal National Health 8
Insurance system. By the end of 1996, this universal insurance system covered approximately 9
96% of the 23 million people living in Taiwan and contracted with 97% of the hospitals and 10
clinics on the island. The National Health Research Institute (NHRI) of the Department of 11
Health established several randomly selected claim files representative of the whole 12
population for administrative use and research. We obtained insurance claims data of 13
1,000,000 persons randomly selected from all insured persons in Taiwan in 2000. The sex and 14
age distributions were similar to those of the entire insured population registered with the 15
Ministry of Interior. The database provided information on all medical services received by 16
each individual from 1996 to 2007 as well as the characteristics of the patients, hospitals and 17
physicians. 18
The information we used for this study included claims data with dates of outpatient and 1
inpatient services. Individuals included in this study were followed up until the end of 2007 or 2
until being censored because of death, loss to follow-up, or withdraw from the insurance 3
system. Patients with fracture diagnosed during the period 1996-2000 were excluded. 4
5
Selected study population and Statistical analysis 6
We identified a total of 6,906 patients aged ≥20 years with newly diagnosed distal radial 7
fractures during the period 2000-2007. To ensure that all patients were identified, we 8
monitored all inpatient and outpatient services to search for patients with evidence of incident 9
distal fracture. We used the International Classification of Diseases, Ninth Revision, Clinical 10
Modification (ICD-9-CM) code 813.4 to capture the cases. Individuals with fracture before 11
2000 and those with repeat fracture were not included in the analyses. For each patient, four 12
controls were randomly selected from among people aged ≥ 20 years without a history of 13
distal radial fracture. 14
Data analyses consisted of two parts. One used the entire patient population to show the 15
overall trend in distal radial fracture during the study period. The other compared only data in 16
2000 with data in 2007 in order to differentiate change in fracture incidence between these 17
two periods (Table 3). We first calculated the annual incidence rates of fracture by gender and 18
calculated the female–to–male rate ratios. Annual incidence rates were also estimated by age 19
and gender. Linear regression analysis was performed to examine the chronological trend in 1
incidence of distal radial fracture. The incidence rates and confidence intervals (CI 95%) were 2
estimated with Poisson regression. 3
Distributions of sociodemographic factors by sex, age, urbanization level, occupation, and 4
income were compared between patients with fracture and those without fracture. The odds 5
ratio (OR) and 95% CI were estimated using logistic regression models with and without 6
controlling for sociodemographic factors. Model 1 shows the univariate analyses and model 2 7
shows the multivariable logistical regression analyses controlling for sex, age, urbanization, 8
occupation, and income. We calculated the population density (persons/km2) of each township 9
or district where the patient or control subject resided. Areas with a population density in the 10
highest quartile were classified as high urbanization areas, those in the second quartile were 11
classified as moderate urbanization areas, and those in the third and fourth quartiles were 12
classified as low urbanization areas. 13
We also calculated the age- and sex-specific incidence rates and 95% confidence 14
intervals in 2000 and in 2007. Patients were stratified into 12 five-year age groups ranging 15
from 20 years to ≥70 years of age (Table 3). Female-to-male rate ratios and 95% confidence 16
intervals were also calculated separately for each age group in 2000 and in 2007. The 2007-17
to-2000 rate ratios were also measured. Statistical analyses were performed by the SAS 18
statistical package (version 9.1; SAS Institute, Cary, NC). A p value <0.05 was considered to 1
represent statistical significance. 2
3
Results
4
The majority of the 6,906 patients with distal radial fracture identified during the 5
period 2000-2007 were women (N=4,323, 62.6%). Female patients tended to be older than 6
male patients (61.3 ± 15.3 vs. 47.3 ± 18.1; data not shown) and more likely to be blue-collar 7
workers, living in lower urbanized areas, and to have lower income. 8
The annual age- and sex-specific incidence rates of distal radial fracture increased with 9
age in both genders during the study period (Figure 1). There was a greater incremental 10
increase in incidence among women than among men, particularly among women in the older 11
age groups. The average annual incidence among men aged ≥70 years was 2.02 times greater 12
than that among men in the youngest age group. The corresponding ratio was 17.7 times in 13
women. The average incidence in the ≥ 60-year age group was approximately 3.4 times 14
higher among women than that among men. The average overall incidence was 14.5 per 15
10,000 persons during the study period, and was higher among women than among men (18.9 16
verse 10.0 per 10,000 persons in 2007) (Table 1). The overall incidence increased by 42.2% in 17
the 8-year period, from 10.2 to 14.5 per 10,000 persons (p for trend < 0.0001). The annual 18
female-to-male rate ratios ranged from 1.52 (95% CI 1.31- 1.78) to 1.89 (95% CI 1.31- 1.78). 19
Logistic regression analyses revealed that patients in the 30-39-year age group were at 1
the lowest risk of fracture (Table 2). Multivariate analysis (model 2) showed that the risk of 2
distal radial fracture for women dropped slightly. Relative to patients 30-39 years of age, risk 3
of fracture increased significantly with age to an OR of 7.19 (95% CI 6.43-8.04) for those in 4
>70 years of age. In addition, patients in the 20-29-year age group were also at higher risk. 5
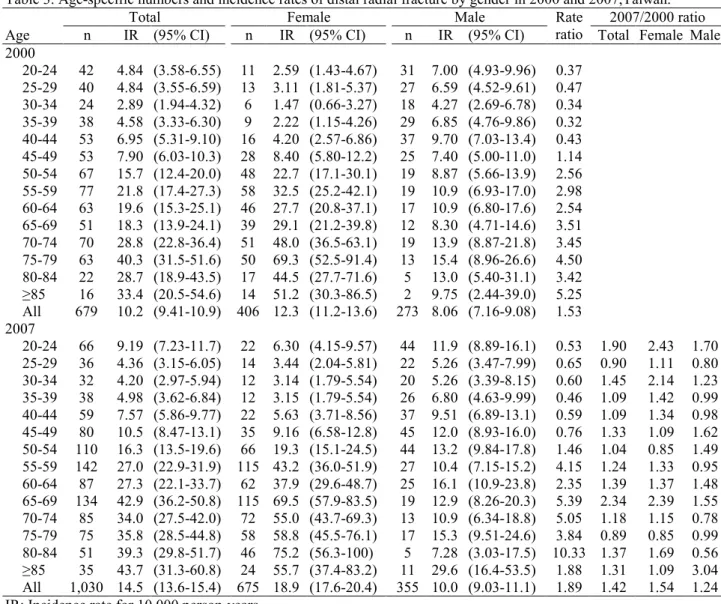
We compared 679 patients with distal radial fracture in 2000 with 1,030 patients with 6
the fracture in 2007 (Table 3). Most of the age- and sex-specific incidence rates in 2007 were 7
greater than those in 2000 for both genders with an overall rate ratio of 1.42. The women-to-8
men rate ratio increased as age increased and ranged from 3 to 10 starting at 50 years of age. 9
Figure 2 shows that the incidence rate increased markedly in men aged 45 to 64 years and in 10
women aged 45 to ≥ 84 years. 11
12
Discussion
13
This population-based epidemiological study on adult distal forearm fracture demonstrated 14
that the incidence of this type of fracture increased annually during the period 2000-2007 in 15
Taiwan. Women were at greater risk than men during the 8-year study period with average 16
incidence rates of 15.1 per 10 000 persons in women and 9.5 per 10 000 persons in men. The 17
incidence in Taiwan is lower than that in Northern European countries and America [10-25]. 18
Relative to the Japanese population [26], the age-adjusted incidence rates in the Taiwanese 1
population are lower in women but quite similar in men. 2
Our results are in agreement with other studies that have shown that the incidence in 3
women increased dramatically with age beginning in the perimenopausal period until 79 years 4
of age (Figure 2). The age-specific incidence rate in men, however, increased at a slower pace. 5
The increasing trend in age-specific incidence of fracture in women in Taiwan is similar to 6
that in women in Scandinavian countries [13, 22] and in the UK [18, 25]. However, in Taiwan, 7
the rate rose slowly in the mid-sixth decade of life rather than leveling off as in those 8
countries [12, 26]. Studies conducted in Denmark [23] and Norway [16] have shown that the 9
incidence rates decrease after 75 years of age. 10
Our study also showed the mean age for wrist fracture in men was over a decade younger 11
than that in women. Further analysis revealed there were more incident traumatic wrist 12
fractures associated with fall or slip than with traffic accidents (52.1 vs. 39.0%; data not 13
shown), mainly because of the number of fractures in women. The incidence of fracture 14
sustained in motor vehicle accidents among all accident-related fractures was higher in men 15
than in women (44.2 vs. 34.9%; data not shown). We also found that the risk of fracture was 16
higher in June and July than in other months in a year (data not shown), a finding that 17
contradicts that reported in the UK by O’Neill et al. in which the highest incidence of fracture 18
occurred in winter [18]. Typhoons, which commonly occur in the summer months in Taiwan, 19
may increase the risk of fractures associated with fall and slip. The demographics of fracture 1
strongly suggest that men are less likely to incur osteoporosis-related fractures. 2
Oinuma and Sakuma recently reported that the combined incidence of compression 3
fractures of the spine, femoral neck fractures, distal radial fractures, and fractures of the 4
proximal end of the humerus increased from 499.9 in 2004 to 542.3 in 2005 and to 608.2 in 5
2006 per 100,000 population [30]. They reported that this increase was associated with senile 6
osteoporosis. Wigg et al. also reported that by 2021 there will be an 81% increase in the 7
incidence of distal forearm fractures in the Australian population aged ≥ 50 years mainly due 8
to the aging population in that country [13]. These findings are in line with our results, which 9
demonstrate that the incidence of adult distal radial fracture increased by 5% yearly during the 10
8-year study period, especially in women ≥ 60 years of age. 11
A few studies have reported that the increasing incidence of hip fracture in Taiwan can be 12
explained by the aging population and also by lifestyle changes [28,31]. Similar reasons may 13
explain the chronological trend in incidence of distal radial fracture found in the present study. 14
For example, we found that the proportion of elderly patients in our study population 15
increased from 8.3% in 2000 to 10.5% in 2007. Another explanation for the chronological 16
trend is the increased prevalence of osteoporosis. We found that the prevalence of 17
osteoporosis among patients with distal radial fracture was higher among older patients. 18
period 2005-2007 was 24.7% higher than that during the period 2000-2002 (data not shown). 1
This increase in prevalence of osteoporosis may be associated with lifestyle changes such as 2
those associated with lower dietary intake of calcium [29]. However, further analyses showed 3
that the increased utilization of the universal insurance program for osteopathic care might 4
have contributed to the annual increase. The number of medications prescribed for 5
osteoporosis increased 2.45% annually during the study period (data not shown). This may 6
explain the dramatic increase in number of patients diagnosed with and treated for distal 7
radial fracture in Taiwan. Unfortunately, DXA scan data were not available in the 8
reimbursement claims records. In the present study, the overall female-to-male incidence 9
ratio of distal radial fracture was about 1.73 in 2007. This ratio is lower than the 10
corresponding ratio in populations in other countries [16, 18, 20, 26, 32-33] 11
This study depicted an 8-year incident trend of distal radial fractures among a population 12
enrolled in a universal insurance system during the period 2000 to 2007 in Taiwan. To the 13
best of our knowledge, this is the first national population-based report for this Asian 14
population. We found that during the study period, there was an increasing trend in distal 15
radial fractures, and that the increase was greater in women than in men, particularly in those 16
aged ≥50 years. 17
18
Acknowledgement
1
This study was supported partly by the National Science Council, Executive Yuan, Taiwan, 2
Republic of China (grant number NSC 97-2625-M-039-003), China Medical University 3
Hospital (grant number 1MS1, DMR-98-067) and Taiwan Department of Health Clinical 4
Trial and Research Center for Excellence (grant number DOH99-TD-B-111-004) and Taiwan 5
Department of Health Cancer Research Center of Excellence (grant number DOH99-TD-C-6 111-005). 7 8 Reference: 9
[1] Mallmin H, Ljunghall S, Persson I, Naessen T, Krusemo UB, Bergstrom R. Fracture 10
of the distal forearm as a forecaster of subsequent hip fracture: a population-based cohort 11
study with 24 years of follow-up. Calcif Tissue Int 1993;52: 269-72. 12
[2] Cuddihy MT, Gabriel SE, Crowson CS, O'Fallon WM, Melton LJ, 3rd. Forearm 13
fractures as predictors of subsequent osteoporotic fractures. Osteoporos Int 1999;9: 469-75. 14
[3] Barrett-Connor E, Sajjan SG, Siris ES, Miller PD, Chen YT, Markson LE. Wrist 15
fracture as a predictor of future fractures in younger versus older postmenopausal women: 16
results from the National Osteoporosis Risk Assessment (NORA). Osteoporos Int 2008;19: 17
607-13. 18
[4] Siris ES, Miller PD, Barrett-Connor E, Faulkner KG, Wehren LE, Abbott TA, Berger 19
ML, Santora AC, Sherwood LM. Identification and fracture outcomes of undiagnosed low 20
bone mineral density in postmenopausal women: results from the National Osteoporosis Risk 21
Assessment. Jama 2001;286: 2815-22. 22
[5] Siris E, Miller P, Barrett-Connor E, Abbott T, Sherwood L, Berger M. Design of 23
NORA, the National Osteoporosis Risk Assessment Program: a longitudinal US registry of 24
postmenopausal women. Osteoporos Int 1998;8 Suppl 1: S62-9. 25
[6] Cooney WP, 3rd, Dobyns JH, Linscheid RL. Complications of Colles' fractures. J 26
Bone Joint Surg Am 1980;62: 613-9. 27
[8] Lauritzen JB, Schwarz P, McNair P, Lund B, Transbol I. Radial and humeral fractures 1
as predictors of subsequent hip, radial or humeral fractures in women, and their seasonal 2
variation. Osteoporos Int 1993;3: 133-7. 3
[9] Hegeman JH, Oskam J, van der Palen J, Ten Duis HJ, Vierhout PA. The distal radial 4
fracture in elderly women and the bone mineral density of the lumbar spine and hip. J Hand 5
Surg Br 2004;29: 473-6. 6
[10] Matkovic V, Kostial K, Simonovic I, Buzina R, Brodarec A, Nordin BE. Bone status 7
and fracture rates in two regions of Yugoslavia. Am J Clin Nutr 1979;32: 540-9. 8
[11] Solgaard S, Petersen VS. Epidemiology of distal radius fractures. Acta Orthop Scand 9
1985;56: 391-3. 10
[12] Miller SW, Evans JG. Fractures of the distal forearm in Newcastle: an epidemiological 11
survey. Age Ageing 1985;14: 155-8. 12
[13] Wigg AE, Hearn TC, McCaul KA, Anderton SM, Wells VM, Krishnan J. Number, 13
incidence, and projections of distal forearm fractures admitted to hospital in Australia. J 14
Trauma 2003;55:87-93. 15
[14] Falch JA. Epidemiology of fractures of the distal forearm in Oslo, Norway. Acta 16
Orthop Scand 1983;54: 291-5. 17
[15] Ahmed LA, Schirmer H, Bjornerem A, Emaus N, Jorgensen L, Stormer J, Joakimsen 18
RM. The gender- and age-specific 10-year and lifetime absolute fracture risk in Tromso, 19
Norway. Eur J Epidemiol 2009;24: 441-8. 20
[16] Lofthus CM, Frihagen F, Meyer HE, Nordsletten L, Melhuus K, Falch JA. 21
Epidemiology of distal forearm fractures in Oslo, Norway. Osteoporos Int 2008;19: 781-6. 22
[17] van Staa TP, Dennison EM, Leufkens HG, Cooper C. Epidemiology of fractures in 23
England and Wales. Bone 2001;29: 517-22. 24
[18] O'Neill TW, Cooper C, Finn JD, Lunt M, Purdie D, Reid DM, Rowe R, Woolf AD, 25
Wallace WA. Incidence of distal forearm fracture in British men and women. Osteoporos Int 26
2001;12: 555-8. 27
[19] Dennison E, Cooper C. Epidemiology of osteoporotic fractures. Horm Res 2000;54 28
Suppl 1: 58-63. 29
[20] Oskam J, Kingma J, Klasen HJ. Fracture of the distal forearm: epidemiological 30
developments in the period 1971-1995. Injury 1998;29: 353-5. 31
[21] Robertsson GO, Jonsson GT, Sigurjonsson K. Epidemiology of distal radius fractures 32
in Iceland in 1985. Acta Orthop Scand 1990;61: 457-9. 33
[22] Mallmin H, Ljunghall S. Incidence of Colles' fracture in Uppsala. A prospective study 34
of a quarter-million population. Acta Orthop Scand 1992;63: 213-5. 35
[23] Larsen CF, Lauritsen J. Epidemiology of acute wrist trauma. Int J Epidemiol 1993;22: 36
911-6. 37
[24] Lauritzen JB, Schwarz P, Lund B, McNair P, Transbol I. Changing incidence and 1
residual lifetime risk of common osteoporosis-related fractures. Osteoporos Int 1993;3: 127-2
32. 3
[25] Johansen A, Evans RJ, Stone MD, Richmond PW, Lo SV, Woodhouse KW. Fracture 4
incidence in England and Wales: a study based on the population of Cardiff. Injury 1997;28: 5
655-60. 6
[26] Hagino H, Yamamoto K, Ohshiro H, Nakamura T, Kishimoto H, Nose T. Changing 7
incidence of hip, distal radius, and proximal humerus fractures in Tottori Prefecture, Japan. 8
Bone 1999;24: 265-70. 9
[27] Oinuma T, Sakuma M, Endo N. Secular change of the incidence of four fracture types 10
associated with senile osteoporosis in Sado, Japan: the results of a 3-year survey. J Bone 11
Miner Metab 2010;28: 55-9. 12
[28] Chie WC, Yang RS, Liu JP, Tsai KS. High incidence rate of hip fracture in Taiwan: 13
estimated from a nationwide health insurance database. Osteoporos Int 2004;15: 998-1002. 14
[29] Shao CJ, Hsieh YH, Tsai CH, Lai KA. A nationwide seven-year trend of hip fractures 15
in the elderly population of Taiwan. Bone 2009;44: 125-9. 16
[30] Oinuma T , Sakuma M, Endo N. Secular change of the incidence of four fracture types 17
associated with senile osteoporosis in Sado, Japan: the results of a 3-year survey. J Bone 18
Miner Metab 2010;28:55-9. 19
[31] Huang KY, Chang JK, Ling SY, Endo N, Takahashi HE. Epidemiology of cervical 20
and trochanteric fractures of the proximal femur in 1996 in Kaohsiung City, Taiwan. J Bone 21
Miner Metab 2000;18: 89-95. 22
[32] Melton LJ, 3rd, Amadio PC, Crowson CS, O'Fallon WM. Long-term trends in the 23
incidence of distal forearm fractures. Osteoporos Int 1998;8: 341-8. 24
[33] Jonsson B, Bengner U, Redlund-Johnell I, Johnell O. Forearm fractures in Malmo, 25
Sweden. Changes in the incidence occurring during the 1950s, 1980s and 1990s. Acta Orthop 26
Scand 1999;70: 129-32. 27
28 29
1 6 T ab le 1 . G en d er -s p ec if ic a n n u al n u m b er s an d i n ci d en ce r at es o f d is ta l ra d ia l fr ac tu re i n T ai w an , 2 0 0 0 -2 0 0 7 T o ta l W o m en M en Y ea r N n IR (9 5 % C I) n IR (9 5 % C I) n IR (9 5 % C I) R at e ra ti o (9 5 % C I) 2 0 0 0 6 6 8 ,9 8 7 6 7 9 1 0 .1 5 ( 9 .4 1 -1 0 .9 ) 4 0 6 1 2 .2 9 ( 1 1 .2 -1 3 .5 ) 2 7 3 8 .0 6 ( 7 .1 6 -9 .0 8 ) 1 .5 2 (1 .3 1 -1 .7 8 ) 2 0 0 1 6 7 3 ,9 3 3 7 4 8 1 1 .1 0 ( 1 0 .3 -1 1 .9 ) 4 6 0 1 3 .7 6 ( 1 2 .6 -1 5 .1 ) 2 8 8 8 .4 8 ( 7 .5 5 -9 .5 2 ) 1 .6 2 (1 .4 0 -1 .8 8 ) 2 0 0 2 6 7 8 ,4 6 8 7 7 7 1 1 .4 5 ( 1 0 .7 -1 2 .3 ) 4 6 7 1 3 .8 6 ( 1 2 .7 -1 5 .2 ) 3 1 0 9 .0 8 ( 8 .1 2 -1 0 .2 ) 1 .5 3 (1 .3 2 -1 .7 6 ) 2 0 0 3 6 8 4 ,4 8 6 7 8 7 1 1 .5 0 ( 1 0 .7 -1 2 .3 ) 4 8 9 1 4 .3 6 ( 1 3 .1 -1 5 .7 ) 2 9 8 8 .6 6 ( 7 .7 3 -9 .7 0 ) 1 .6 6 (1 .4 4 -1 .9 1 ) 2 0 0 4 6 9 1 ,5 3 4 9 0 2 1 3 .0 4 ( 1 2 .2 -1 3 .9 ) 5 8 0 1 6 .8 4 ( 1 5 .5 -1 8 .3 ) 3 2 2 9 .2 8 ( 8 .3 2 -1 0 .4 ) 1 .8 2 (1 .5 8 -2 .0 8 ) 2 0 0 5 6 9 9 ,5 8 3 9 6 8 1 3 .8 4 ( 1 2 .9 -1 4 .7 ) 6 2 0 1 7 .7 6 ( 1 6 .4 -1 9 .2 ) 3 4 8 9 .9 3 ( 8 .9 4 -1 1 .0 ) 1 .7 9 (1 .5 7 -2 .0 4 ) 2 0 0 6 7 0 5 ,5 7 5 1 ,0 1 5 1 4 .3 9 ( 1 3 .5 -1 5 .3 ) 6 2 6 1 8 .2 5 ( 1 6 .9 -1 9 .7 ) 3 8 9 1 1 .0 3 ( 9 .9 9 -1 2 .2 ) 1 .6 5 (1 .4 6 -1 .8 8 ) 2 0 0 7 7 1 0 ,7 5 7 1 ,0 3 0 1 4 .4 9 ( 1 3 .6 -1 5 .4 ) 6 7 5 1 8 .9 4 ( 1 7 .6 -2 0 .4 ) 3 5 5 1 0 .0 2 ( 9 .0 3 -1 1 .1 ) 1 .8 9 (1 .6 6 -2 .1 5 ) P f o r tr en d < 0 .0 0 0 1 < 0 .0 0 0 1 0 .0 0 3 IR : In ci d en ce r at e p er 1 0 ,0 0 0 p er so n -y ea rs R at e ra ti o : w o m en -t o -m en
1
Table 2. Comparison of socio-demographic characteristics and type of accident occurred between patients with distal radial fracture and those without fracture
Distal radial fracture Variable No N=27,624 Yes N=6,906 Model 1 Model 2 n (%) n (%) OR (95% CI) OR (95% CI) Sex Female 13,783 (49.9) 4,323 (62.6) 1.68 (1.59-1.77) 1.45 (1.38-1.55) Male 13,841 (50.1) 2,583 (37.4) 1.00 (reference) 1.00 (reference)
Age, years 20-29 6,489 (23.5) 811 (11.7) 1.37 (1.23-1.54) 1.34 (1.20-1.51) 30-39 6,192 (22.4) 564 (8.2) 1.00 (reference) 1.00 (reference) 40-49 6,202 (22.5) 977 (14.2) 1.73 (1.55-1.93) 1.70 (1.52-1.90) 50-59 3,933 (14.2) 1,485 (21.5) 4.14 (3.73-4.60) 3.96 (3.56-4.40) 60-69 2,470 (8.9) 1,374 (19.9) 6.11 (5.48-6.81) 4.49 (4.91-6.14) ≥70 2,338 (8.5) 1,695 (24.5) 7.96 (7.15-8.85) 7.19 (6.43-8.04) Urbanization Low 3,377 (12.2) 1,094 (15.8) 1.44 (1.34-1.56) 1.08 (0.99-1.17) Moderate 5,732 (20.5) 1,649 (23.9) 1.28 (1.20-1.36) 1.16 (1.09-1.25) High 18,515 (67.0) 4,163 (60.3) 1.00 (reference) 1.00 (reference)
Occupation
White collar 15,197 (55.0) 2,999 (43.4) 1.00 (reference) 1.00 (reference) Blue collar 8,580 (31.1) 2,912 (42.2) 1.72 (1.63-1.82) 1.08 (0.99-1.16) Others 3,847 (13.9) 995 (14.4) 1.31 (1.21-1.42) 0.95 (0.86-1.04) Income (NTD) < 9,999 9,501 (34.4) 2,630 (38.1) 1.67 (1.55-1.80) 1.12 (1.03-1.23) 10,000-19,999 10,003 (36.2) 2,930 (42.4) 1.77 (1.65-1.90) 1.16 (1.07-1.27) ≥20,000 8,120 (29.4) 1,346 (19.5) 1.00 (reference) 1.00 (reference) Logistic regression: Model 1 for univariate analysis; Model 2 for mutivariable analysis. NTD: New Taiwan Dolar, 1.0 USD is about 32.0-34.0 NTD.
1 2 0 10 20 30 40 50 60 70 80 2000 2001 2002 2003 2004 2005 2006 2007 In c id e n c e ( p e r 1 0 ,0 0 0 ) Female 20-39 Male 20-39 Female 40-49 Male 40-49 Female 50-59 Male 50-59 Female 60-69 Male 60-69 Female ≥70 Male ≥70 3 4 5
Figure 1. Age- and sex-specific incidence rates of distal radial fracture in 2000-2007, 6
Taiwan. 7
1 9 0 1 0 2 0 3 0 4 0 5 0 6 0 7 0 8 0 9 0 1 0 0 2 0 -2 4 2 5 -2 9 3 0 -3 4 3 5 -3 9 4 0 -4 4 4 5 -4 9 5 0 -5 4 5 5 -5 9 6 0 -6 4 6 5 -6 9 7 0 -7 4 7 5 -7 9 8 0 -8 4 ≥ 8 5 A g e g ro u p , ye a rs F e m a le 2 0 0 0 F e m a le 2 0 0 7 M a le 2 0 0 0 M a le 2 0 0 7 u re 2 . A g a n d s ex -s p ec if ic i n ci d en ce r at es o f d is ta l ra d ia l fr ac tu re f o r th e p o p u la ti o n i n 2 0 0 0 a n d 2 0 0 7 , T ai w an .
1
Table 3. Age-specific numbers and incidence rates of distal radial fracture by gender in 2000 and 2007,Taiwan.
Total Female Male 2007/2000 ratio
Age n IR (95% CI) n IR (95% CI) n IR (95% CI)
Rate
ratio Total Female Male 2000 20-24 42 4.84 (3.58-6.55) 11 2.59 (1.43-4.67) 31 7.00 (4.93-9.96) 0.37 25-29 40 4.84 (3.55-6.59) 13 3.11 (1.81-5.37) 27 6.59 (4.52-9.61) 0.47 30-34 24 2.89 (1.94-4.32) 6 1.47 (0.66-3.27) 18 4.27 (2.69-6.78) 0.34 35-39 38 4.58 (3.33-6.30) 9 2.22 (1.15-4.26) 29 6.85 (4.76-9.86) 0.32 40-44 53 6.95 (5.31-9.10) 16 4.20 (2.57-6.86) 37 9.70 (7.03-13.4) 0.43 45-49 53 7.90 (6.03-10.3) 28 8.40 (5.80-12.2) 25 7.40 (5.00-11.0) 1.14 50-54 67 15.7 (12.4-20.0) 48 22.7 (17.1-30.1) 19 8.87 (5.66-13.9) 2.56 55-59 77 21.8 (17.4-27.3) 58 32.5 (25.2-42.1) 19 10.9 (6.93-17.0) 2.98 60-64 63 19.6 (15.3-25.1) 46 27.7 (20.8-37.1) 17 10.9 (6.80-17.6) 2.54 65-69 51 18.3 (13.9-24.1) 39 29.1 (21.2-39.8) 12 8.30 (4.71-14.6) 3.51 70-74 70 28.8 (22.8-36.4) 51 48.0 (36.5-63.1) 19 13.9 (8.87-21.8) 3.45 75-79 63 40.3 (31.5-51.6) 50 69.3 (52.5-91.4) 13 15.4 (8.96-26.6) 4.50 80-84 22 28.7 (18.9-43.5) 17 44.5 (27.7-71.6) 5 13.0 (5.40-31.1) 3.42 ≥85 16 33.4 (20.5-54.6) 14 51.2 (30.3-86.5) 2 9.75 (2.44-39.0) 5.25 All 679 10.2 (9.41-10.9) 406 12.3 (11.2-13.6) 273 8.06 (7.16-9.08) 1.53 2007 20-24 66 9.19 (7.23-11.7) 22 6.30 (4.15-9.57) 44 11.9 (8.89-16.1) 0.53 1.90 2.43 1.70 25-29 36 4.36 (3.15-6.05) 14 3.44 (2.04-5.81) 22 5.26 (3.47-7.99) 0.65 0.90 1.11 0.80 30-34 32 4.20 (2.97-5.94) 12 3.14 (1.79-5.54) 20 5.26 (3.39-8.15) 0.60 1.45 2.14 1.23 35-39 38 4.98 (3.62-6.84) 12 3.15 (1.79-5.54) 26 6.80 (4.63-9.99) 0.46 1.09 1.42 0.99 40-44 59 7.57 (5.86-9.77) 22 5.63 (3.71-8.56) 37 9.51 (6.89-13.1) 0.59 1.09 1.34 0.98 45-49 80 10.5 (8.47-13.1) 35 9.16 (6.58-12.8) 45 12.0 (8.93-16.0) 0.76 1.33 1.09 1.62 50-54 110 16.3 (13.5-19.6) 66 19.3 (15.1-24.5) 44 13.2 (9.84-17.8) 1.46 1.04 0.85 1.49 55-59 142 27.0 (22.9-31.9) 115 43.2 (36.0-51.9) 27 10.4 (7.15-15.2) 4.15 1.24 1.33 0.95 60-64 87 27.3 (22.1-33.7) 62 37.9 (29.6-48.7) 25 16.1 (10.9-23.8) 2.35 1.39 1.37 1.48 65-69 134 42.9 (36.2-50.8) 115 69.5 (57.9-83.5) 19 12.9 (8.26-20.3) 5.39 2.34 2.39 1.55 70-74 85 34.0 (27.5-42.0) 72 55.0 (43.7-69.3) 13 10.9 (6.34-18.8) 5.05 1.18 1.15 0.78 75-79 75 35.8 (28.5-44.8) 58 58.8 (45.5-76.1) 17 15.3 (9.51-24.6) 3.84 0.89 0.85 0.99 80-84 51 39.3 (29.8-51.7) 46 75.2 (56.3-100) 5 7.28 (3.03-17.5) 10.33 1.37 1.69 0.56 ≥85 35 43.7 (31.3-60.8) 24 55.7 (37.4-83.2) 11 29.6 (16.4-53.5) 1.88 1.31 1.09 3.04 All 1,030 14.5 (13.6-15.4) 675 18.9 (17.6-20.4) 355 10.0 (9.03-11.1) 1.89 1.42 1.54 1.24 IR: Incidence rate for 10,000 person-years
Rate ratio: females-to-males 2