行政院國家科學委員會專題研究計畫 成果報告
壓電傳感元件之波傳耦合層設計與元件整體之力電作用表
現研究
研究成果報告(精簡版)
計 畫 類 別 : 個別型
計 畫 編 號 : NSC 95-2221-E-002-116-
執 行 期 間 : 95 年 08 月 01 日至 96 年 07 月 31 日
執 行 單 位 : 國立臺灣大學材料科學與工程學系暨研究所
計 畫 主 持 人 : 謝宗霖
計畫參與人員: 博士班研究生:黃俊銘
碩士班研究生:柯忠廷
大學部專題生:連柏翰
協同研究人員:段維新教授、陳俊杉教授
報 告 附 件 : 出席國際會議研究心得報告及發表論文
處 理 方 式 : 本計畫可公開查詢
中 華 民 國 96 年 10 月 23 日
行政院國家科學委員會補助專題研究計畫
*
成 果 報 告
□期中進度報告
壓電傳感元件之波傳耦合層設計與元件整體之
力電作用表現研究
計畫類別:
*
個別型計畫 □ 整合型計畫
計畫編號:
NSC 95–2221–E–002–116 –
執行期間: 2006 年 8 月 1 日 至 2007 年 7 月 31 日
計畫主持人:謝宗霖
共同主持人:
計畫參與人員:段維新教授(協同研究人員)、陳俊杉教授(協同研究
人員)、碩博士班研究生與大學部專題生(共三名)
成果報告類型(依經費核定清單規定繳交):
*
精簡報告 □完整報告
本成果報告包括以下應繳交之附件:
□赴國外出差或研習心得報告一份
□赴大陸地區出差或研習心得報告一份
*
出席國際學術會議心得報告及發表之論文各一份
□國際合作研究計畫國外研究報告書一份
處理方式:除產學合作研究計畫、提升產業技術及人才培育研究計畫、
列管計畫及下列情形者外,得立即公開查詢
□涉及專利或其他智慧財產權,□一年□二年後可公開查詢
執行單位:國立臺灣大學材料科學與工程學系暨研究所
Abstract
Ceramic-polymer composites are manufactured and studied for their applications
in acoustic impedance matching. Various ceramic-epoxy composites are developed
and their impedance properties studied. Among them, the zirconium oxide-epoxy
composite exhibits a tolerable attenuation level and an optimum impedance value for
matching the piezoelectric ceramic-water interface. It is then integrated on to a
home-made medical high intensity focused ultrasound (HIFU) transducer to test its
effectiveness. The beam profile of the HIFU transducer is characterized by a
hydrophone, and an in-vivo experiment is carried out to gauge its performance.
Keywords: Acoustic matching layer; Ceramic-polymer composites; HIFU; In-vivo
experiment
1. Introduction
Acoustic impedance describes the behaviours of acoustic waves traveling in
substances, and is given by Z = ρ × c, where ρ is density and c is acoustic wave
velocity [1]. It plays an important role when one acoustic wave travels across the
interface between two substances, the larger the impedance mismatch, the more the
energy loss. Matching layer is a coating layer to abase the huge difference mismatch
between two materials – piezoelectric PZT ceramic and water for example, where
Z
PZT= 35 MRayl and Z
water= 1.5 MRayl. However, the thickness of matching layers
and their impedance values also affects the efficiency of power transmission. It can
be shown that for a monochromatic plane wave, the maximum transmission between
the PZT ceramic and water with impedances of Z
PZTand Z
wateroccurs for a matching
layer of λ
m/4 thickness and of acoustic impedance Z
m, where:
water PZT
m
Z
Z
Z
=
(1)
and λ
mis the wavelength in the matching layer material (see Fig.1) [2].
Water, Zwaterλm/4
PZT, ZPZT
Matching layer, Zm
Fig. 1. Acoustic matching layer for
PZT ceramic-water interface.
For acoustic matching applications, acoustic impedances of ceramic materials are
too high for transmitting ultrasonic waves into water/human tissues. To reduce the
impedance, both the density and wave velocity within the ceramic need to be lower.
Ceramic-polymer composites are potential matching layer materials capable of
integrating into commercial transducers due to their modifiable impedances achieved
by adjusting the volume percentages of components [3,4]. Due to the development
of ultrasonic transducers of higher resonant frequencies for medical imaging
applications, the required matching layer thickness becomes thinner, ranging from
hundred nanometers to few micrometers. Therefore, for the homogeneity of the
matching layer, the average ceramic particle size in ceramic-polymer composites is
typically limited to nanometer size. Generally the impedances of ceramic-loaded
epoxies range from 2.8 to 11.3 MRayl, depending on the material type and mixing
ratio. Some existing studies have mentioned that the aging process of cured
ceramic- epoxy composites can increase their impedances [5]. In the present study,
various ceramic-epoxy composites are manufactured and studied for their applications
in acoustic impedance matching.
2. Experimental
procedure
In order to produce highly dense ceramic-epoxy composites, a new method
involving the control of viscosity and bubble formation is adopted. The raw polymer
and ceramic materials were two-part epoxy (Cheng-E Co., Taiwan), aluminum oxide
powder (Al
2O
3, Taimax Materials Co., Taiwan), zirconium oxide powder (ZrO
2,
Yageo Co., Japan), and barium titanate powder (BaTiO
3, Yageo Co., Japan). The
mean particle sizes were 223.5 nm, 1.619 µm, and 1.669 µm for ZrO
2, Al
2O
3, and
BaTiO
3, respectively. The powder size was characterized using a zetapotential meter
(Zetasizer, Malvern Co., Taiwan).
The epoxy resin was pre-heated to 120°C and held for 10 minutes to lower its
viscosity and release the residual bubbles. 20, 30, and 30 grams of Al
2O
3, ZrO
2, and
BaTiO
3powders were mixed separately with the pre-heated resin, respectively, to
form colloidal solutions of volume 10 ml. The colloidal solutions were thoroughly
stirred at 120°C and then placed in vacuum for 5 min for multiple times to ensure that
the bubbles trapped between the ceramic particles escaped the colloidal solutions
completely. The degree of compaction of the ceramic particles in the solutions
gradually increased during the stir-then-vacuum procedure, and the resin eventually
became excessive. The excess epoxy resin was removed, and the epoxy hardener
was added into the solutions. Finally, the solutions were poured into wax molds and
cured at room temperature for 24 hr. The resultant bulk composites were then aged
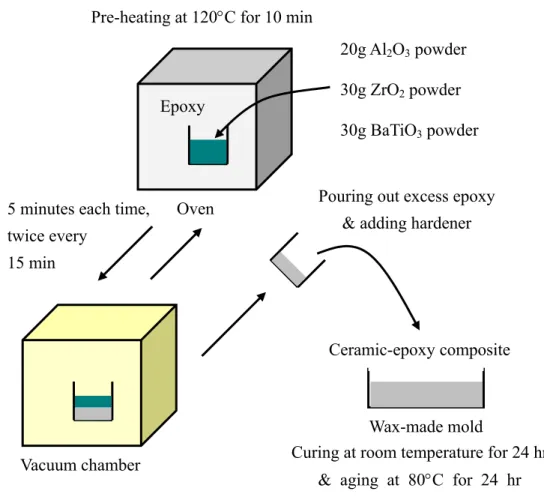
at 80°C for 5 hr. The entire processing flow is schematically shown in Fig. 2.
Pre-heating at 120°C for 10 min
Curing at room temperature for 24 hr
& aging at 80°C for 24 hr
Epoxy
20g Al
2O
3powder
30g ZrO
2powder
30g BaTiO
3powder
Oven
Vacu
ber
5 minutes each time,
twice every
15 min
Wax-made mold
Ceramic-epoxy composite
Pouring out excess epoxy
& adding hardener
um cham
Fig. 2. Processing steps of acoustic matching composites.
To determine the acoustic impedance of a material, the wave traveling velocity in
the material is a necessary parameter. Therefore, each of the prepared bulk ceramic-
epoxy composite was cut and ground into a disc sample and adhered on to an
ultrasonic probe (GE Panametrics Co., USA) using ultrasonic gel for wave velocity
measurements. The ultrasonic probe was used to transmit and receive ultrasound
waves under a pulser-receiver setup. The reflected wave signals were collected
using an oscilloscope (Lecroy Co., USA). Recording the time interval between the
reflected waves and knowing the sample thickness led to the value of wave velocity
within the prepared composite matching layer.
In order to prevent frequency coupling between the transmitting and receiving
waves within the ultrasonic probe, an external hydrophone (ONDA Co., Taiwan) was
utilized to receive the acoustic waves emitting from the composite matching layer.
The hydrophone measurement was set up under water to minimize attenuation and
maximize the hydrophone efficiency. Each matching composite sample was set up
identically on the ultrasonic probe as mentioned above. After traveling through the
composite sample, the emitting ultrasonic waves were collected by the hydrophone
and then transformed into electrical signals to the oscilloscope. The measured wave
forms were converted into frequency spectrums using Fast Fourier Transform (FFT).
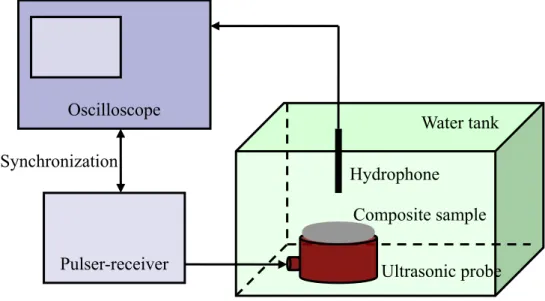
The measurement system for frequency distribution is shown in Fig. 3.
Hydrophone
Ultrasonic probe
Composite sample
Water tank
Pulser-receiver
Oscilloscope
Synchronization
Fig. 3. Measurement system for frequency distribution of an ultrasonic transducer
with a composite matching layer.
3. Measurements and discussion
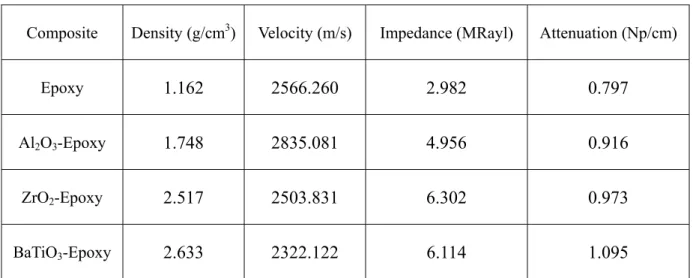
The measured values of density, internal wave velocity, impedance, and
attenuation of the three developed ceramic-epoxy composites are listed in Table 1.
The internal wave velocity is calculated from the reflection time of 1 MHz wave
traveling through a distance of double the thickness. A 180° phase shift at the
composite-probe interface is discovered (i.e. a wave crest becomes a wave trough).
It is found that the attenuation level of the epoxy increases when it is loaded with
ceramic particles. This is due to the dissipation of acoustic energy at the ceramic-
epoxy interfaces. Based on Eq. (1), a matching layer material with an impedance
value close to 7 MRayl and of course low attenuation is desirable for transmitting
ultrasonic waves from a ceramic piezoelectric transducer into water/human tissues.
From Table 1, it is evident that ZrO
2-epoxy composite is the most suitable acoustic
matching material due to its appropriate impedance value and reasonable attenuation.
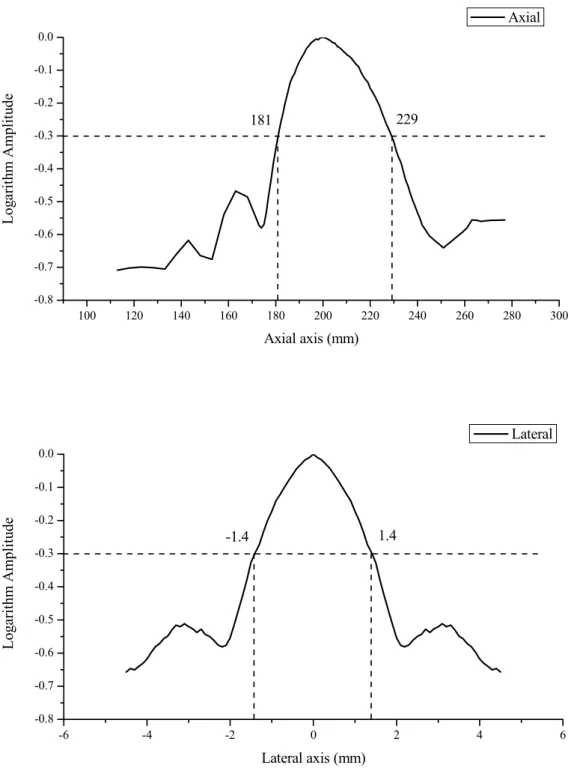
In order to examine the acoustic matching efficiency of ZrO
2-epoxy composite, a
quarter-wavelength ZrO
2-epoxy composite matching layer was integrated on to a
home-made bowl-shape high intensity focused ultrasound (HIFU) transducer. The
home-made HIFU transducer shown in Fig. 4 was manufactured to operate at 1.5
MHz. The bowl-shape piezoelectric (PZT) element of the transducer had a diameter
of 10 cm and a curvature radius of 20 cm and was purchased from FUJI Ceramics Co.,
Japan. The electrical matching circuit of the transducer was built by Broadsound
Co., Taiwan. The ultrasonic beam profiles of the transducer, such as the axial and
lateral pressure distributions, were measured by a hydrophone moving incrementally
along the axes by a step motor (see Fig. 5).
Composite Density (g/cm3) Velocity (m/s) Impedance (MRayl) Attenuation (Np/cm)
Epoxy
1.162 2566.260
2.982
0.797
Al2O3-Epoxy
1.748 2835.081
4.956
0.916
ZrO2-Epoxy
2.517 2503.831
6.302
0.973
BaTiO3-Epoxy
2.633 2322.122
6.114
1.095
Table 1. Acoustic properties of developed composite materials.
100 120 140 160 180 200 220 240 260 280 300 -0.8 -0.7 -0.6 -0.5 -0.4 -0.3 -0.2 -0.1 0.0 Lo ga rith m A m pl itu de Axial axis (mm) Axial 181 229 -6 -4 -2 0 2 4 6 -0.8 -0.7 -0.6 -0.5 -0.4 -0.3 -0.2 -0.1 0.0 L oga ri th m Am pl it ude Lateral axis (mm) Lateral -1.4 1.4
Fig. 5. Axial and lateral beam profiles of the home-made HIFU transducer.
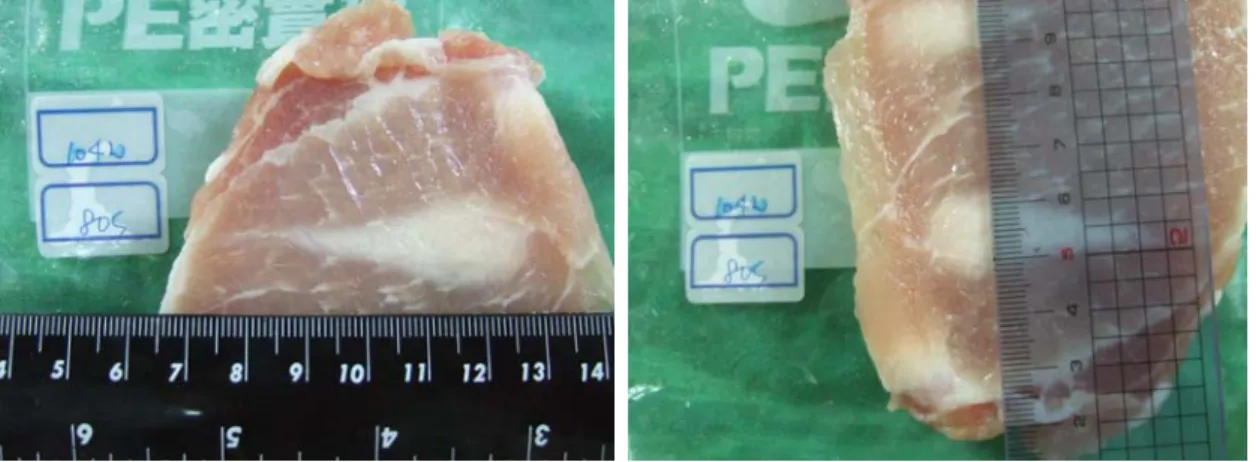
An in-vivo experiment was carried out on a pork bulk to test the performance of
the home-made HIFU. The experimental setup is shown in Fig 6. The pork bulk
was pre-heated to 37°C to model the temperature of human tissues. The HIFU
transducer is capable of driving at 105 watts with less than 2% power reflection.
The low level of power reflection demonstrates the high efficiencies of the acoustic
and electrical matchings. After heating for 80 sec, the pork bulk was sliced into
several pieces to measure the lesion size (shown in Fig. 7). The length and width of
the lesion at the focal point were about 4.7 cm and 1.6 cm, respectively.
Fig. 6. Setup for in-vivo experiment.
Fig. 7. Lesion inside the pork bulk after in-vivo experiment.
4. Conclusion
In summary, three different ceramic-epoxy composites are developed and
compared in terms of acoustic matching characteristics. Among them, ZrO
2-epoxy
composite is the most suitable material for matching layer applications due to its
optimum acoustic impedance value for bridging the impedance mismatch between the
ceramic piezoelectric element and water/human tissues. A bowl-shape home-made
HIFU transducer with a single ZrO
2-epoxy composite matching layer is manufactured
to study the efficiency of the composite matching layer. The HIFU transducer could
be driven at 105 watts with less than 2% power reflection. The performance of the
HIFU transducer is demonstrated by an in-vivo experiment.
References
[1] E. Tomas and G. Alvarez-Arenas, IEEE Transactions on Ultrasonics,
Ferroelectrics, and Frequency Control 51, 624 (2004).
[2] L.E. Kinsler, A.R. Frey, A.B. Coppens, and J.V. Sanders, Fundamentals of
Acoustics, 3rd Ed. (John Wiley, New York, 1982).
[3] E. Yogeswaren, Matching Layer Assembly for a Downhole Acoustic Sensor, US
Patent, No. 7075215.
[4] K. Hashimoto, T Hashida, M. Suzuki, M. Hashimoto, H. Nagahara, S. Shiraishi,
and N. Takahara, Acoustic Matching Layer and Ultrasonic Transducer, US Patent,
No. 6969943.
[5] H. Wang, W. Cao, Q. F. Zhou, K. K. Shung, and Y. H. Hung, Applied Physics
Letters 85, 5998 (2004).
計畫成果自評
With limited availabilities of time and funding, the acoustic matching
characteristics of various ceramic-epoxy composites have been studied extensively.
These composite materials have the potential to replace traditional polymer-based
impedance matchings on commercial piezoelectric ultrasound transducers. A
manuscript is currently under preparation for submission to international journals.
Additionally, applications of ROC and US patents based on the findings of the present
study are currently being processed. The contents of the patents are not discussed in
the current report.
論文與專利之發表
1. J. Shieh, C.T. Ko, W.S. Chen, and C.S. Chen, Acoustic filtering behaviours of
active PZT matching layers, manuscript in preparation.
2. J. Shieh, C.T. Ko, W.S. Chen, and C.S. Chen, Acoustic filtering by an active
piezoelectric matching layer, ROC and US patents under application. (註:專利
內容未在此報告內討論)
可供推廣之研發成果資料表
附件一
* 可申請專利 □ 可技術移轉
日期:96年10月23日國科會補助計畫
計畫名稱: 壓電傳感元件之波傳耦合層設計與元件整體之力電作
用表現研究
計畫主持人: 謝宗霖
計畫編號: NSC 95-2221-E-002-116
學門領域: 金屬及陶瓷材料工程 (E8)
技術/創作名稱
一種可主動篩頻之波傳耦合層材料系統 (provisional)
發明人/創作人
謝宗霖 et al.
技術說明
Acoustic filtering by an active piezoelectric matching layer.
(研發成果申請專利中,無法揭露專利內容)
可利用之產業
及
可開發之產品
電子陶瓷相關產業
超音波探頭相關產業
鐵電壓電元件
技術特點
主動篩頻
推廣及運用的價值
被動波傳耦合層之替代品
※ 1.每項研發成果請填寫一式二份,一份隨成果報告送繳本會,一份送 貴單位
研發成果推廣單位(如技術移轉中心)
。
出席國際學術會議心得報告
計畫編號 NSC
95-2221-E-002-116-
計畫名稱
壓電傳感元件之波傳耦合層設計與元件整體之力電作用表現研究
出國人員姓名
服務機關及職稱
謝宗霖助理教授, 國立臺灣大學材料科學與工程學系暨研究所
會議時間地點 San Diego, USA, 18-22 March 2007
會議名稱
SPIE’s 14th International Symposium on Smart Structures and Materials and
Nondestructive Evaluation and Health Monitoring
發表論文題目
Switching characteristics of (Bi
1/2Na
1/2)TiO
3–BaTiO
3–(Bi
1/2K
1/2)TiO
3lead-free
ferroelectric ceramics
一、參加會議經過及與會心得
The meeting at San Diego was a success. SPIE’s annual meeting on smart materials and structures
is one of the largest conferences in the world. International scholars and researchers in the field of
ferroelectrics were very interested in the polarization and strain hysteresis measurements of the
BNBK ceramics. There were lots of discussions on the processing, characterization, and possible
applications of the lead-free BNBK ceramics. The depolarization temperature of BNBK was also
a topic of high interest since this critical temperature point would decide how feasible the BNBK is
used to replace lead-base ferroelectrics like the PZT family of ceramics. Overall, this was a highly
productive and worthwhile conference trip. The conference proceeding (Proc. of SPIE Vol. 6526
65260M) is attached below.
Switching characteristics of (Bi
1/2Na
1/2)TiO
3–BaTiO
3–(Bi
1/2K
1/2)TiO
3lead-free ferroelectric ceramics
J. Shieh
a∗, K.C. Wu
a, C.S. Chen
b aDepartment of Materials Science and Engineering
bDepartment of Civil Engineering
National Taiwan University, 1 Roosevelt Road, Sec. 4, Taipei 106, Taiwan
ABSTRACT
The polarization switching characteristics of lead-free a(Bi1/2Na1/2)TiO3–bBaTiO3–c(Bi1/2K1/2)TiO3 (abbreviated as
BNBK 100a/100b/100c) ferroelectric ceramics are investigated. This is achieved through examining their polarization and strain hystereses inside and outside the morphotropic phase boundary (MPB). The total induced electrostrain (ε33,total) and apparent piezoelectric charge coefficient (d33) first increase dramatically and then decrease gradually as the BNBK
composition moves from the tetragonal phase to the MPB and then to the rhombohedral phase. The measured polarization hystereses indicate that the BNBK compositions situated near the rhombohedral side of the MPB typically possess higher coercive field (Ec) and remanent polarization (Pr), while the compositions situated near the tetragonal side
of the MPB possess higher apparent permittivity. Adverse effects on the ferroelectric properties are observed when BNBK is doped with donor dopants such as La and Nb. On the contrary, intricate hysteresis behaviors are observed when acceptor dopant Mn is introduced into BNBK. Under an alternating electric field of ±5.0 MVm-1, BNBK 85.4/2.6/12, a
composition well within the MPB, exhibits an ε33,total of ~0.14%, an apparent d33 of 295 pCN-1, an Ec of 2.5 MVm-1 and a
Pr of 22.5 µCcm-2. These notable ferroelectric property values suggest a candidate material for lead-free actuator
applications. The present study provides a systematic set of hysteresis measurements which can be used to characterize the switching behaviors of BNBK-based lead-free ferroelectrics.
Keywords: BNBK, lead-free, ferroelectrics, ferroelectricity, hysteresis, polarization switching
∗[email protected]; phone: +886-2-33665287; fax: +886-2-23634562
Behavior and Mechanics of Multifunctional and Composite Materials 2007, edited by Marcelo J. Dapino Proc. of SPIE Vol. 6526, 65260M, (2007) · 0277-786X/07/$18 · doi: 10.1117/12.715121
1. INTRODUCTION
There has been a determined effort to develop lead-free ferroelectric ceramics with high piezoelectric properties by various doping and alloying routes, but no effective alternative to the lead zirconate titanate (PZT) system has yet been found.1 Nevertheless, several lead-free ceramic systems have shown great potential. Saito et al.2 have developed a highly <001> textured alkaline niobate-based perovskite ceramic with a piezoelectric charge coefficient d33 of 416 pCN-1, which
is widely regarded as the closest lead-free system to the actuator-grade hard and semi-hard PZT ceramics to date. A considerable literature also exists concerning the dielectric and piezoelectric properties of (1-x)(Bi0.5Na0.5)TiO3-xBaTiO3
(abbreviated as BNBT-100x) and (1-y)(Bi0.5Na0.5)TiO3-y(Bi0.5K0.5)TiO3 (abbreviated as BNKT-100y) solid solutions.3-9
These two bismuth sodium titanate (BNT)-based ceramic solid solutions have rhombohedral-tetragonal morphotropic phase boundary (MPB) compositions existed on x = 0.06-0.07 for BNBT-100x and y = 0.16-0.20 for BNKT-100y.8-10 From these two solutions, a ternary system, a(Bi0.5Na0.5)TiO3-bBaTiO3-c(Bi0.5K0.5)TiO3 (abbreviated as BNBK
100a/100b/100c), can be developed.10 A piezoelectric charge coefficient of d33 = 191 pCN-1, an electromechanical
coupling factor of k33 = 0.56 and a dielectric constant of KT33 = 1141 have been observed for the BNBK 85.2/2.8/12
composition which has a tetragonal phase near the MPB.10 In comparison with BNBT and BNKT, compositions of the BNBK ternary system typically exhibit higher depolarization and/or Curie temperatures.5,10,11 So far the dielectric and piezoelectric properties of the BNBK system have received some limited attention.10-12 However, there are no systematic data available on its polarization and strain hystereses. This insufficiency shall be addressed in the present study.
In broad terms, ferroelectric sensors operate within the linear regime with subsequent signal amplification: linearity is more important than signal power. In other applications such as ferroelectric actuators, nonlinear behavior is a consequence of operating at high power. Hence, it is critical to measure the polarization switching characteristics of a newly developed ferroelectric system in order to gauge its ability to be used as linear and/or nonlinear devices.13 The aim of this study is to investigate the switching characteristics of BNBK-based lead-free ferroelectric ceramics, focusing on the MPB compositions. This is achieved through examining their hystereses in the electric polarization (D) vs. electric field (E) and strain (ε) vs. electric field (E) responses.
2. EXPERIMENTAL PROCEDURE
Conventional mixed oxide techniques were used to prepare the BNBK ceramics. Reagent-grade metal oxide and carbonate powders were used as starting raw materials. These oxide and carbonate powders were mixed in ethanol and ball-milled for 24 h. After calcining (800 °C, 1 h), the powder mix was again ball-milled for 24 h with the addition of PVA binder. After the second ball-milling procedure, the ground ceramic powders were oven-dried (120 °C, 24 h) and then pressed into sample discs. After debinding (600 °C, 1 h), these sample discs were sintered at 1170 °C for 2 h in air. Crystalline phases of the sintered BNBK ceramic samples were confirmed using an X-ray diffractometer (Rigaku
BKT
(B105K05)Ti03NN
60 mol% BNKT + 40 mol% BNBT BNKT 16BT
(B aT 103) (B a0 5)1aTiO3
BNT
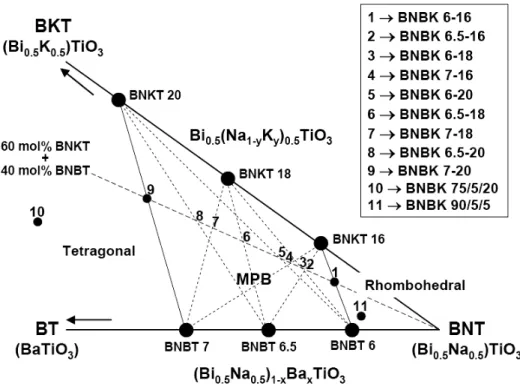
BNBT 6 (B105Na05)Ti03 I —* BNBK 6-16 2—> BNBK 6.5-16 3—> BNBK 6-18 4—> BNBK 7-16 5 —* BNBK 6-20 6—> BNBK 6.5-18 Bi05(Na1K)05TiO3 7—> BNBK 7-18 8—> BNBK 6.5-20 BNKT 18 9 —* BNBK 7-20 10 —* BNBK 7515120 11 —* BNBK 901515 Rhombohedral Tetragonal BNBT7 BNBT6.5D/max-B). In total, 11 types of BNBK composition samples were prepared and Fig. 1 shows their relative positions on the room temperature phase diagram of the (Bi0.5Na0.5)TiO3-BaTiO3-(Bi0.5K0.5)TiO3 ternary system. Samples 1-9 situate
within the MPB of BNBK and consist of 40 mol% BNBT and 60 mol% BNKT. The exact constitutions of the BNBT and BNKT components of a BNBK sample are expressed by the number affixed; for example, Sample 8, which is BNBK 6.5-20, is of composition 40 mol% (Bi0.5Na0.5)0.935Ba0.065TiO3 + 60 mol% Bi0.5(Na0.8K0.2)0.5TiO3. Note that Sample 8,
BNBK 6.5-20, can also be denoted as BNBK 85.4/2.6/12 by working out the exact percentages of the three constituents, (Bi0.5Na0.5)TiO3, BaTiO3 and (Bi0.5K0.5)TiO3. Sample 10 (i.e., BNBK 75/5/20) and Sample 11 (i.e., BNBK 90/5/5) are
two compositions outside the MPB and situate at the tetragonal and rhombohedral regions, respectively. They do not lie on the 40 mol%-BNBT-60 mol%-BNKT composition line. Several MPB compositions of the BNBT and BNKT systems were also prepared via the same processing route in this study for comparison purposes. For polarization and strain hysteresis measurements, sample discs were cut into cuboidal specimens measuring 10 × 10 × 3 mm and silver-based paints were applied onto the 10 × 10 mm faces to form top and bottom electrodes for electric field excitation. Electric field loading was applied using a high-voltage amplifier (Trek 20/20C), driven by a ferroelectric analyzer (aixACCT TF2000). The polarization and strain of the specimen during electrical loading were measured by the ferroelectric analyzer and miniature strain gauges (TML FBX-04-11-005LE) attached onto the 10 × 3 mm faces of the specimen, respectively. All hysteresis measurements were carried out at room temperature (~ 25 °C) with the specimen contained within a silicon oil bath to prevent electrical breakdown.
Fig. 1. Schematic of BNBK phase relationship around the MPB. Locations of 11 different BNBK composition samples prepared for the present study are shown.
3. MEASUREMENTS AND DISCUSSION
3.1 Polarization hysteresis
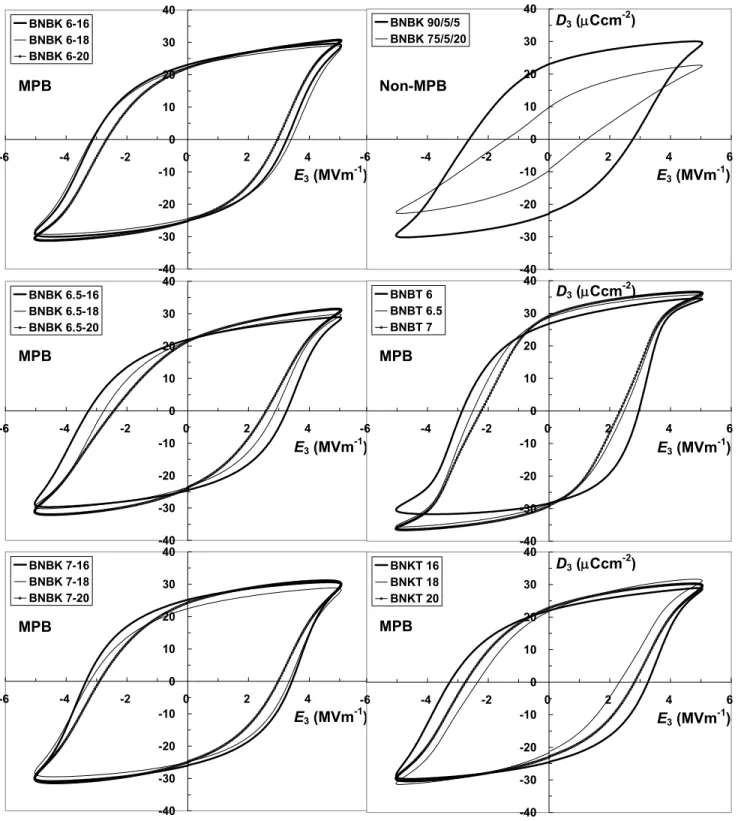
The stable polarization D-E hysteresis curves for the BNBK, BNBT and BNKT specimens, measured at a cyclic electric field of amplitude ±5.0 MVm-1, a frequency of 0.2 Hz and sinusoidal waveform, are shown in Fig. 2. The coercive fields
(Ec) and remanent polarizations (Pr) of the specimens obtained from the measured D-E curves are listed in Table 1. It is
evident from Fig. 2 that BNBT is the “softest” among the three ferroelectric systems, with its specimens showing the highest average Pr and lowest average Ec. In contrast, the BNKT specimens exhibit the lowest average Pr and a less sharp
polarization transition at Ec (i.e., switching is completed over a wider range of electric field) – both are indications of a
“hard” ferroelectric system. The switching behavior of BNBK in terms of hardness/softness falls in between the BNBT and BNKT systems and is strongly dependent on its composition. In all three systems, the specimens with compositions situated at or near the rhombohedral side of the MPB (e.g., BNBT-6, BNKT-16, BNBK 6-16, BNBK 6.5-16, BNBK 6-18 and BNBK 7-16) exhibit larger polarization hystereses, which typically give rise to higher Ec and Pr values, while the
compositions situated at or near the tetragonal side of the MPB (e.g., BNBT-7, BNKT-20, BNBK 7-20 and BNBK 6.5-20) possess higher apparent permittivity, which could be calculated from the slope gradient of the D-E hysteresis curve at zero electric field. Among the nine MPB compositions of BNBK prepared for this study, BNBK 6.5-20 had the lowest Ec
(=2.5 MVm-1) and BNBK 7-20 had a relatively high P
r (=24.5 µCcm-2) with an Ec just below 3.0 MVm-1.
3.2 Strain hysteresis
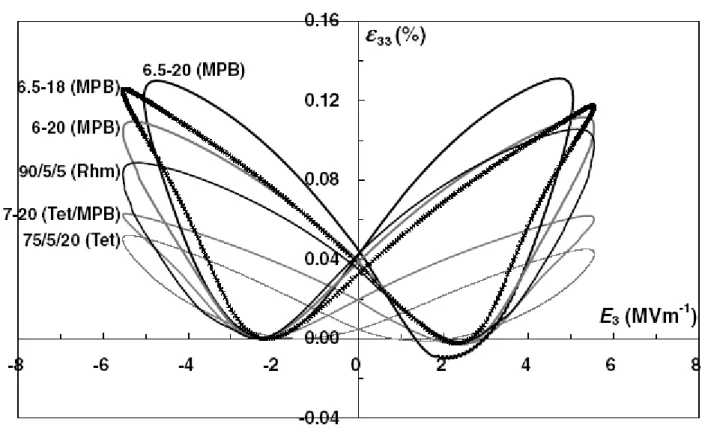
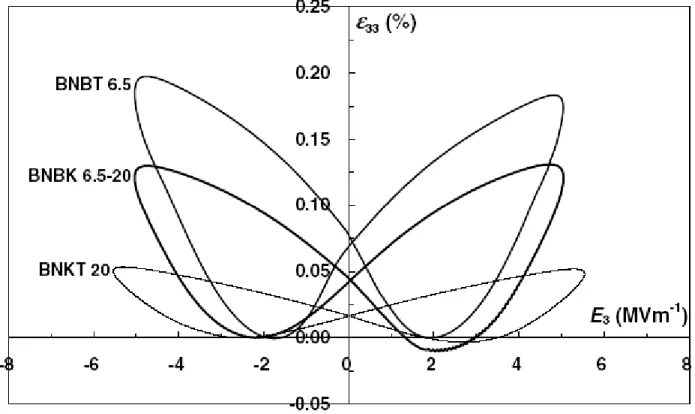
The stable strain ε-E hysteresis curves (i.e., butterfly curves) for the BNBK compositions inside and outside the MPB, measured at a cyclic electric field of amplitude ±5.0-5.5 MVm-1, a frequency of 0.2 Hz and sinusoidal waveform, are
shown in Fig. 3. In order to achieve a satisfactory level of polarization saturation with 5.0-5.5 MVm-1, only the BNBK compositions with Ec < 3.0 MVm-1 were chosen for the strain hysteresis analysis. Note that ±15 kV is needed to achieve
±5.0 MVm-1 on the 3 mm thick specimen. Strain measurements with excitation voltage > 15 kV were not carried out in
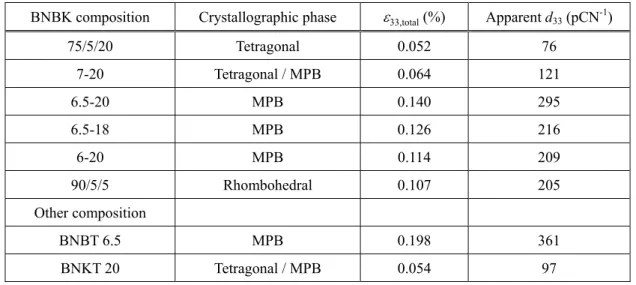
order to protect the strain amplifier and gauges from high-voltage arc striking. It is evident from Fig. 3 that the tetragonal BNBK produces relatively the smallest strain under cyclic electrical loading. The remanent strain (εr) and total electrostrain in the 33-direction (ε33,total) increase significantly when the BNBK composition moves from the tetragonal phase into the MPB, peaking at BNBK 6.5-20. While εr remains relatively unchanged, ε33,total decreases progressively as the composition shifts away from the MPB BNBK 6.5-20 into the rhombohedral phase, which is achieved by increasing the BNT amount in the BNBK system. Fig. 3 shows that MPB compositions BNBK 6.5-18 and BNBK 6-20, which contain more BNT than BNBK 6.5-20, exhibit smaller electrostrains. A similar trend to ε33,total is also observed for the apparent d33, obtained from the slope gradient of the butterfly curve at zero electric field. With a composition well within
the MPB, BNBK 6.5-20 exhibits an ε33,total of ~0.14%, more than double than that of BNBK 7-20 which situates at the
tetragonal boundary of the MPB. The apparent d33 of BNBK 6.5-20 is 295 pCN-1, an impressive number for a lead-free
ferroelectric ceramic. The values of ε33,total and apparent d33 for the chosen compositions are listed in Table 2.
Fig. 2. Measured polarization D-E hysteresis curves for BNBK, BNBT and BNKT (fapp = 0.2 Hz). D3 (µCcm-2) D3 (µCcm-2) D3 (µCcm-2) -40 -30 -20 -10 0 10 20 30 40 -6 -4 -2 0 2 4 6 BNBK 6-16 BNBK 6-18 BNBK 6-20 E3 (MVm-1) -40 -30 -20 -10 0 10 20 30 40 -6 -4 -2 0 2 4 6 BNBK 6.5-16 BNBK 6.5-18 BNBK 6.5-20 E3 (MVm-1) -40 -30 -20 -10 0 10 20 30 40 -6 -4 -2 0 2 4 6 BNBK 7-16 BNBK 7-18 BNBK 7-20 E3 (MVm-1) -40 -30 -20 -10 0 10 20 30 40 -6 -4 -2 0 2 4 6 BNBK 90/5/5 BNBK 75/5/20 E3 (MVm-1) D3 (µCcm-2) -40 -30 -20 -10 0 10 20 30 40 -6 -4 -2 0 2 4 6 BNKT 16 BNKT 18 BNKT 20 E3 (MVm-1) D3 (µCcm-2) -40 -30 -20 -10 0 10 20 30 40 -6 -4 -2 0 2 4 6 BNBT 6 BNBT 6.5 BNBT 7 D3 (µCcm-2) E3 (MVm-1) MPB MPB MPB MPB MPB Non-MPB
6.5-20 (MPB)
E3 (MVm1)
Table 1. Coercive fields (Ec) and remanent polarizations (Pr) of BNBK, BNBT and BNKT compositions.BNBK composition Pr (µCcm-2) Ec (MVm-1) Composition Pr (µCcm-2) Ec (MVm-1) 6-16 24.0 3.2 BNBK 90/5/5 22.8 2.7 6-18 23.3 3.3 BNBK 75/5/20 9.5 1.3 6-20 23.4 2.8 6.5-16 23.3 3.3 BNBT 6 27.4 2.9 6.5-18 22.5 2.8 BNBT 6.5 28.5 2.5 6.5-20 22.5 2.5 BNBT 7 29.1 2.3 7-16 25.5 3.4 BNKT 16 23.3 3.3 7-18 23.6 3.3 BNKT 18 21.6 2.3 7-20 24.5 3.0 BNKT 20 22.8 2.8
Fig. 3. Measured strain ε-E hysteresis curves for BNBK compositions inside and outside the MPB (fapp = 0.2 Hz).
BNBT 6.5
BNBK 6.5-20
BNKT 20!
E, (MVm1
The stable polarization and strain hysteresis curves for BNBK 90/5/5 and BNBK 75/5/20 are shown in Figs. 2 and 3, respectively. Apart from the actuating properties such as ε33,total and d33, the heavily BNT-based rhombohedral BNBK
90/5/5 also displays a much higher remanent polarization than the tetragonal BNBK 75/5/20. This is most likely due to the higher number of equivalent crystallographic directions which the spontaneous polarization could take up in a rhombohedral structure (i.e., eight [111] directions). Nevertheless, the magnitude of strain produced by BNBK 90/5/5 is still no match for those produced by the compositions well within the MPB. Fig. 4 compares the strain hystereses of BNBK 6.5-20 and its two constituent components, BNBT-6.5 and BNKT-20. A substantial 0.20% total electrostrain is observed for BNBT-6.5, a composition positioned right in the middle of the MPB of the BNBT system. When BNKT-20 is introduced into BNBT-6.5 (i.e., forming BNBK 6.5-20), decreases in the electrostrain and apparent d33 are obvious.
This decline of actuating ability, though, is likely to be rewarded by increases in the depolarization and Curie temperatures (20-80 °C increase), as indicated by existing studies.5,10,11 The pure BNKT composition, BNKT-20, exhibits
a small ε33,total of ~0.05%, much less than those of BNBT-6.5 and BNBK 6.5-20. The values of ε33,total and apparent d33 for
BNBT-6.5 and BNKT-20 are also listed in Table 2. It is clear from Fig. 4 that the strain hysteresis of a BNBK composition combines the straining characteristics of its two constituent components, BNBT and BNKT.
Fig. 4. Measured strain ε-E hysteresis curves for BNBT-6.5, BNKT-20 and BNBK 6.5-20 (fapp = 0.2 Hz).
Table 2. ε33,total and apparent d33 of selected BNBK, BNBT and BNKT compositions.
BNBK composition Crystallographic phase ε33,total (%) Apparent d33 (pCN-1)
75/5/20 Tetragonal 0.052 76 7-20 Tetragonal / MPB 0.064 121 6.5-20 MPB 0.140 295 6.5-18 MPB 0.126 216 6-20 MPB 0.114 209 90/5/5 Rhombohedral 0.107 205 Other composition BNBT 6.5 MPB 0.198 361 BNKT 20 Tetragonal / MPB 0.054 97 3.3 Doping effects
The stable polarization and strain hysteresis curves for BNBK 6.5-20 doped with 1.0 mol% La3+ and/or 1.0 mol% Nb5+
are shown in Fig. 5. Donor dopants for the PZT system such as La and Nb typically lower the coercivity and increase the polarization and actuation strain of PZT.14 However, it is evident from Fig. 5 that La and/or Nb dopings have adverse
effects on the ferroelectric properties of the BNBK system. The magnitudes of induced polarization and strain decrease dramatically when La and/or Nb dopants are introduced into BNBK 6.5-20. This is likely due to the disappearance of large stable ferroelectric domains within the BNBK relaxor. In contrast, intricate hysteresis behaviors are observed when Mn, an acceptor dopant for the PZT system, is added into BNBK. The stable polarization and strain hysteresis curves for BNBK 6.5-20 doped with 0.1-2.9 mol% Mn2+ are shown in Fig. 6. It is evident that the apparent permittivity of BNBK
6.5-20 decreases with Mn doping and higher Ec and Pr values are measured when the Mn doping amount is higher than
1.0 mol%. ε33,total of BNBK 6.5-20 decreases significantly when 0.1 mol% Mn2+ is added, but later recovers as the doping
amount increases to 1.0 mol%. An asymmetric butterfly curve is observed when 2.9 mol% Mn2+ is added, which
suggests a high degree of incomplete switching of polarization under an alternating electric field of ±5.0 MVm-1. This
asymmetry is not observed in pure BNBK 6.5-20 and BNBK 6.5-20 doped with 0.1-1.0 mol% Mn2+ under an identical
loading condition. Further detailed studies are required to explain the intricate hysteresis behaviors of Mn-doped BNBK.
6.5-20 + 1.0 p101% Pure 6.5-20 6.5-20 + moI% Nb5 6 E3 (MVrii1)
Fig. 5. Measured polarization and strain hysteresis curves for BNBK 6.5-20 doped with 1.0 mol% La3+ and/or 1.0 mol% Nb5+.
E3 MVm)
6.5-20 +
moI% Mn'
Fig. 6. Measured polarization and strain hysteresis curves for BNBK 6.5-20 doped with 0.1-2.9 mol% Mn2+.
4. CONCLUSION
In summary, the switching characteristics of the MPB compositions of the (Bi0.5Na0.5)TiO3-BaTiO3-(Bi0.5K0.5)TiO3
lead-free system have been investigated. This was achieved through examining their polarization and strain hystereses. The BNBK compositions situated near the rhombohedral side of the MPB typically possess higher Ec and Pr, while the
compositions situated near the tetragonal side of the MPB possess higher apparent permittivity. The total induced electrostrain and apparent d33 increase dramatically when the BNBK composition moves from the tetragonal phase into
the MPB. They then decrease gradually as the composition shifts away from the MPB into the rhombohedral phase. Under an alternating electric field of ±5.0 MVm-1, BNBK 6.5-20 (a.k.a. BNBK 85.4/2.6/12) exhibits an ε
33,total of ~0.14%,
an apparent d33 of 295 pCN-1, an Ec of 2.5 MVm-1 and a Pr of 22.5 µCcm-2. These notable ferroelectric property values
indicate that the BNBK 6.5-20 ceramic is a candidate material for lead-free actuator applications.
ACKNOWLEDGEMENT
The authors are grateful for the financial support of the National Science Council (NSC) of Taiwan under contract numbers NSC94-2218-E-002-062 and NSC94-2216-E-002-019.
REFERENCES
1. Takenaka T, Nagata H. J Eur Ceram Soc 2005;25:2693.
2. Saito Y, Takao H, Tani T, Nonoyama T, Takatori K, Homma T, Nagaya T, Nakamura M. Nature 2004;432:84. 3. Kundu A, Soukhojak AN. Appl Phys A 2006;82:309.
4. Qu Y, Shan D, Song J. Mater Sci Eng B 2005;121:148.
5. Wang XX, Or SW, Tang XG, Chan HLW, Choy PK, Liu PCK. Solid State Commun 2005;134:659. 6. Wang XX, Kwok KW, Tang XG, Chan HLW, Choy CL. Solid State Commun 2004;129:319. 7. Ishii H, Nagata H, Takenaka T. Jpn J Appl Phys 2001;40:5660.
8. Sasaki A, Chiba T, Mamiya Y, Otsuki E. Jpn J Appl Phys 1999;38:5564. 9. Takenaka T, Maruyama K, Sakata K. Jpn J Appl Phys 1991;30:2236.
10. Nagata H, Yoshida M, Makiuchi Y, Takenaka T. Jpn J Appl Phys 2003;42:7401. 11. Wang XX, Choy SH, Tang XG, Chan HLW. J Appl Phys 2005;97:104101. 12. Wang XX, Tang XG, Chan HLW. Appl Phys Lett 2004;85:91.
13. Shieh J, Huber JE, Fleck NA. Acta Mater 2003;51:6123.
14. Moulson AJ, Herbert JM. Electroceramics: Materials, Properties and Applications. London: Chapman & Hall; 1990.