企業創新於併購上的價值分析 - 政大學術集成
56
0
0
全文
(2) Contents Abstract .......................................................................................................................... 2 List of Tables .................................................................................................................. 3 Chapter 1. Introduction .......................................................................................... 4 1.1. Motivation and Objective ....................................................................... 4 1.2. Procedure of the Study ............................................................................ 6 Chapter 2. Literature Review ................................................................................. 7 2.1. M&A Return Performance ...................................................................... 7 2.2. Outsourcing Innovation .......................................................................... 9 Chapter 3. Methodology and the Data ................................................................. 14 3.1. Construction of Data ............................................................................. 14 3.1.1. Sample Formation ........................................................................ 14 3.1.2. Innovation Variables .................................................................... 15 3.1.3. Controlling Variables ................................................................... 18 3.2. Methodology ......................................................................................... 22 3.2.1. Event Study .................................................................................. 22 3.2.2. Multiple Regression Analysis ...................................................... 25 3.2.3. Calendar Time Portfolio ............................................................... 26 Chapter 4. Empirical Result ................................................................................. 27 4.1. Descriptive Statistics ............................................................................. 27. 立. 政 治 大. ‧. ‧ 國. 學. n. al. er. io. sit. y. Nat. 4.2. Short-term Perspective .......................................................................... 30 4.3. Long-term Perspective .......................................................................... 34 4.4. Calendar Time Portfolio........................................................................ 46 Chapter 5. Conclusion .......................................................................................... 50 5.1. Summary of the Study .......................................................................... 50 5.2. Suggestions for Further Studies ............................................................ 52 References .................................................................................................................... 54. Ch. engchi. 1. i n U. v.
(3) Abstract Through overviewing the merger waves during the last century, we know the latest two waves result mainly from technological innovation. With the presence of M&A market, acquirers are able to gain innovation capacities by taking over innovative targets. Innovation is considered to be a source of synergies and a major motive for M&A decision. Therefore, my research focuses on whether acquisitions for. 政 治 大. innovation create value for investors in short-term and long-term perspective.. 立. ‧ 國. 學. By using various innovation measures, I employ event study and calendar time portfolio to examine the significance of abnormal returns. I find the abnormal returns. ‧. sit. y. Nat. of bidding innovative targets do not show significant difference from the peers in. n. al. er. io. short-term market reaction. However, in the long-run, the group with innovative. Ch. i n U. v. targets reports significant abnormal returns. Under multiple regression analysis, I find. engchi. patent counts, total citations, and citation-weighted patent counts have positive relation with abnormal returns under WLS procedure, while only average citation yields the most consistent result under both OLS and WLS. Lastly, I confirm the relation between abnormal return and average citation measure by employing calendar time portfolio approach.. 2.
(4) List of Tables TABLE 1 DESRIPTIVE STATISTICS OF THE WHOLE SAMPLE ........................................................................ 28 TABLE 2 DESCRIPTIVE STATISTICS, SORT BY INNOVATION MEASURES....................................................... 29 TABLE 3 ABNORMAL RETURNS FOR SHORT-TERM EVENT WINDOWS ......................................................... 32 TABLE 4 DIFFERENCES IN ABNORMAL RETURNS BY INNOVATION METRICS FOR SHORT-TERM EVENT WINDOWS ....................................................................................................................................... 33. TABLE 5 ABNORMAL RETURNS FOR LONG-TERM EVENT WINDOWS .......................................................... 36 TABLE 6 RELATION BETWEEN INNOVATION AND FUTURE STOCK PERFORMANCE, ESTIMATED BY OLS ... 39 TABLE 7 RELATION BETWEEN INNOVATION AND FUTURE STOCK PERFORMANCE, ESTIMATED BY WLS .. 43 TABLE 8 ABNORMAL RETURNS ESTIMATED VIA CALENDAR TIME PORTFOLIO APPROACH ......................... 48. 立. 政 治 大. ‧. ‧ 國. 學. n. er. io. sit. y. Nat. al. Ch. engchi. 3. i n U. v.
(5) Chapter 1. Introduction 1.1. Motivation and Objective. Motive for M&A activities varies, it typically include creating synergies, achieving growth, enhancing market power, accessing uncommon capacities, boosting EPS and diversification. The majority of prior studies have paid much attention to. 政 治 大. operational or financial synergy that is achieved as corporate entities combine. Devos,. 立. Kadapakkam, and Krishnamurthy (2009) suggest that operating synergies follow after. ‧ 國. 學. changes in operational aspects while financial synergies are mainly the result of tax. ‧. savings and utilization of leverage. In my article, I address this topic with the focus on. y. Nat. n. er. io. al. sit. operating synergies from innovation.. Ch. i n U. v. For years, firms have burned piles of money for research and development (R&D). engchi. activities. In fact, R&D investments not only cost money but also increase risk that enterprises assume. Recently, corporate takeovers are mentioned as one of the solutions to take place of internally developed R&D investments. With the presence of M&A markets, acquirers are able to gain their innovation capacities through the transference of patents, human resources and other intellectual properties after M&A deals. This concept offers companies a flexible alternative to achieve the identical. 4.
(6) level of innovation capacity as well as to save money and endeavors. Consequently, it is supposed that acquiring innovation should effectively enhance acquirers’ competence in innovation, and therefore improve acquires’ stock price performances.. On the other hand, prior studies regarding bidders’ return show inconsistent results. According to Martynova and Renneboog’s (2008) review over merger waves taking place from 1890s to 2000s, bidders averagely enjoy insignificant abnormal returns;. 政 治 大. this also holds for the latest two merger waves which started from 1980s. In this. 立. regard, it is intriguing to examine the relation between acquirers’ return and corporate. ‧. ‧ 國. 學. innovation.. sit. y. Nat. This paper aims to study whether taking over innovative targets yields a different. n. al. er. io. result with positive abnormal return. By employing calendar time portfolio, I try to. Ch. i n U. v. provide insights for public investors to see whether investing in an acquirer bidding. engchi. innovative target yields outperformance.. Therefore, I make the following questions:. does takeover for innovative targets create value to acquirers? Whether or not acquiring innovation is an important determinant for acquirer performance? If yes, what are the implications for the economy and investors?. 5.
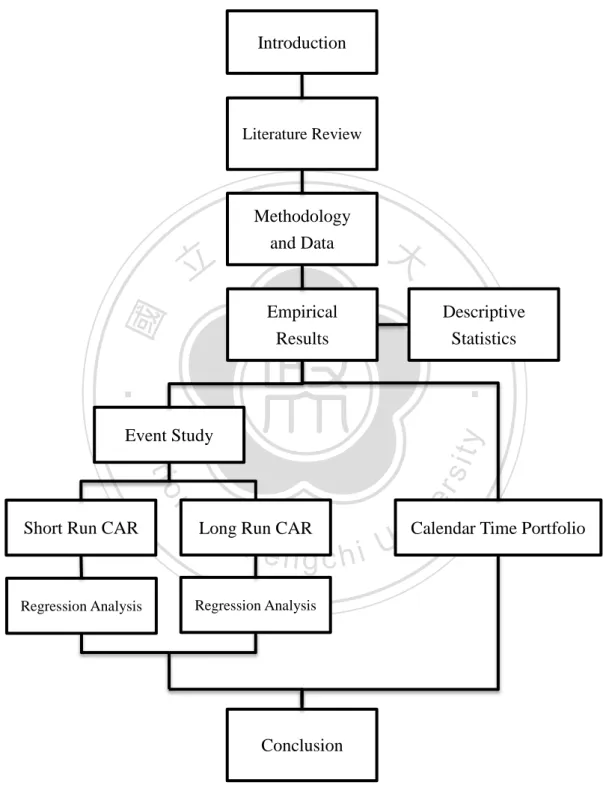
(7) 1.2. Procedure of the Study Figure 1 Procedure Flow. Introduction. Literature Review. 立. Methodology 政and Data治 大. ‧ 國. ‧. Nat. n. al. er. io. sit. y. Event Study. Short Run CAR. Regression Analysis. Descriptive Statistics. 學. Empirical Results. Ch. Long Run CAR. engchi. Regression Analysis. Conclusion. 6. i v Time Portfolio Calendar n U.
(8) Chapter 2. Literature Review This section involves two parts. It starts with the first subject: M&A return performance, which briefly looks over prior literatures regarding shareholder returns on M&A transactions. After that is the second part: innovation outsourcing. It reviews the recent studies on the strategic concept that deems innovation as the motive for M&A decisions.. 立. 政 治 大. ‧. ‧ 國. 學. 2.1. M&A Return Performance. Mergers and acquisitions have significant impacts on both financial market and. Nat. io. sit. y. the economy. We see huge waves of corporate takeovers taking place in US during. er. 1980s and 1990s. However, do corporate takeovers create values for the economies?. n. al. i n C If the answer is yes, where does thehvalue come from?U engchi. v. As to the first question, Martynova and Renneboog (2008) provide an insight with regard to whether M&A activities add values to the economy. By overviewing the takeover waves occurred in 20 century and examining the stock performance of acquirers and targets, Marina and Luc suggest that corporate takeovers have positive effect on the short-term wealth of the combined firms’ shareholders. When it comes to long-run performance, the empirical results tend to be mixed depending on the 7.
(9) methodology in which they employ. Studies that apply market model show inferior stock performance, measured by Cumulated abnormal returns (CARs), while those employing other measures, such like capital asset pricing model (CAPM), the market-adjusted model, or beta-decile matching portfolio give inconsistent results. As to methodologies to yield CAR, Barber and Lyon (1997) argue that return on reference portfolio matched by size and market-to-book ratio would be a better. 政 治 大. measure for excess return of portfolio composited by M&A companies. Mitchell and. 立. Stafford (2000) employ the calendar time portfolio regression for both. ‧ 國. 學. equally-weighted and value-weighted regression. Their work comes out as followed-. ‧. the former exhibits negative abnormal returns (-5% in a three-year window) with. Nat. io. sit. y. significance while the latter shows negative but insignificant one (-1.1%). On the. er. other hand, Agrawal and Jaffe (2003) shed lights on another aspect- wealth change in. al. n. v i n shareholders of target firms, andCturn return with the same approach. h eto npre-acquisition gchi U The research ends up with positive but insignificant CAAR under the various long-term windows.. More specifically, Tim and Anand(1997) combine pre-acquisition and post-acquisition returns, concluding that a positive CARs in M&A transactions occur when 1) the mode of takeover is a tender offer --in comparison to friendly merger deal, and 2) the transaction is paid in cash --rather than in exchange of stock. Positive 8.
(10) CARs in tender offers can be attributed to signaling effect of acquirers’ confidence as well as discipline of targets’ management. And better performance in cash transactions follows Myers and Majluf’s(1984) work, suggesting firms prefer to pay cash as their stock is undervalued. Paying in Cash also signals higher capacity for leverage and better ability to complete debt services in that cash payments are commonly accompanied with debt financing. Tim and Anand also study return on. 政 治 大. target firms and the result is consistent with those of prior studies- targets’ CARs are. 立. on average positive. Additionally, the paper analyzes impact of acquirers’ size relative. ‧ 國. 學. to that of targets on their CAR performance of target firms, reaching a conclusion that. ‧. CARs decrease as the relative ratio of target over acquirer increase.. sit. y. Nat. n. al. er. io. 2.2. Outsourcing Innovation. Ch. engchi. i n U. v. There are several explanations for reasons why companies engage in M&A activities. Motives to takeover activities typically include synergies, achieving growth, enhancing market power, accessing uncommon capacities, boosting EPS and diversification. Various inducements are broadly discussed both empirically and in real business. The majority of prior studies points to operational and financial synergies created as corporate entities combine. Erik, Palani-Rajan, and Srinivasan(2009) suggest that operating synergies result from changes in operation, 9.
(11) and financial synergies are mainly generated by tax savings and utilization of leverage. In my article, I focus on operating synergies, particular on those due to innovation.. Recently, technological innovation has been mentioned as one of the reasons for corporate takeovers. Chesbrough (2003) point out the “open innovation” business model, instead of developing internally, the concept emphasize on outward-oriented innovation network. In particular, companies are capable to achieve flexibility and. 政 治 大. efficiency by accessing and exploiting knowledge outside the firms. This implies. 立. technological innovations are eligible for one of the reason for M&As. Several studies. ‧ 國. 學. also investigate the impact of M&A deals on innovation performance. Hall (2006). ‧. researches relation between acquisition and change in R&D intensity subsequent to. y. Nat. al. er. io. sit. M&A, indicating a negative correlation, but the result is insignificant. In contrast, Hitt. v. n. et al. (1991) shed lights on both R&D as innovation inputs and patents as output.. Ch. engchi. i n U. They suggest trade-off exists between M&A investment- which is more predictableand risky R&D investment. Moreover, the outputs decline after acquisition as a result of management unwillingness to champion ideas that leads to patent outcomes. The significance becomes more apparent when it comes to diversifying acquisitions.. With regard to outsourcing innovation, Hagedoorn and Duysters (2002) investigate the acquisition of technological capacities with the focus on high-tech. 10.
(12) industry- the computer sector. They stress on the significance of strategic and organizational fit (relatedness) on innovation performance in computer industry, in which the technological capacities are the critical sources of corporate competitiveness. They also point out that influences of M&A on innovation may be either short-term or long-term. As acquirers intent only to access existing R&D capacities or technological output, the improvement in innovation capacity tend to be. 政 治 大. temporary. On the other hand, M&As oriented from synergetic new process- or. 立. product-related technologies eventually lead to long-term improvement in economic. ‧ 國. 學. performances as acquirers extend their technological skills and learning capacities. ‧. after M&As take place.. Higgins and Rodriguez (2006) center their studies on. Nat. io. sit. y. pharmaceutical industry, in which patent protection are the core of business. They find. er. firms suffering from deficiency in innovativeness are more likely to resort to. al. n. v i n C hcapacity in innovation. acquisition as a mean to outsource e n g c h i U However, their works are limited in particular R&D intensive industries rather than broad studies that we are interested in.. Hitt et al. use patent counts as a measure of innovation output. However, patent counts stand for innovation quantity, and “quality” may be ignored. Zhao (2009) resolve these questions by using patent citation counts as the proxy for innovation output quality and encompassing various industries over different time horizon. With 11.
(13) this approach, Zhao studied the interaction between M&A transactions and innovation capacity of firms involved in M&As. As acquiring innovation is less urgent for more innovative firms, they are less likely to make M&A bids. And even when launching into a takeover transaction, they are also less likely to complete the deal.. He further concluded that firms deficient in internal innovation effort resort to external M&A market for gaining knowledge base in technological innovation. On. 政 治 大. this premise, his work also shows formerly less innovative firms that complete the. 立. bidders benefit more than the contrasting group.. 學. ‧ 國. bids enjoy the most positive CARs after deal completion, suggesting this group of In other words, buying innovation. ‧. is one of the major considerations in corporate takeover decisions, and most. y. Nat. n. al. er. io. sit. importantly, it works!. i n U. v. Zhao’s work implies that acquirers are typically deficient in innovation capacity.. Ch. engchi. However, Bena and Li (2011) consider both innovation input and output (and concerning both quantity and quality), yielding a somewhat different result. They show that successful innovators as measured by patent outputs are more likely to be acquirers, while targets are generally active in R&D investments but not as successful as transferring innovation inputs into patents as acquirers. Furthermore, they also work on technological relatedness between acquirers and targets, concluding that. 12.
(14) technological overlap contributes positively (and significantly) to merger pairing, and is the critical source of synergy for M&A activities.. The remainder of my paper proceeds as follows. Chapter 3 describes the methodology employed in this study. In addition, I will further describe the data sources, variables selection and processing details. And then Chapter 4 presents the empirical results. It includes both long-term and short-term studies, and the result of. 政 治 大. calendar time portfolio. Last but not least, I will reach the conclusion in Chapter 5.. 立. ‧. ‧ 國. 學. n. er. io. sit. y. Nat. al. Ch. engchi. 13. i n U. v.
(15) Chapter 3. Methodology and the Data 3.1. Construction of Data. 3.1.1. Sample Formation. Our research period starts from 1980 to 2006. According to Martynova and Renneboog‘s (2008) review, there are five takeover waves during the last century.. 政 治 大 Among these waves, the立 forth (1981-1989) and the fifth (1993-2001) ones are. ‧ 國. 學. considered to be oriented by technological progress and technological innovation.. ‧. Therefore, I set the beginning of my research period at 1980, starting with all. sit. y. Nat. announced and completed acquisitions in US as defined by Mergers and Acquisitions. er. io. database of the Securities Data Company (SDC M&A). Among the M&A universe, I. al. n. v i n require the acquirers in my sample and the form of deal to be C h to be public firms engchi U classified as a merger, an acquisition, an acquisition (of both majority and remaining interest), or an acquisition of assets. Further, I focus my study on deals with deal value greater than or equal to $1 million. The filter leaves the sample size of 43,340 deals.. Then I match my M&A sample with patent data provided by the National Bureau of Economic Research (NBER). The dataset was established and maintained by Hall 14.
(16) et al. (2001). It offers information on registered patents, including applied years, citations received, and information of assignees’ identity. I recognize the applied year for all patents, calculating the innovation variables of the companies before announcement. The matching yields only 708 observations. Lastly, the stock transaction and financial data are respectively provided by the Center for Research in Security Prices (CRSP) and Compustat from Standard & Poor’s, the sample size is. 政 治 大. slightly reduced to 605 as the matching completes.. 立. ‧. ‧ 國. 學. 3.1.2. Innovation Variables. Following after Zhao’s work (2009), this paper continues focusing on two. y. Nat. al. er. io. sit. innovation measures: patent counts and average citation counts. In addition, I include. n. another two measures: total citation counts and citation-weighted patent counts.. 1.. Ch. engchi. i n U. v. Patent Count (Patcount_A, Patcount_T). Patent count is a measure of innovation “quantity”. It is defined as the total patents that have been granted or assigned to the companies. Thus, I calculate the patents received by the bidders and respective targets before the announcement date for each deal. The respective variables are denoted as followed:. Patcount_Ai: Total patent count granted to the acquirer of the deal. 15.
(17) Patcount_Ti: Total patent count granted to the target of the deal.. 2.. Total Citation Count (Citotal_A, Citotal_T). Total Citation measures the “quality” of a firm’s innovation capacity. It is calculated by aggregating citation counts across all patent owned by a specific firm. Similarly, I do this for the acquirers and targets for all deals. 政 治 大. Citotal_Ai: Total citation counts of all patents owned by the acquirer of the deal.. 立. Citotal_Ti: Total citation counts of all patents owned by the target of the deal.. Average Citation (Citavg_A, Citavg_T). ‧. ‧ 國. 學. 3.. Nat. io. sit. y. The third metrics, average citation, is defined as the ratio of total citation to patent. er. counts. Thus, it is the average citation of each patent which a company owns,. al. n. v i n C h quality more accurately measuring a firm’s innovation output in comparison with the engchi U previous metrics.. 4.. 𝐶𝑖𝑡𝑎𝑣𝑔_𝐴𝑖 =. 𝐶𝑖𝑡𝑜𝑡𝑎𝑙_𝐴𝑖 𝑃𝑎𝑡𝑐𝑜𝑢𝑛𝑡_𝐴𝑖. 𝐶𝑖𝑡𝑎𝑣𝑔_𝑇𝑖 =. 𝐶𝑖𝑡𝑜𝑡𝑎𝑙_𝑇𝑖 𝑃𝑎𝑡𝑐𝑜𝑢𝑛𝑡_𝑇𝑖. Citation-weighted Patent Count (Citwgtpat_A, Citwgtpat_T). This metric is somewhat similar to patent count in that it measures the quantity of 16.
(18) a firm’s innovation output. However, they are different in weights. As the name of the variable suggests, citation-weighted patent count is the aggregate patent counts with each patent’s citations relative to the whole patent universe as its weight. Therefore, it considers simultaneously both quality and quantity of each company. 𝑛. 𝐶𝑖𝑡𝑤𝑔𝑡𝑝𝑎𝑡_𝐴𝑖 = ∑ 𝑊𝑖 × 𝑃𝑎𝑡𝑐𝑜𝑢𝑛𝑡_𝐴𝑖 ; where 𝑊𝑖 = 𝑖=1. 𝑛. 政 治 大. 𝐶𝑖𝑡𝑤𝑔𝑡𝑝𝑎𝑡_𝑇𝑖 = ∑ 𝑊𝑖 × 𝑃𝑎𝑡𝑐𝑜𝑢𝑛𝑡_𝑇𝑖 ; 𝑤ℎ𝑒𝑟𝑒 𝑊𝑖 =. 立. 𝑖=1. 𝑊𝑖 𝑁 ∑𝑗=1 𝑊𝑗. ‧ 國. 學. 5.. 𝑊𝑖 𝑁 ∑𝑗=1 𝑊𝑗. 𝒂𝒕 𝒂𝒕 𝒂𝒕 Dummy Variables (𝑫𝒂𝒕 𝒑𝒂𝒕𝒄𝒐𝒖𝒏𝒕 , 𝑫𝒄𝒊𝒕𝒐𝒕𝒂𝒍 , 𝑫𝒄𝒊𝒕𝒂𝒗𝒈 , 𝑫𝒄𝒊𝒕𝒘𝒈𝒕𝒑𝒂𝒕 ). ‧. This paper aims to study the difference in performance between various groups of. y. Nat. al. er. io. sit. M&A sample. I suppose stock of acquirers bidding innovative targets yield positive. v. n. abnormal returns. Moreover, I want to know if an innovatively-deficient acquirer who. Ch. engchi. i n U. is bidding a relatively innovative target would yield a positive post-merger abnormal return. Therefore, I set the following dummy variables: 𝑎𝑡 𝑎𝑡 𝑎𝑡 𝑎𝑡 𝐷𝑝𝑎𝑡𝑐𝑜𝑢𝑛𝑡 , 𝐷𝑐𝑖𝑡𝑜𝑡𝑎𝑙 , 𝐷𝑐𝑖𝑡𝑎𝑣𝑔 , 𝐷𝑐𝑖𝑡𝑤𝑔𝑡𝑝𝑎𝑡 .. If the acquirer of a deal is less innovative than the target, then the dummy variable equals to “1”.. 𝑎𝑡 𝐷𝑝𝑎𝑡𝑐𝑜𝑢𝑛𝑡 =1, if the acquirer is less innovative than the target as measured by. 17.
(19) patent counts. 𝑎𝑡 𝐷𝑐𝑖𝑡𝑜𝑡𝑎𝑙 =1, if the acquirer is less innovative than the target as measured by total. citation. 𝑎𝑡 𝐷𝑐𝑖𝑡𝑎𝑣𝑔 =1, if the acquirer is less innovative than the target as measured by average. citation. 政 治 大. 𝑎𝑡 𝐷𝑐𝑖𝑡𝑤𝑔𝑡𝑝𝑎𝑡 =1, if the acquirer less innovative than the target as measured by. 立. citation-weighted patent count. ‧ 國. 學. 3.1.3. Controlling Variables. ‧ y. Nat. n. er. io. al. sit. 1. Industrial Relation (IND). i n U. v. According to Beatty (1994), acquisitions in the related industry prompt success. It. Ch. engchi. is self-manifest that the more familiar you are with the goods you are buying, the less likely that you are overpaying, and the more likely that you will utilize it better. Likewise, it makes sense that taking over targets in related businesses yields better post-merger integration. With SIC codes provided by SDC database, I distinguish focused M&A deals from diversifying ones by comparing the first-two digits of SIC codes. If the target’s codes are the same as that of acquirer’s, the deal is deemed as focused, and the industry dummy variable is set to be ”1”; otherwise, the dummy 18.
(20) equals to “0”.. 2. Methods of Payment (CASH). Tim and Anand (1997) suggest that positive CARs in M&A are observed when transactions are paid in cash. Corporate managers tend to “time the market” in not only financing decisions but method of payments in M&A investment as well. The outperformance results from the signal that stock price of the bidder is undervalued.. 政 治 大 Besides, cash payment is often accompanied by leverage, so paying cash also exhibits 立. ‧ 國. 學. the bidder’s competence in debt financing and ability to accomplish its debt services. Therefore, the CASH dummy is used to control this characteristic. When a transaction. ‧. n. al. er. io. including mixture of cash and stock, the dummy is set as “0”.. sit. y. Nat. is paid 100 percent in cash, the dummy Dcash equals to “1”; in other situations,. Ch. engchi. 3. Forms of Transaction (TDER). i n U. v. According to Tim and Anand (1997), abnormal return is not only captured by method of payment but also significantly influenced by form of transaction. A hostile tender offer, in comparison with a friendly merger, tends to perform well in that it reflects the bidders’ confidence in succeeding the transaction and the following integration. In this regard, I identify all tender offers by recognizing “tender offer flags” provided by SDC. The dummy equals to “1” if the deal is a tender offer. 19.
(21) 4. Growth (BM). Book-to-market ratio (BM) is defined as dividing book value of the company’s equity by its market value. This variable captures a firm’s growth nature. If the BM ratio of a firm is less than one, the firm is categorized as a “growth firm”. Prior studies suggest that growth stocks perform relatively poor comparing to value stocks. Thus, the growth effect should be controlled.. 政 治 大. 立. 5. Profitability (ROA). ‧ 國. 學. Acquirers with better operating performance usually do better in post-merger. ‧. integration. Hence, the stocks tend to outperform their peers. In my paper, I control. Nat. io. sit. y. acquirers’ operating efforts by using ROA before announcement as controlling. n. al. er. variable, where ROA equals to average Earnings before interest and taxes (EBIT). Ch. engchi. divided by average book value of total assets (TA):. 𝑅𝑂𝐴𝑖,𝑡 =. i n U. v. (𝐸𝐵𝐼𝑇𝑖,𝑡−1 + 𝐸𝐵𝐼𝑇𝑖,𝑡 )/2 (𝑇𝐴𝑖,𝑡−1 + 𝑇𝐴𝑖,𝑡 )/2. 6. Previous Return (PRET). This variable is set to control the momentum effect on firm’s post-merger stock performance. It is the firm’s aggregate return for the past 6 months before announcement date. 20.
(22) 7. Firm Size (SIZE). Firm Size is defined as logarithm of the firm’s market cap measured by stock transaction data prior to announcement date.. 𝑆𝐼𝑍𝐸𝑖,𝑡 = ln(𝑀𝑉𝑖,𝑡 ),. 𝑤ℎ𝑒𝑟𝑒 𝑀𝑉𝑖,𝑡 is firm i′ s market value of equity at time t. 8. Asset Growth (AG). 立. 政 治 大. ‧ 國. 學. Similarly as ROA, asset growth depicts another dimension of a company’s operation. Specifically, it is the yearly growth rate of book value of total asset at the. ‧ sit. n. al. er. io. 9. Debt Ratio (DR). y. Nat. fiscal year just before the announcement.. Ch. engchi. i n U. v. Debt ratio is used to control the effect of leverage on stock performance. I define the variable as the average book value of total liabilities divided by average book value of total assets.. 𝐷𝑅𝑖,𝑡 =. (𝑇𝐿𝑖,𝑡−1 + 𝑇𝐿𝑖,𝑡−1 )⁄2 (𝑇𝐴𝑖,𝑡−1 + 𝑇𝐴𝑖,𝑡 )⁄2. TLi,t: book value of total liabilities of firm i at year t. TAi,t: book value of total assets of firm i at year t 21.
(23) 3.2. Methodology. 3.2.1. Event Study. In this paper, I apply event study as methodology for both long-term and short-term studies. Event study was firstly employed by Dolley (1933), and was consecutively refined by Brown (1968), Fama (1969) and Warner (1980). Figure 2. 立. 政 治 大. ‧ 國. ‧. t3. t2. Event Date(0). t4. al. er. io. sit. y. Nat. t1. Event Period. 學. Estimate Period. v. n. I adopt daily return for my short-term study while choosing monthly return for the. Ch. engchi. i n U. long-term one. With a list of M&A sample, I firstly divide my sample into two groups by target’s patent count: one is stronger than median while the other one is weaker. Then I redo the process by other innovation measures respectively. The purpose of the study is to see whether acquiring innovative target yields significant abnormal return. I define the event date (date 0) as the announcement date of each deal, setting the event period which starts from t3 to t4, and then match the respective return data. Afterward I estimate expected returns via applying asset pricing model- market model 22.
(24) or Fama-French’s three factor model- then a set of cross-sectional abnormal returns (ARs) are ready for test.. 1. Short-term Horizon. For the short-run horizon, I use daily return data from CRSP dataset, and the data of market return is available on French’s Data Library. As to the factor model, I employ market model to estimate the expected return for each takeover deal:. 立. 𝑅̂ ̂ + 𝛽̂ 𝑅𝑚,𝑡 𝑖,𝑡 = 𝛼. ‧. ‧ 國. 學. Where:. 政 治 大. Rm,t: the daily return of market portfolio on date t. n. al. Ch. engchi. er. io. sit. y. Nat. 𝑅̂ 𝑖,𝑡 : the expected daily return of stock i on date t. i n U. v. Then the abnormal return (AR) can be calculated by subtracting actual return by expected return:. 𝐴𝑅𝑖,𝑡 = 𝑅𝑖,𝑡 − 𝑅̂ 𝑖,𝑡. Where:. Ri,t is the actual daily return of stock i on date t. 23.
(25) I design my research by setting the event windows as (0, +1), (0, +3), and (0, +5); to eliminate the contamination resulting from potential insiders’ action, the estimate period is set as (-110, -10).. 2. Long-term Horizon. The methodology employed in my long-term study is quite similar with that of short-term. Except that I use monthly return data and the Fama-French’s three factor. 政 治 大 model for estimate of expected return. The asset pricing factors- market premium, 立 ̂ ̂ 𝑅̂ 𝑖,𝑡 = 𝑟𝑓𝑡 + 𝛽 × (𝑅𝑚,𝑡 − 𝑟𝑓𝑡 ) + 𝑠̂ × 𝑆𝑀𝐵𝑡 + ℎ × 𝐻𝑀𝐿𝑡. n. al. er. io. sit. y. Nat. Where:. ‧. ‧ 國. 學. small firm premium, and value premium- are also provided by French’s Data Library.. i n U. 𝑅̂ 𝑖,𝑡 : the expected monthly return of stock i on month t. Ch. engchi. v. rft : the return on risk-free asset on month t. Rm,t - rft: market premium on month t. SMBt : small-firm premium on month t. HMLt: value premium on month t. The event windows in this section are set as (+1, +6), (+1, +12), (+1, +36) and (+1, 24.
(26) +60), and the estimate period is set from -36 to -1.. 3.2.2. Multiple Regression Analysis. Prior section groups the sample by various innovation metrics, testing for the significance for each group. However, event study does not show directly the relationship between abnormal return and innovation. If the abnormal returns in prior. 政 治 大. section are proven to be significant (and positive), I will further explore the influence. 立. of the innovation measures on abnormal return. Thus, this section aims to explain. ‧ 國. 學. whether abnormal return can be attributed to innovation via multiple regression. ‧. analysis. In addition to conventional Ordinary Least Squares (OLS) method, I employ. y. Nat. al. er. io. sit. Weighted Least Square (WLS) procedure in my analysis with the acquirers’. n. inflation-adjusted size as the weights. The regression model is shown below:. Ch. engchi. i n U. v. 𝐴𝐴𝑅𝑖,𝑡 = 𝛼0 + 𝛽1 𝑃𝑎𝑡𝑐𝑜𝑢𝑛𝑡_𝑇𝑖,𝑡 + 𝛽2 𝐶𝑖𝑡𝑜𝑡𝑎𝑙_𝑇𝑖,𝑡 + 𝛽3 𝐶𝑖𝑡𝑎𝑣𝑔_𝑇𝑖,𝑡 𝑎𝑡 𝑎𝑡 𝑎𝑡 + 𝛽4 𝐶𝑖𝑡𝑤𝑔𝑡𝑝𝑎𝑡_𝑇𝑖,𝑡 + 𝛽5 𝐷𝑝𝑎𝑡𝑐𝑜𝑢𝑛𝑡 + 𝛽6 𝐷𝑐𝑖𝑡𝑜𝑡𝑎𝑙 + 𝛽7 𝐷𝑐𝑖𝑡𝑎𝑣𝑔 𝑎𝑡 + 𝛽8 𝐷𝑐𝑖𝑡𝑤𝑔𝑡𝑝𝑎𝑡 + 𝛽9 𝑓𝑡 + 𝛽10 𝐼𝑁𝐷𝑖,𝑡 + 𝛽11 𝐶𝐴𝑆𝐻𝑖,𝑡 + 𝛽12 𝑇𝐷𝐸𝑅𝑖,𝑡. + 𝛽13 𝐵𝑀𝑖,𝑡 + 𝛽14 𝑅𝑂𝐴𝑖,𝑡 + 𝛽15 𝑃𝑅𝐸𝑇𝑖,𝑡 + 𝛽16 𝑆𝐼𝑍𝐸𝑖,𝑡 + 𝛽17 𝐴𝐺𝑖,𝑡 26. + 𝛽18 𝐷𝑅𝑖,𝑡 + ∑ 𝛽𝑖 𝑓𝑖,𝑡 + 𝑒𝑖,𝑡 𝑖=1. The dependent variable is the average abnormal returns (AAR) of each 25.
(27) observation; and the independent variables are the innovation variables and the controlling variables mentioned in section 3.1. Besides, my research period starts from 1980 to 2006 (27 years in total), so I set 26 year dummies, ft, to control yearly difference.. 3.2.3. Calendar Time Portfolio. 政 治 大. This method aims to create a time-series abnormal return data. My investment. 立. horizon starts from January 1980, ends at December 2006. Beginning from the first. ‧ 國. 學. month in my research period, I calculate the abnormal return for each month on a. ‧. portfolio composed of bidders that announce M&A deals during a defined event. y. Nat. al. er. io. sit. period (in my paper, two years). In my paper, I construct two portfolios with different. n. weights, each portfolio is either equally-weighted or value-weighted. Besides, I. Ch. engchi. i n U. v. require each the portfolio contains three stocks in every single month. By comparing the time-series portfolio returns with expected returns estimated by Fama-French 3-factor model, the significance of abnormal returns are examined.. 26.
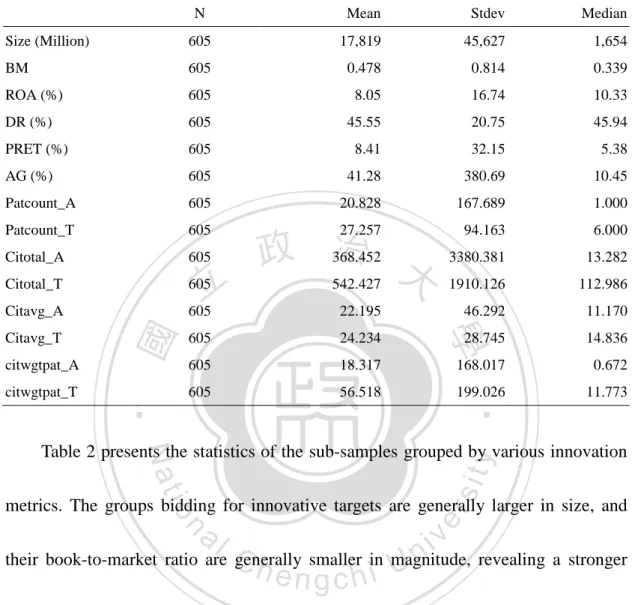
(28) Chapter 4. Empirical Result This chapter contains the finding of my research. Section 4.1 presents the descriptive statistics. I will make an overview on the data profile. In section 4.2 and section 4.3, I will show the result of event study under short-term and long-term perspective, respectively. The last part, section 4.4, shows my study on calendar time portfolio.. 立. 政 治 大. ‧. ‧ 國. 學. 4.1. Descriptive Statistics. This section presents the descriptive statistics of my sample, including mean,. Nat. io. sit. y. standard deviation (Stdev), and median for each independent variable. Table 1 reports. er. the statistics of the whole sample. The table shows the average market cap of overall. al. n. v i n acquirers is 17.82 billion while C it median 1.65 billion, suggesting a skew-right h e nisgonly chi U distribution. The sample mainly consists of growth firms, this could be observed by book-to-market ratio; it is consistent with prior findings that acquirers tend to be growth firms. Also, the acquirers enjoy positive prior stock returns and asset growth. As to the innovation measures, there’s an interesting finding that responds to my research: under each innovation metric, the mean and median values of target firms are greater than that of the acquirers. 27.
(29) Table 1 Desriptive statistics of the whole sample This table provides descriptive statistics for all acquirers that announce M&A transactions during my research period: 1980-2006.Variable definitions are given in Section 3.1.3 N. Mean. Stdev. Median. Size (Million). 605. 17,819. 45,627. 1,654. BM. 605. 0.478. 0.814. 0.339. ROA (%). 605. 8.05. 16.74. 10.33. DR (%). 605. 45.55. 20.75. 45.94. PRET (%). 605. 8.41. 32.15. 5.38. AG (%). 605. 41.28. 380.69. 10.45. Patcount_A. 605. 20.828. 167.689. 1.000. Patcount_T. 605. 27.257. 94.163. 6.000. Citotal_A. 605. 368.452. 3380.381. 13.282. Citotal_T. 605. 542.427. 1910.126. 112.986. Citavg_A. 605. 22.195. 46.292. 11.170. 605. 24.234. 605. 18.317. 605. 56.518. 28.745. 14.836. 168.017. 0.672. 199.026. 11.773. ‧. citwgtpat_T. ‧ 國. citwgtpat_A. 學. Citavg_T. 立. 政 治 大. io. sit. y. Nat. Table 2 presents the statistics of the sub-samples grouped by various innovation. er. metrics. The groups bidding for innovative targets are generally larger in size, and. al. n. v i n their book-to-market ratio are C generally smaller in magnitude, revealing a stronger hengchi U characteristics of growth firm. Also, they perform slightly better in profitability as measured by pre-announcement ROA. Intriguingly, the statistics of innovation measures shows a common relation, the acquirers bidding for innovative targets have stronger innovation capacity on their own.. 28.
(30) Table 2 Descriptive statistics, sort by innovation measures The table contains M&A transactions announced during my research period: 1980-2006. It provides descriptive statistics for acquirers sorted by innovation metrics of the respective targets. The strong-target group consists of deals with targets whose innovation metrics are greater than the median of overall sample, while the weak-target group contains the rest. Variable definitions are given in Section 3.1.3 Weak-target Sort by. Strong-target. N. Mean. Stdev. Median. N. Mean. Stdev. Median. Size (million). 322. 15,860. 44,948. 1,422. 283. 20,053. 46,366. 2,050. BM. 322. 0.55. 1.04. 0.35. 283. 0.40. 0.44. 0.31. ROA (%). 322. 7.52. 16.88. 9.69. 283. 8.65. 16.58. 10.94. PRET (%). 322. 9.46. 32.60. 6.40. 283. 7.22. 31.64. 5.12. Patcount_A. 322. 9.13. 59.49. 1.00. 283. 34.06. 236.03. 1.00. Patcount_T. 322. 5.31. 43.18. 2.00. 283. 52.09. 125.13. 19.00. Patent Count. Weak-target. Strong-target. Mean. Size (million). 308. 12,637. BM. 308. ROA (%). 308. PRET (%) Cototal_A. Median. N. Mean. Stdev. Median. 42,160. 1,163. 297. 23,244. 49,474. 2,505. 1.09. 0.38. 297. 0.38. 0.42. 0.30. 7.05. 17.66. 9.76. 297. 9.09. 16.20. 10.84. 308. 9.77. 31.63. 6.97. 297. 6.99. 32.97. 4.04. 308. 134.09. 783.48. 11.43. 297. 612.13. 4758.19. 17.95. 308. 116.15. 1348.19. 26.76. 297. 985.64. 2308.30. 343.62. Stdev. Median. 立. 0.57. Weak-target. N. Mean. Size (million). 309. 11,469. 35,872. 1,281. 296. 24,467. 53,240. 2,404. BM. 309. 0.59. 1.08. 0.40. 296. 0.36. 0.32. 0.28. ROA (%). 309. 14.37. 9.81. 8.43. 18.90. 10.62. PRET (%). 309. 8.81. 30.99. 5.54. Citavg_A. 309. 16.60. e n33.27 g c h i 8.75 50.25. 296. 28.01. 41.06. 17.01. Citavg_T. 309. 8.22. 296. 40.88. 33.42. 29.98. n. a l 7.68 Ch 8.02. 4.97. er. Median. io. Stdev. y. Nat. Mean. sit. Strong-target. N. Average Citation. v i 296 n 4.90 U 296 8.48. Weak-target. Strong-target. N. Mean. Stdev. Median. N. Mean. Stdev. Median. Size (million). 304. 12,953. 41,592. 1,288. 301. 22,623. 48,881. 2,389. BM. 304. 0.48. 0.51. 0.38. 301. 0.47. 1.03. 0.30. 304. 7.33. 16.88. 9.75. 301. 8.75. 16.60. 10.75. PRET (%). 304. 9.75. 31.27. 7.04. 301. 7.09. 32.98. 4.08. Citwgtpat_A. 304. 6.59. 37.78. 0.57. 301. 29.82. 233.10. 0.88. Citwgtpat_T. 304. 3.72. 3.12. 2.75. 301. 108.30. 270.45. 35.68. Citation-weighted ROA (%) Patent Count. ‧. Citotal_T. Stdev. ‧ 國. Total Citation. 政 治 大. 學. N. 29.
(31) 4.2. Short-term Perspective. In the short-run study, we will focus on the announcement effect on M&A deals. We use daily return data in this part. The estimate period is (-110, -10), and I examine the abnormal returns under 4 innovation measures across 3 event windows: (0, +1), (0, +3), and (0, +5). Table 3 shows the result of hypothesis test on the significance of. 政 治 大 event window are used, bidders 立 in both groups suffer from negative post-merger abnormal returns. It is obvious that no matter what innovation measure and what. ‧ 國. 學. abnormal returns. The result is not supportive to my hypothesis that acquirers bidding. ‧. innovative targets enjoy stock price outperformance. Moreover, as I comparing the. sit. y. Nat. means of abnormal returns, it seems that the ones with innovative targets being lower. er. io. than their peers almost under every measure. In this regard, I wonder if the. al. n. v i n strong-target bidders really underperform C h the matchingUgroups. engchi. Hence, I further conduct the independent two-sample t-test to see if the difference is significant. The result is shown in Table 4. Fortunately, only few measures under particular event windows are proven to be significant. In general, the independent t-test tells that the difference of each pairs is inconsistent, so there is no evidence concluding that bidding innovative targets does harm to stock performance. Rather, it suggests the poor performance being a general phenomenon in the whole 30.
(32) M&A universe. This is consistent with the prevailing findings of prior studies which suggest acquirers generally yield poor results in stock performance.. 立. 政 治 大. ‧. ‧ 國. 學. n. er. io. sit. y. Nat. al. Ch. engchi. 31. i n U. v.
(33) Table 3 Abnormal returns for short-term event windows This table reports announcement and short-term abnormal returns for acquirers under different innovation measures. The strong-target group consists of deals with targets whose innovation metrics are greater than the median of overall sample, while the weak-target group contains the rest. Abnormal returns over (t3, t4) event window are defined in section 3.2.1. Mean value of abnormal returns is presented as Mean; standard deviation is presented as Stdev; p-values are in brackets.. Whole Sample. Sort by Patcount. Frequency:. Weak (1). Weak. Strong. (1). (2). (1). (2). 273. 292. 284. 286. 290. 288. 288. -0.5002. -1.1511. -0.5310. -1.0943. -0.5491. -1.0647. -0.5460. -1.0715. 4.4952. 4.5907. 4.4782. 4.6099. 4.8035. 4.2748. 4.4571. 4.6306. (0.054) *. (0.000) ***. (0.039) **. (0.000) ***. -0.3147. -0.5799. -0.3158. -0.5738. Mean. -0.8087. Stdev. 4.5484. p-value. (0.000) ***. (0.054) *. (0.000) ***. (0.044) **. (0.000) ***. Mean. -0.4456. -0.2938. -0.6114. -0.3065. -0.5872. Stdev. 3.5608. p-value. y. sit. er. io. 3.6212. 3.4950. 3.4720. 3.6441. (0.000) ***. 3.4807 3.6374 a l 3.6582 i v*** (0.019) ** (0.000) *** (0.017) ** (0.000) n Ch engchi U. (0.018) **. (0.000) ***. (0.014) **. (0.000) ***. Mean. -0.2367. -0.2185. -0.2566. -0.1867. -0.2881. -0.1180. -0.3611. -0.1892. -0.2841. Stdev. 3.2594. 3.2194. 3.3039. 3.1661. 3.3533. 3.2502. 3.2659. 3.1614. 3.3550. p-value. (0.001) ***. (0.022) **. (0.012) **. (0.049) **. (0.005) ***. (0.223). (0.000) ***. (0.047) **. (0.005) ***. 3.4647. n. (0,+5). Strong. 303. Nat. (0,+3). Citwgtpat. Weak. ‧. (0,+1). 576. Citavg. 學. Sample Size. ‧ 國. Daily data. 治 政 Citotal 大 Strong Weak Strong 立 (2) (1) (2). 32.
(34) Table 4 Differences in abnormal returns by innovation metrics for short-term event windows. This table reports differences in short-term abnormal returns for acquirers under innovation measures. Abnormal returns over (t 3, t4) event window are defined in section 3.2.1. Mean value of abnormal returns is presented as Mean; standard deviation is presented as Stdev; p-values are in brackets.. Sort by Patcount Weak – Strong. Frequency:. (1) - (2) Mean. (1) - (2). (1) - (2). (1) - (2). 0.5633. 0.5156. 0.5255. 0.3788. 0.3787. (0.174). (0.166) 0.2579. 0.1856. 0.1856 (0.165) 0.0948. 0.1388. 0.1389. (0.080) *. (0.495). (0.087) *. (0.138). 0.3176. 0.2807. 0.1857. 0.1856 (0.131). (0.153). Mean. 0.0381. 0.1014. 0.2431. Stdev. 0.1390. p-value. (0.784). 0.1389. n. al. Ch. er. (0.088) *. io. p-value. y. 0.3787. sit. 0.3789. 0.2652. Mean Stdev. (0,+5). Weak - Strong. ‧. (0,+3). Weak - Strong. 學. p-value. Citwgtpat. Nat. Stdev. 0.6508. 立. Citavg. 政 Weak治- Strong大. ‧ 國. Daily data (0,+1). Citotal. n engchi U (0.466). 33. iv.
(35) 4.3. Long-term Perspective. In section 4.2, we examine how stock market reacts to an acquisition for innovation, and we have seen my hypothesis under short-term event windows is not supported by the result. Instead, it once again confirms the existing argument that acquirers tend to underperform. In this section, we focus on the long-term perspective of wealth effect.. 立. 政 治 大. As we know, firms need further integration in every type of business. ‧ 國. 學. combination, including M&As; and it may be time-consuming to integrate two firms. ‧. with divergent cultures and capacities. Innovation capacities should not be exception.. y. Nat. al. er. io. sit. For instance, after the ownership of target’s patents is transferred, it takes times for. n. acquirers to get familiar with them so that new designs could be accomplished.. Ch. engchi. i n U. v. Likewise, while taking over R&D team, it also takes time for acquirers to fit in the new members of the teams. In this respect, the merits of post-merger integration should be examined under a long-term horizon.. Table 5 shows the result of my long-term study on post-merger abnormal returns.. As mentioned in section 3.2, the methodology is pretty similar with that I employ in my short-term study, except that I adopt monthly return data in this section. The estimate period is (-36, -1), and I examine the abnormal returns under 4 innovation 34.
(36) measures across 5 event windows: (+1, +6), (+1, +12), (+1, +24), (+1, +36), and (+1, +60). We can see under all event windows, the acquirers bidding innovative targets enjoy positive abnormal returns, their mean in each group reveal all positive numbers and collectively outperform their respective peers. In contrast, the abnormal returns of matching groups are proven to be insignificant; even some of the matching groups, especially for those whose event periods are less than one year, still suffer from. 政 治 大. negative performance (although not significant). Moreover, as I prolong my event. 立. windows to more than two years, the abnormal returns become consistently. ‧ 國. 學. significant for various innovation metrics and across all of the event windows. This. ‧. finding is quite different from that of short-term study, showing that acquiring strong. Nat. io. sit. y. targets behaves better than the overall M&A universe. My hypothesis of the long-run. n. al. er. perspective is therefore confirmed.. Ch. engchi. 35. i n U. v.
(37) Table 5 Abnormal returns for long-term event windows. This table reports announcement and long-term abnormal returns for acquirers under different innovation measures. The strong-target group consists of deals with targets whose innovation metrics are greater than the median of overall sample, while the weak-target group contains the rest. Abnormal returns over (t3, t4) event window are defined in section 3.2.1. Mean value of abnormal returns is presented as Mean; standard deviation is presented as Stdev; p-values are in brackets.. Whole. Sort by. Sample Freqency:. Patcount. Monthly data. Weak Sample Size Stdev. 10.8456. 11.1462. p-value. (0.623). Mean Stdev. Weak. Strong. 286. 290. 288. 288. -0.2017. 0.3881. -0.1918. 0.3787. -0.2017. 0.3723. 10.4954. 10.8501. 10.8359. 10.4177. 11.2678. 10.6778. 11.0030. (0.492). (0.132). (0.424). (0.130). (0.428). (0.156). (0.423). (0.147). 0.1105. -0.0107. 0.2446. -0.0529. 0.2777. -0.1591. 0.3876. -0.0142. 0.2313. 10.8550. 11.0450. 10.6408. 10.7889. 10.9212. 10.3326. 11.3619. 10.6653. 11.0359. p-value. (0.389). (0.952). (0.180). (0.768). (0.130). Mean. 0.2131. 0.1871. 0.2417. 0.1349. 0.2925. Stdev. 10.7693. 10.9356. 10.5842. 10.7216. 10.8176. 立. p-value. (0.019) **. (0.143). Mean. 0.1636. 0.1209. Stdev. 10.8254. 11.0238. (0.062) *. al. 0.2104. (0.291). (0.024) **. 0.0076. 0.3210. iv 10.6038 n C h 10.8387 10.8101 U *** e n(0.944) (0.052) * g c h i (0.003). p-value. (0.032) **. (0.260). Mean. 0.1756. 0.1319. 0.2226. 0.0267. Stdev. 10.7487. 10.9001. 10.5833. 10.7581. p-value. (0.005) ***. (0.131). y. 0.3820. Strong. 284. sit. -0.1748. 政 治 大. er. 0.0883. Weak. ‧. Mean. Strong. Citwgtpat. 292. n. (+1,+60). 273. io. (+1,+36). 303. Nat. (+1,+24). 576. Weak. Citavg. 學. (+1,+12). Strong. ‧ 國. (+1,+6). Citotal. (0.011) **. (0.761). 36. (0.353). (0.042) **. (0.937). (0.206). -0.0861. 0.5163. 0.1747. 0.2501. 10.2446. 11.2687. 10.6379. 10.8950. (0.481). (0.000) ***. (0.173). (0.053) *. -0.0755. 0.4040. 0.0407. 0.2814. 10.3829. 11.2482. 10.7601. 10.8868. (0.465). (0.000) ***. (0.707). (0.009) ***. 0.3239. -0.0854. 0.4347. 0.0701. 0.2750. 10.7376. 10.3874. 11.0902. 10.6804. 10.8122. (0.000) ***. (0.314). (0.000) ***. (0.427). (0.002) ***.
(38) After studying the result of event study, I want to prove further if the superior performance of strong-target groups could be attributed to the targets’ innovation efforts. Therefore I conduct multiple regression analysis to see the direct relationship between abnormal returns and all sorts of innovation effort. The full model is discussed in section 3.2.2. I report only one innovation measure at one time in a model. The regression coefficients and p-values are presented in Table 6.1, Table 6.2,. 政 治 大. and Table 6.3 for the event windows of (+1, +24), (+1, +36), and (+1, +60),. 立. respectively. These tables show that firms with better operation, as measured by. ‧ 國. 學. pre-acquisition ROA, perform positively; as to asset growth, another dimension of. ‧. operating result, the relation is positive, but insignificant. Also, past returns do not. y. Nat. al. er. io. sit. explain future performance; this result coincides with weak-form market efficiency.. v. n. However, there is a surprising finding that the tender offer dummy show significant. Ch. engchi. i n U. negative effect on abnormal returns. Here I propose a possible reason for the interesting finding. The matching of M&A list and patent data in my study acts as a filter, automatically selecting firms periodically report their innovation efforts. Though the extent varies, my sample universe consists of firms engaging in innovation activities. Tender offers are deemed as hostile mean in M&A, more often than not, the bidders replace the managements after taking over and restructure target firms in a fierce manner. It inevitably does harm to post-merger integration, which is 37.
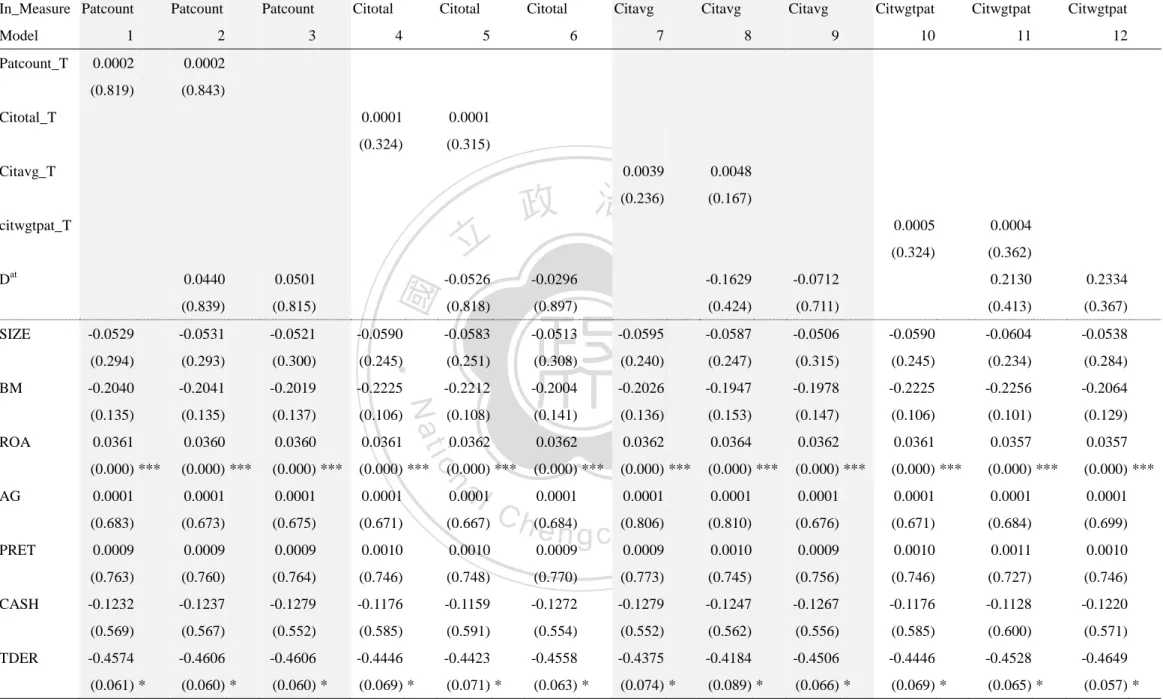
(39) especially critical for an innovation-oriented firm, and therefore damage the future stock price.. Now, go back to the main point of my study, innovation measures. The OLS regression analysis shows that all innovation measures have positive relation with abnormal returns, although the relations are not consistently significant. Only average citation explains abnormal return consistently under the longest event window: (+1,. 政 治 大. +60), suggesting average citation being a better measure in the long-run. This finding. 立. is consistent with Zhao’s research (2009) that indicates citation count (Zhao define. ‧ 國. 學. citation counts in the same way I define average citation in my study) as the effective. ‧. measure for innovation quality, which plays a major role in M&A decision. On the. y. Nat. al. er. io. sit. other hand, the innovation dummy, which stands for merger pair with weak acquirer. v. n. and strong target, yields an inconclusive result, with neither apparent pattern of sign nor significance.. Ch. engchi. 38. i n U.
(40) Table 6.1 Relation between Innovation and Future Stock Performance under the event window of (+1, +24), estimated by OLS In_Measure Patcount. Patcount_T. Patcount. 1. 2. 3. 0.0002. 0.0002. (0.819). (0.843). Citotal_T. Citotal. Citotal. Citotal. 4. 5. 0.0001. 0.0001. (0.324). (0.315). Citavg_T. citwgtpat_T. CASH. TDER. -0.0521. (0.294). (0.293). -0.2040. (0.167). (0.818). (0.897). -0.0590. -0.0583. -0.0513. (0.300). (0.245). (0.251). -0.2041. -0.2019. -0.2225. -0.2212. (0.135). (0.135). (0.137). (0.106). 0.0361. 0.0360. 0.0360. 0.0361. (0.000) ***. (0.000) ***. (0.000) ***. (0.000) ***. 0.0001. 0.0001. 0.0001. 0.0001. (0.683). (0.673). (0.675). (0.671). 0.0009. 0.0009. 0.0009. 0.0010. C h(0.684) (0.806)U n i (0.667) engchi 0.0010 0.0009 0.0009. (0.763). (0.760). (0.764). (0.746). (0.748). (0.770). -0.1232. -0.1237. -0.1279. -0.1176. -0.1159. (0.569). (0.567). (0.552). (0.585). -0.4574. -0.4606. -0.4606. (0.061) *. (0.060) *. (0.060) *. Citwgtpat. Citwgtpat. 10. 11. 12. 0.0005. 0.0004. (0.324). (0.362). -0.0712. 0.2130. 0.2334. (0.424). (0.711). (0.413). (0.367). -0.0595. -0.0587. -0.0506. -0.0590. -0.0604. -0.0538. (0.308). (0.240). (0.247). (0.315). (0.245). (0.234). (0.284). -0.2004. -0.2026. -0.1947. -0.1978. -0.2225. -0.2256. -0.2064. (0.108). (0.141). (0.136). (0.153). (0.147). (0.106). (0.101). (0.129). 0.0362. 0.0362. 0.0362. 0.0362. 0.0361. 0.0357. 0.0357. (0.000) ***. (0.000) ***. (0.000) ***. (0.000) ***. (0.000) ***. (0.000) ***. 0.0001. 0.0001. 0.0001. 0.0001. (0.810). (0.676). (0.671). (0.684). (0.699). 0.0010. 0.0009. 0.0010. 0.0011. 0.0010. (0.773). (0.745). (0.756). (0.746). (0.727). (0.746). -0.1272. -0.1279. -0.1247. -0.1267. -0.1176. -0.1128. -0.1220. (0.591). (0.554). (0.552). (0.562). (0.556). (0.585). (0.600). (0.571). -0.4446. -0.4423. -0.4558. -0.4375. -0.4184. -0.4506. -0.4446. -0.4528. -0.4649. (0.069) *. (0.071) *. (0.063) *. (0.074) *. (0.089) *. (0.066) *. (0.069) *. (0.065) *. (0.057) *. ‧ 國. -0.0531. (0.236). 政 治 大. 9. Citwgtpat. -0.1629. (0.000) ***. al. n. PRET. -0.0529. 0.0048. -0.0296. io. AG. (0.815). 0.0039. -0.0526. Nat. ROA. (0.839). 8. 0.0001. 0.0001. 39. ‧. BM. 0.0501. 7. 學. SIZE. 0.0440. Citavg. y. Dat. 6. Citavg. sit. 立. Citavg. 0.0364. er. Model. Patcount. 0.0001. (0.000) ***. v0.0001.
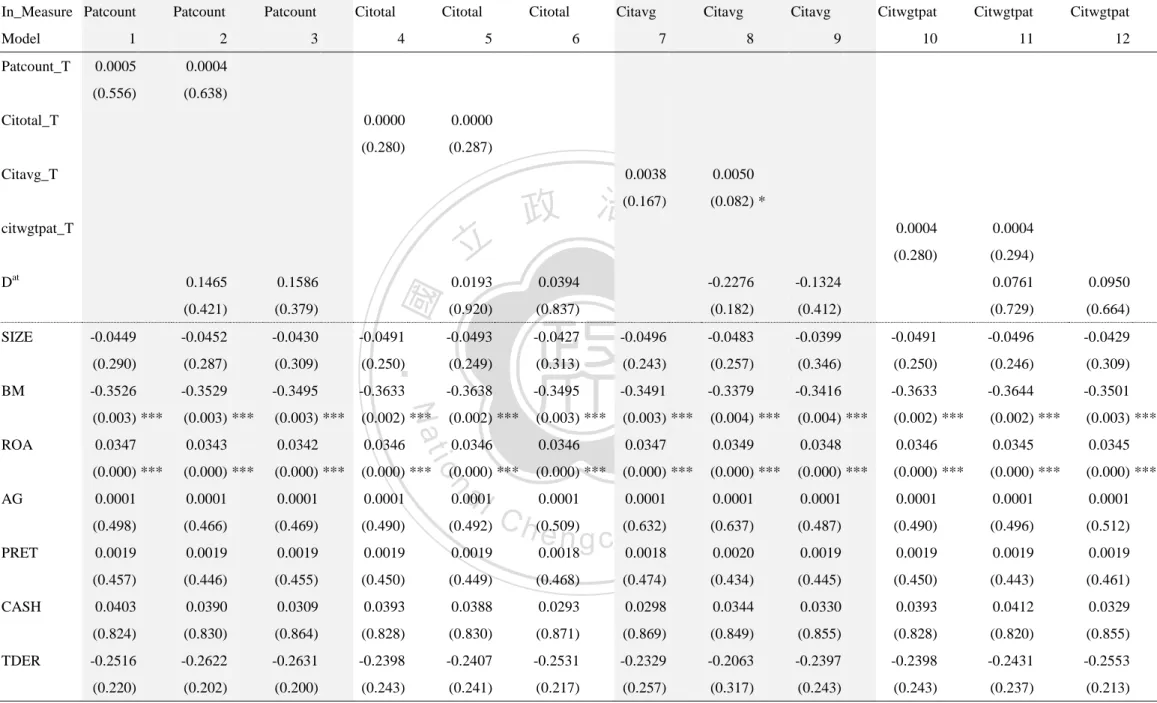
(41) Table 6.2 Relation between Innovation and Future Stock Performance under the event window of (+1, +36), estimated by OLS In_Measure Patcount Model Patcount_T. Patcount. Patcount. 1. 2. 3. 0.0005. 0.0004. (0.556). (0.638). Citotal_T. Citotal. Citotal. Citotal. 4. 5. 0.0000. 0.0000. (0.280). (0.287). Citavg 6. Citavg_T. Citavg 7. 8. 0.0038. 0.0050. 政 治 大 (0.167). citwgtpat_T. (0.837). -0.0452. -0.0430. -0.0491. -0.0493. -0.0427. (0.290). (0.287). (0.309). (0.250). (0.249). -0.3526. -0.3529. -0.3495. -0.3633. -0.3638. (0.003) ***. (0.003) ***. (0.003) ***. (0.002) ***. 0.0347. 0.0343. 0.0342. 0.0346. (0.000) ***. (0.000) ***. (0.000) ***. (0.000) ***. 0.0001. 0.0001. 0.0001. 0.0001. (0.498). (0.466). (0.469). (0.490). 0.0019. 0.0019. 0.0019. 0.0019. i n (0.492) C h(0.509) (0.632) engchi U 0.0019 0.0018 0.0018. (0.457). (0.446). (0.455). (0.450). (0.449). (0.468). 0.0403. 0.0390. 0.0309. 0.0393. 0.0388. (0.824). (0.830). (0.864). (0.828). -0.2516. -0.2622. -0.2631. (0.220). (0.202). (0.200). 0.0004. 0.0004. (0.280). (0.294) 0.0761. 0.0950. (0.182). (0.412). (0.729). (0.664). -0.0496. -0.0483. -0.0399. -0.0491. -0.0496. -0.0429. (0.313). (0.243). (0.257). (0.346). (0.250). (0.246). (0.309). -0.3495. -0.3491. -0.3379. -0.3416. -0.3633. -0.3644. -0.3501. (0.002) ***. (0.003) ***. (0.003) ***. (0.004) ***. (0.004) ***. (0.002) ***. (0.002) ***. (0.003) ***. 0.0346. 0.0346. 0.0347. 0.0348. 0.0346. 0.0345. 0.0345. (0.000) ***. (0.000) ***. (0.000) ***. (0.000) ***. (0.000) ***. (0.000) ***. 0.0001. 0.0001. 0.0001. 0.0001. (0.637). (0.487). (0.490). (0.496). (0.512). 0.0020. 0.0019. 0.0019. 0.0019. 0.0019. (0.474). (0.434). (0.445). (0.450). (0.443). (0.461). 0.0293. 0.0298. 0.0344. 0.0330. 0.0393. 0.0412. 0.0329. (0.830). (0.871). (0.869). (0.849). (0.855). (0.828). (0.820). (0.855). -0.2398. -0.2407. -0.2531. -0.2329. -0.2063. -0.2397. -0.2398. -0.2431. -0.2553. (0.243). (0.241). (0.217). (0.257). (0.317). (0.243). (0.243). (0.237). (0.213). (0.000) ***. al. 0.0001. 0.0001. 40. 0.0349. er. -0.0449. 12. y. TDER. (0.920). 11. sit. CASH. (0.379). 10. -0.1324. n. PRET. (0.421). Citwgtpat. -0.2276. io. AG. 0.0394. Nat. ROA. 0.0193. ‧ 國. BM. 0.1586. Citwgtpat. ‧. SIZE. 0.1465. 9. Citwgtpat. (0.082) *. 學. D. 立. at. Citavg. 0.0001. (0.000) ***. v0.0001.
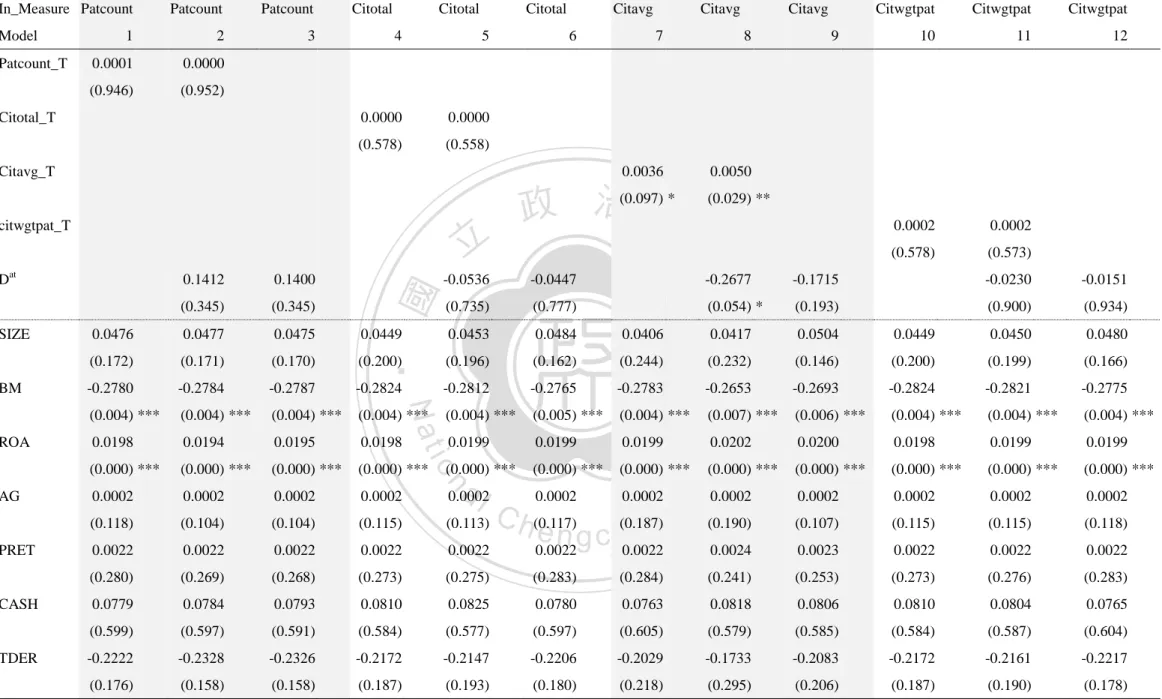
(42) Table 6.3 Relation between Innovation and Future Stock Performance under the event window of (+1, +60), estimated by OLS In_Measure Patcount Model Patcount_T. Patcount. Patcount. 1. 2. 3. 0.0001. 0.0000. (0.946). (0.952). Citotal_T. Citotal. Citotal. Citotal. 4. 5. 0.0000. 0.0000. (0.578). (0.558). Citavg 6. Citavg_T. Citavg 7. 8. 0.0036. 0.0050. 政 治 大 (0.097) *. citwgtpat_T. (0.777). 0.0477. 0.0475. 0.0449. 0.0453. 0.0484. (0.172). (0.171). (0.170). (0.200). (0.196). -0.2780. -0.2784. -0.2787. -0.2824. -0.2812. (0.004) ***. (0.004) ***. (0.004) ***. (0.004) ***. 0.0198. 0.0194. 0.0195. 0.0198. (0.000) ***. (0.000) ***. (0.000) ***. (0.000) ***. 0.0002. 0.0002. 0.0002. 0.0002. (0.118). (0.104). (0.104). (0.115). 0.0022. 0.0022. 0.0022. 0.0022. i n (0.113) C h (0.117) (0.187) engchi U 0.0022 0.0022 0.0022. (0.280). (0.269). (0.268). (0.273). (0.275). (0.283). 0.0779. 0.0784. 0.0793. 0.0810. 0.0825. (0.599). (0.597). (0.591). (0.584). -0.2222. -0.2328. -0.2326. (0.176). (0.158). (0.158). 0.0002. 0.0002. (0.578). (0.573) -0.0230. -0.0151. (0.054) *. (0.193). (0.900). (0.934). 0.0406. 0.0417. 0.0504. 0.0449. 0.0450. 0.0480. (0.162). (0.244). (0.232). (0.146). (0.200). (0.199). (0.166). -0.2765. -0.2783. -0.2653. -0.2693. -0.2824. -0.2821. -0.2775. (0.004) ***. (0.005) ***. (0.004) ***. (0.007) ***. (0.006) ***. (0.004) ***. (0.004) ***. (0.004) ***. 0.0199. 0.0199. 0.0199. 0.0200. 0.0198. 0.0199. 0.0199. (0.000) ***. (0.000) ***. (0.000) ***. (0.000) ***. (0.000) ***. (0.000) ***. 0.0002. 0.0002. 0.0002. 0.0002. (0.190). (0.107). (0.115). (0.115). (0.118). 0.0024. 0.0023. 0.0022. 0.0022. 0.0022. (0.284). (0.241). (0.253). (0.273). (0.276). (0.283). 0.0780. 0.0763. 0.0818. 0.0806. 0.0810. 0.0804. 0.0765. (0.577). (0.597). (0.605). (0.579). (0.585). (0.584). (0.587). (0.604). -0.2172. -0.2147. -0.2206. -0.2029. -0.1733. -0.2083. -0.2172. -0.2161. -0.2217. (0.187). (0.193). (0.180). (0.218). (0.295). (0.206). (0.187). (0.190). (0.178). (0.000) ***. al. 0.0002. 0.0002. 41. 0.0202. er. 0.0476. 12. y. TDER. (0.735). 11. sit. CASH. (0.345). 10. -0.1715. n. PRET. (0.345). Citwgtpat. -0.2677. io. AG. -0.0447. Nat. ROA. -0.0536. ‧ 國. BM. 0.1400. Citwgtpat. ‧. SIZE. 0.1412. 9. Citwgtpat. (0.029) **. 學. D. 立. at. Citavg. 0.0002. (0.000) ***. v0.0002.
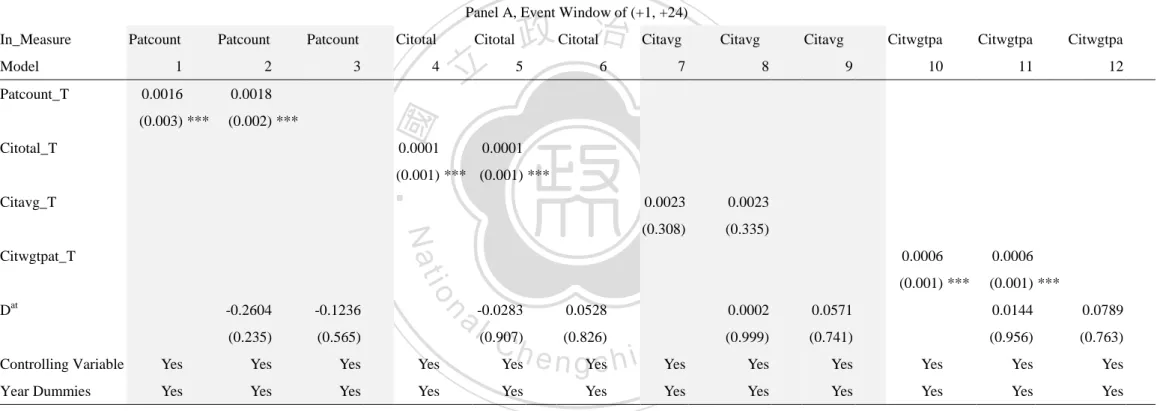
(43) In addition to OLS, I employ Weighted Least Squares (WLS) in my analysis with the acquirers’ inflation-adjusted size as the weights. As I mentioned in Section 1.1, R&D activities generally burn money. Firms with bigger size possess relatively fruitful resources. For a large acquirer, it is reasonable to suppose it enjoys abundant funds, integrated supply chain or even well-recognized brand name that enable the acquirer to take better advantages of the target’s innovation capacity. With regard to. 政 治 大. this, I use acquirers’ size before announcement (adjusted for inflation) as the weights. 立. in WLS procedure, granting larger weights for deals with large acquirers. In this part,. ‧ 國. 學. I only present the coefficients and p-values of innovation variables in Table 7, results. ‧. of the controlling variables are alike to those of OLS. The positive relation between. Nat. io. sit. y. innovation measures and abnormal return is once again confirmed by WLS procedure,. er. which reveals a set of all-positive coefficients. Besides, the outcome is similar to OLS. al. n. v i n C hhas significant influence procedure in that average citation e n g c h i U on abnormal return under the longest event window: (+1, +60). Further, the positive relation in other measures is proven to be evident. The positive coefficients of patent counts, total citations and citation-weighted patent counts are statistically significant. This provides an intriguing insight that innovation does interact positively with post-merger stock performance, especially for large acquirers.. 42.
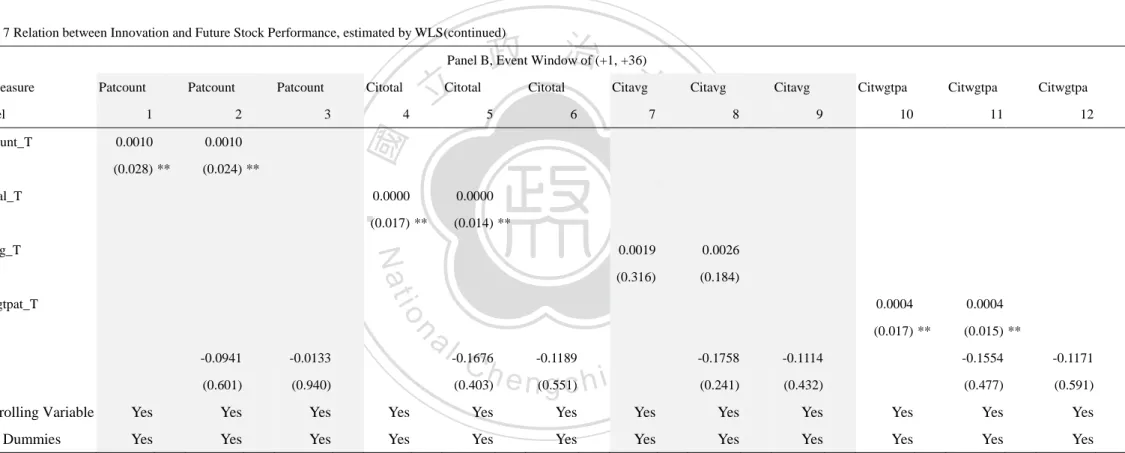
(44) Table 7 Relation between Innovation and Future Stock Performance, estimated by WLS Table 7 reports the cross-sectional regression estimates from regressing abnormal return (AR) on selected independent variables for 605 announcements of completed M&A deals. ARs are from the (+1, +24) event window. The period for this analysis runs from 1980 to 2006. Year fixed effects are included in all specifications. The p-values are reported in brackets. See section 3.1.2 and section 3.1.3 for variable definitions. *** denotes significance at 1% level; ** denotes significance at 5% level; *denotes significance at 10% level.. 政 治 大. Panel A, Event Window of (+1, +24). Model Patcount_T. Patcount. Patcount. Citotal. Citotal. 1. 2. 3. 4. 0.0016. 0.0018. (0.003) ***. (0.002) ***. 立. Citotal_T. 0.0001. Citotal. 5. Citavg. 6. Citavg. 7. 8. 0.0001. -0.1236. (0.235). (0.565). (0.308). (0.335). Controlling Variable. Yes. Yes. Yes. Yes. Year Dummies. Yes. Yes. Yes. Yes. Citwgtpa. Citwgtpa. 10. 11. 12. 0.0006. 0.0006. (0.001) ***. (0.001) ***. y. a l-0.0283 0.0528 iv (0.907) n C h (0.826) Yes e n gYes c h i UYes. n. -0.2604. Citwgtpa. 0.0023. er. io. D. at. 9. sit. Nat. Citwgtpat_T. 0.0023. ‧. (0.001) *** (0.001) ***. Citavg_T. Citavg. 學. Patcount. ‧ 國. In_Measure. Yes. Yes. 43. Yes. 0.0002. 0.0571. 0.0144. 0.0789. (0.999). (0.741). (0.956). (0.763). Yes. Yes. Yes. Yes. Yes. Yes. Yes. Yes. Yes. Yes.
(45) 政 治 大. Table 7 Relation between Innovation and Future Stock Performance, estimated by WLS(continued). Panel B, Event Window of (+1, +36). 2. 0.0010. 0.0010. (0.028) **. (0.024) **. 3. 立. Citotal. 4. 6. 0.0000. 0.0000. (0.017) **. (0.014) **. io. Citwgtpat_T. 7. (0.316). al. n. at. D. -0.0941. -0.0133. (0.601). (0.940). Citavg. Citavg 8. 0.0019. Nat. Citavg_T. 5. Citavg. Citwgtpa 9. Citwgtpa. 10. 11. 0.0004. 0.0004. (0.017) **. (0.015) **. Citwgtpa 12. ‧. Citotal_T. Citotal. 0.0026. y. 1. Citotal. (0.184). sit. Patcount. 學. Patcount_T. Patcount. er. Model. Patcount. ‧ 國. In_Measure. Ch. -0.1676. (0.403). -0.1189. e n(0.551) gchi U. v ni. -0.1758. -0.1114. -0.1554. -0.1171. (0.241). (0.432). (0.477). (0.591). Controlling Variable. Yes. Yes. Yes. Yes. Yes. Yes. Yes. Yes. Yes. Yes. Yes. Yes. Year Dummies. Yes. Yes. Yes. Yes. Yes. Yes. Yes. Yes. Yes. Yes. Yes. Yes. 44.
(46) Table 7 Relation between Innovation and Future Stock Performance, estimated by WLS(continued). 政 治 大. Panel C, Event window of (+1, +60). 2. 0.0005. 0.0006. (0.147). (0.100) *. 3. Citotal 4. 立. Citotal_T. 5. 0.0000. 0.0000. (0.125). (0.140). Citavg. 6. io. -0.1587. -0.1094. (0.272). (0.439). Controlling Variable. Yes. Yes. Yes. Yes. Year Dummies. Yes. Yes. Yes. Yes. Citavg 8. Citwgtpa 9. Citwgtpa. 10. 11. 0.0002. 0.0002. (0.125). (0.142). Citwgtpa 12. 0.0069. (0.000) ***. 0.0962 a l 0.0709 v (0.660) C h (0.549) U n i Yes e n gYes c h i Yes. n. Dat. 7. 0.0062. Nat. Citwgtpat_T. Citavg. ‧. Citavg_T. Citotal. 學. 1. Citotal. (0.000) ***. y. Patcount. sit. Patcount_T. Patcount. er. Model. Patcount. ‧ 國. In_Measure. Yes. Yes. 45. Yes. -0.1853. -0.0102. 0.1379. 0.1575. (0.119). (0.927). (0.437). (0.373). Yes. Yes. Yes. Yes. Yes. Yes. Yes. Yes. Yes. Yes.
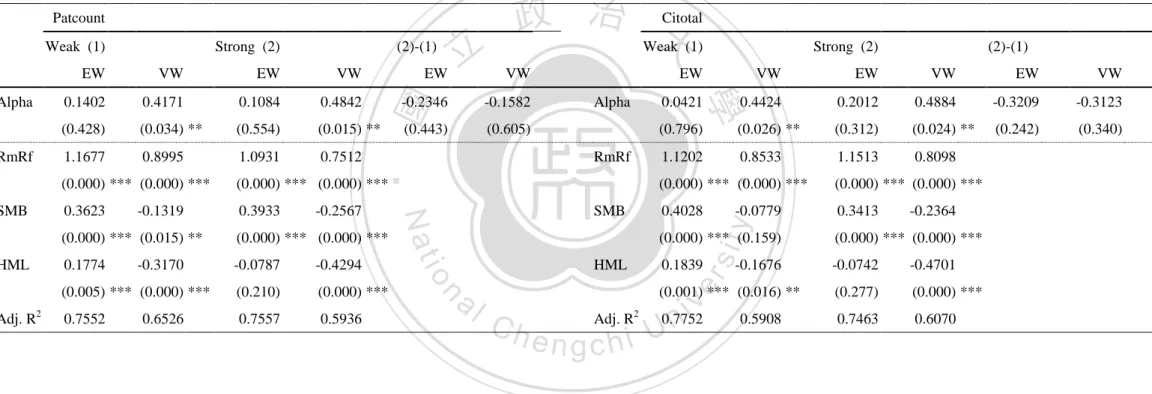
(47) 4.4. Calendar Time Portfolio. In the previous section, I show the strong long-term performance of acquirers bidding innovative target and further prove the significant relation between innovation and abnormal return. This section aims to provide practical insights in investment for the public investors. I want to study whether or not investing in. 政 治 大 calendar time portfolio. My 立investment horizon starts from January 1980, ends at. acquirers buying external innovation yields abnormal returns via employing. ‧ 國. 學. December 2006. I create a portfolio composed of acquirers making M&A. ‧. announcements during the past 24 months and re-form the portfolio month after. sit. y. Nat. month. The portfolio can be constructed with either 2 types of weights:. er. io. equally-weighted (EW) and value-weighted (VW). By comparing the time-series. al. n. v i n portfolio returns with expectedC returns estimated by Fama-French 3-factor model, hengchi U the significance of abnormal returns are examined. The result is reported in Table 8.. Based on prior section, I suppose that abnormal returns of strong-target groups being positive and outperform their respective matching groups. In the calendar time portfolio analysis, however, strong-target group do not indicate consistently positive abnormal returns under patent count, total citation count and citation-weighted patent count, nor do they reveal greater coefficient in magnitude. 46.
(48) On the other hand, there is one innovation measure strongly confirming my hypothesis: average citation, which presents positive and significant abnormal returns for the acquires bidding innovative targets at 1% level of significance. In contrast, the weak-target matching group commonly shows lower alpha in magnitude. Moreover, the strong-target EW portfolio yields superior performance relative to the weak-target peer at 10% level of significance, measured by the. 政 治 大. difference between abnormal returns; the difference is also positive for VW portfolio (though not significant).. 立 This phenomenon responds to the finding in previous. ‧ 國. 學. section that average citation positively relates to acquirers’ post-merger performance. ‧. under long-term horizon, and again confirms that average citations has close relation. Nat. n. al. er. io. sit. y. with M&A performance.. Ch. engchi. 47. i n U. v.
(49) Table 8 Abnormal returns estimated via calendar time portfolio approach Table 8 reports the time-series regression estimates from employing calendar time portfolio from 1980 to 2006. The p-values are reported in brackets. See section 3.1.2 and section 3.1.3 for variable definitions. *** denotes significance at 1% level; ** denotes significance at 5% level; *denotes significance at 10% level. Citotal. 0.1402. 0.4171. 0.1084. 0.4842. (0.428). (0.034) **. (0.554). (0.015) **. 1.1677. 0.8995. 1.0931. 0.7512. (0.000) *** (0.000) ***. (0.000) *** (0.000) ***. 0.3623. 0.3933. -0.1319. -0.2567. (0.000) *** (0.015) **. (0.000) *** (0.000) ***. 0.1774. -0.0787. -0.4294. (0.005) *** (0.000) ***. (0.210). (0.000) ***. 0.7552. 0.7557. 0.5936. -0.3170. 0.6526. VW. -0.2346. -0.1582. (0.443). (0.605). EW Alpha. RmRf. SMB. HML. al. Strong (2) EW. VW. EW. VW. 0.0421. 0.4424. 0.2012. 0.4884. -0.3209. -0.3123. (0.796). (0.026) **. (0.312). (0.024) **. (0.242). (0.340). 1.1202. 0.8533. 1.1513. 0.8098. (0.000) *** (0.000) ***. (0.000) *** (0.000) ***. 0.4028. 0.3413. -0.0779. (0.000) *** (0.000) ***. 0.1839. -0.0742. -0.4701. (0.277). (0.000) ***. 0.7463. 0.6070. iv Adj. R 0.7752 n Ch engchi U. 48. -0.2364. (0.000) *** (0.159) -0.1676. (0.001) *** (0.016) **. 2. (2)-(1). VW. y. EW. ‧ 國. VW. Weak (1). ‧. EW. n. Adj. R2. VW. io. HML. EW. 立. Nat. SMB. (2)-(1). 學. RmRf. Strong (2). er. Weak (1). Alpha. 政 治 大. sit. Patcount. 0.5908.
(50) Table 8 Abnormal returns estimated via calendar time portfolio approach (continued) Citavg. Citwgtpat. 0.0931. 0.5684. 0.5686. 0.5173. (0.053) *. (0.651). (0.006) *** (0.008) ***. 1.0783. 0.8680. 1.1888. 0.8415. (0.000) *** (0.000) ***. (0.000) *** (0.000) ***. 0.3777. 0.3695. -0.0782. -0.2381. (0.000) *** (0.176). (0.000) *** (0.000) ***. 0.3376. -0.2111. -0.1328. -0.4557. (0.000) *** (0.067) *. (0.003) *** (0.000) ***. 0.7340. 0.7671. 0.5683. 0.6237. 立. (0.097) *. 0.0516. Alpha. (0.890) RmRf. SMB. HML Adj. R2. n. al. Ch. engchi. 49. EW. VW. EW. VW. EW. VW. 0.0058. 0.4277. 0.1736. 0.5031. -0.3209. -0.3123. (0.973). (0.030) **. (0.373). (0.018) **. (0.242). (0.340). 0.8552. 1.1573. 0.8175. 1.1342. (0.000) *** (0.000) ***. (0.000) *** (0.000) ***. 0.4180. 0.3458. -0.0719. -0.2373. (0.000) *** (0.194). (0.000) *** (0.000) ***. 0.2312. -0.1208. -0.4686. (0.000) *** (0.018) **. (0.071) *. (0.000) ***. 0.7561. 0.7489. 0.5989. -0.1648. y. -0.3172. 政 治 大. VW. sit. EW. io. Adj. R2. VW. Nat. HML. EW. ‧. SMB. VW. (2)-(1). Strong (2). 學. RmRf. EW. Weak (1). ‧ 國. Alpha. (2)-(1). Strong (2). er. Weak (1). i n U. v. 0.5904.
(51) Chapter 5. Conclusion 5.1. Summary of the Study. In this research, I use a list of M&A transactions that took place in the US across industries. With the patent and citation data provided by NBER dataset, I shed lights on the relation between innovation level and the acquirers’ post-merger. 政 治 大. stock performance. In comparison with internally developed R&D investment,. 立. resorting M&A market as external source of innovation provides enterprises an. ‧ 國. 學. effective and flexible alternative. I argue that outsourcing innovation effectively. ‧. enhances innovation capacities and therefore raises stock performance. After. y. Nat. al. er. io. sit. grouping targets by innovation measures, I employ event study in long-term and. v. n. short-term perspectives, supposing acquirers bidding innovative targets enjoy positive abnormal returns.. Ch. engchi. i n U. Under short-term event period (no longer than 5 days after announcement), I find the abnormal returns of strong-target groups are still significantly negative. Nonetheless, it does not mean bidding innovative target yields underperformance relative to it peers. In fact, the two-sample t-test shows the difference is insignificant, suggesting the negative performance just coincides with prior study’s result that. 50.
(52) acquirers tend to underperform in general.. On the other hand, my long-term study focuses on post-event integration. Intriguingly, the result becomes quite consistent as I prolong my event period to longer than 24 months. The strong-target groups reveal positive and significant abnormal returns across all innovation metrics under 2-year, 3-year, and 5-year event windows. Afterward, I conduct multiple regression analysis via conducting both. 政 治 大. OLS and WLS procedures. The OLS result shows that only average citation has. 立. positive relation under the longest event window. In contrast, the result of WLS. ‧ 國. 學. shows much convincing numbers. I use the bidders’ inflation-adjusted size before. ‧. announcement as weights. The result of WLS not only confirms the positive. y. Nat. al. er. io. sit. influence of average citation on stock performance, it presents the positive relation. v. n. between other innovation metrics and abnormal returns as well, showing that. Ch. engchi. i n U. bidding innovative targets does benefit to acquirers, especially for acquirers that are large in size.. In the last part, I employ calendar time portfolio in order to see if “mergers for innovations” could be an idea for investment strategy. And the result also confirms average citation to be a practical filter for stock selection.. In conclusion, my study shows the relation between innovation and stock 51.
(53) performance could be observed on a long-run basis. The relation is proven to be positive, suggesting bidding innovation is a feasible mean to improve post-M&A performance, especially in the case of large acquirers. As to investment strategy, the average citation is proven to be a practical measure to select targets.. 5.2. Suggestions for Further Studies. 政 治 大. With globalization and development in technology, mergers for innovation are. 立. expected to increase year after year. Innovation-oriented M&A should be a valuable. ‧ 國. 學. realm for further research. There are several limitations in my study. The citation. ‧. data do not distinguish self-citation. Although self-citing might still be valuable, it. y. Nat. al. er. io. sit. might be concern that companies exaggerate their innovation competence by. n. self-citing. Also, I combine the M&A list with patent data by identifying each. Ch. engchi. i n U. v. patent’s assignee, this approach acts as a filter, dropping firms with no patents out of my sample. It is possible that my sample consists of relatively innovative firms. In addition, I use applied years as I recognize the innovation measures before mergers. However, the duration between applied date and grant date might be several years, the result might be different if I use grant date for matching.. In this paper, I focus on post-M&A stock performance of acquirers. However, long-term performance should be examined by stock performance as well as 52.
(54) operating result. If gain on market value reflects improvement in operation, then the positive announcement returns should be supported subsequently by outperformance in financial statements. Moreover, improvement in innovation efforts after merger could also be examined. NBER provides fruitful patent data, and the dataset is expected to cover more information with the development in technology and intellectual property. Therefore, I anticipate more insights could be unveiled in the future.. 立. 政 治 大. ‧. ‧ 國. 學. n. er. io. sit. y. Nat. al. Ch. engchi. 53. i n U. v.
(55) References Agrawal, Anup, and Jeffrey F. Jaffe, 2003, Do takeover targets underperform? Evidence from operating and stock returns. Journal of Financial and Quantitative Analysis 38, 721-746. Barber, Brad M., John D. Lyon, 1997, Detecting long-run abnormal stock returns: The empirical power and specification of test statistics. Journal of Financial Economics 43, 341-372. Bena, Jan, and Kai Li, 2011, Corporate innovations and mergers and acquisitions,. 政 治 大. Working paper, University of British Columbia.. 立. Brown, Stephen J., and Jerold B. Warner, 1980, Measuring security price performance,. 2003, Open innovation: The new imperative for creating and. ‧. ‧ 國. Chesbrough, Henry W.,. 學. Journal of Financial Economics 8, 205-258.. profiting from technology, Harvard Business School Press, Boston.. Nat. sit. y. Devos, Erik, Palani-Rajan Kadapakkam, and Srinivasan Krishnamurthy, 2009, How do. n. al. er. io. mergers create value? A comparison of taxes, market power, and efficiency. i n U. v. improvements as explanations for synergies, The Review of Financial Studies 22, 1179-1211.. Ch. engchi. Fama, Eugene F., 1997, Market efficiency, long-term returns, and behavioral Finance. Journal of Financial Economics 49, 283-306. Hagedoorn, John, and Geert Duysters, 2002, External sources of innovative capabilities: The preferences for strategic alliances or mergers and acquisitions, Journal of Management Studies 39, 167-188. Hagedoorn, John, and Geert Duysters, 2002, The effect of mergers and acquisitions on the technological performance of companies in a high-tech environment, Technology Analysis & Strategic Management 15, 67-85. 54.
數據

+6
相關文件
❖ The study group (including RS Department, Guidance Team and SENCO Team) at school analyzed the results and came up with the conclusion that students might be able to enhance
So the WiSee receiver computes the average energy in the positive and negative Doppler frequencies (other than the DC and the four frequency bins around it). If the ratio between
(B) The girl who having a book in her hand is my sister.. (C) The girl with a book in her hand is
Corollary 13.3. For, if C is simple and lies in D, the function f is analytic at each point interior to and on C; so we apply the Cauchy-Goursat theorem directly. On the other hand,
Corollary 13.3. For, if C is simple and lies in D, the function f is analytic at each point interior to and on C; so we apply the Cauchy-Goursat theorem directly. On the other hand,
On the other hand, the pre-Lunar New Year Sale on clothing, falling price in fresh pork and a waiver of welfare housing rentals by the Housing Institute for the first quarter of
Key words: theory of the nature of the mind, the Buddha nature, one who possesses a gotra, non-resultant activity which is neither positive nor negative and is able
The significant and positive abnormal returns are found on all sample in BCG Matrix quadrants.The cumulative abnormal returns of problem and cow quadrants are higher than dog and
