行政院國家科學委員會專題研究計畫 成果報告
台灣高競爭力科技發展策略之研究
計畫類別: 個別型計畫 計畫編號: NSC91-3013-P-009-001- 執行期間: 91 年 04 月 01 日至 92 年 10 月 31 日 執行單位: 國立交通大學科技管理研究中心 計畫主持人: 曾國雄 共同主持人: 左峻德 報告類型: 完整報告 報告附件: 國外研究心得報告 處理方式: 本計畫可公開查詢中 華 民 國 93 年 6 月 1 日
國家科學委員會專題研究計劃
台灣高競爭力科技發展策略之研究
MCDM Approach to Technology Development Strategies
for High Competitiveness of Taiwan
計劃主持人:曾國雄
執行單位:國立交通大學科技產業策略研究中心
台灣高競爭力科技發展策略之研究研究計畫中英文摘要
一、計畫中文摘要
科技發展策略的擬定與執行,前後有相當程度的時間落差且對未來影響深 遠,在瞬息萬變的市場競爭下,由於無法認知環境變遷要素為動態之變動狀態, 使科技發展策略之決策與動態環境變動狀態間出現時間落差,或難以預測,導 致原科技發展策略無法適時對應、效能降低。本計劃首先採用歐盟所提出的「創 新計分版」作為指標,以最適合的資料包絡分析(Data Envelopment Analysis, DEA)模式建構科技發展策略投入產出效率之分析模型,針對台灣科技發展策略 執行效率加以分析。第二部分根據層級分析法(Analysis Hierarchy Process, AHP) 的層級架構,針對國家創新系統建立多準則評估體系,本體系分為三層級 (Tri-Tiered):第一層為標的(Goal),為國家競爭力之提昇;第二層為層面 ( Aspects ), 為 國 家 創 新 系 統 之 八 個 分 析 觀 點 ; 第 三 層 為 目 標 / 準 則 (Objects/Criteria),為本計劃針對八個分析觀點中的細項進行分割型模糊積分 之多準則評估體系探討過去政府對 IC 產業引進、扶植等過程所施行的科技發展 策略群組是否有顯著的影響效果;計劃結果可作為政府制訂創新/技術政策參 考。 關鍵字:科技發展策略、國家創新系統、創新政策、創新計分版、資料包絡分 析、層級分析法二、計畫英文摘要
Decision making and practice of S&T policy are crucially for both government and private sectors, but they usually suffer from high volatility in dynamic environment of international competition. The first objective of this research is to propose the Data Envelopment Analysis model for efficiency measuring of Taiwan S&T policy.
The second objective of this research is to develop an empirically based framework for formulating and selecting Innovation Policy. The government is usually facing complex decision scenarios. Traditional decision making methods are failed to satisfy the government’s need in this regard. Thus, a hierarchy multi-criteria decision-making (MCDM) method for evaluating the Innovation Policy is proposed in this study. Finally, in order to show the practicality and usefulness of this model, an empirical study of Taiwan IC industry are demonstrated.
Key Words: S&T policy, National Innovation System, Innovation Policy, Innovation Scoreboard, Data Envelopment Analysis, Analysis Hierarchy Process.
計畫綱要
PART 1
Comparative Performance of Major OECD Member National
Innovation Systems: A Data Envelopment Analysis Approach
PART 2
The Innovation Policy Priorities in Industry Evolution: The
Case of Taiwan’s IC Industry
PART 3
Fuzzy Integral MCDM Approach for Evaluating the Effects of
Innovation Policies: The Case of IC Design Industry in
Taiwan
PART 4
Conclusions: Innovation Policy for Developing Competitive
Advantages of Taiwan IC industry
PART 1
Comparative Performance of Major
OECD Member National Innovation
Systems: A Data Envelopment Analysis
Comparative Performance of Major OECD
Member National Innovation Systems: A Data
Envelopment Analysis Approach
Abstract: Real difficulties occur in measuring and comparing technological
accumulation across firms, sectors and nations. National Innovation Systems (NIS)
performance is also difficult to measure. However, due to the growing demands
from public and private policy-makers for better information, progress has been
made in both NIS measurement and conceptualization. This paper attempts to shed
light on the economic theory regarding the performance of major OECD member
NISs by presenting comparative analyses based upon nation-level data for
1996-1997, measured using the Data Envelopment Analysis (DEA) approach. It is
possible to make useful international comparisons amongst OECD nations in
change-generating activities for the major NIS institutions.
Keywords: National innovation systems; Data envelopment analysis; Science and
technology policy; Performance measuring; Research and development.
1. Introduction
The last ten years have witnessed rapid economic development in Asia, and the
from globalization will force enterprises to face a higher level of global competition.
The related impacts from the computing explosion, communications and media
technologies convergence, and international deregulation, are reshaping the world
economy in a manner not seen at any time in history. There are three levels of global
competition, the firm level, the industrial level, and the national level. For advanced
nations, the competition among different nations rests in their educational systems,
R&D infrastructure, environmental and trade regulations, and macroeconomic and
microeconomic policies. The direct involvement of government in commercial
technology developments has not been the major policy focus for these advanced
nations.
For developing nations, to strengthen the global competitive advantage for
national firms and maintain stable economic growth for the nation, national
governments must develop effective economic and industrial policies to insure
sustained competitive advantage and continued economic growth. In addition to the
common macroeconomic and microeconomic policies, direct government
involvement in technological acquisitions and development is necessary. Science
and Technology (S&T) are now strategic resources to be deployed as effectively as
possible [1]. To achieve this goal, any S&T policy should be based on
policies of different nations exhibit certain common attributes [3].
The most important nation-specific frame conditions for any sectoral S&T
policies are the national institutional conditions for technological innovations. This
institutional infrastructure is often referred to as a “National Innovation System
(NIS)”. This term is defined as: “the network of institutions in the public and private
sectors whose activities and interactions initiate, modify and diffuse new
technologies” [4]. Since the studies by Freeman, several other studies on NIS have
been published (Lundvall, 1992; Nelson, 1993; Patel & Pavitt, 1994). All of these
studies tried to understand regional innovative capabilities in relation to the various
institutions that were present in the nations under study (Janszen & Degenaars,
1998).
Real difficulties occur in measuring and comparing technological accumulation
across firms, sectors and nations (Patel & Pavitt, 1994). As we have seen, the
activities that contribute to technological accumulation are complex and varied,
encompassing basic research in universities at one end of the spectrum, and routine
thinking in production, at the other. NIS performance is therefore also difficult to
measure. However, due to the growing demands from public and private
measurement and conceptualization. This paper attempts to shed light on the
economic theory involved major OECD member NISs by presenting a comparative
analyses based upon nation-level data for 1996-1997, measured using by Data
Envelopment Analysis (DEA). The DEA technique, first proposed by Charnes et al.
(1978), is now known as an evaluation technique for the performance analysis of
various entities, whose production activities are characterized by multiple inputs and
outputs (Sueyoshi et al., 1999). It is possible to make useful international
comparisons among OECD nations on the change-generating activities of the major
NIS institutions.
This paper is organized as follows. Section 2 describes, in detail, the NIS
concept, the elements of NIS and the variables used for their measurement. Section
3 summarizes the DEA technique. Section 4 applies the DEA technique to evaluate
the performance of major OECD member NISs based upon nation-level data for
1996-1997. The conclusion is documented in Section 5.
2. National Innovation Systems
2. 1 National Innovation Systems Concept
The conceptual development of a national innovation system, sector, or
technologically advanced scholars that adhered to an evolutionary theory of
economic growth (Freeman, 1988; Lundvall, 1988, 1992; Nelson, 1988, 1993;
Carlsson, 1995; Edquist, 1997; Mowery & Nelson, 1999). These scholars
emphasized interactive learning between knowledge producers and users in
generating innovations and the role of the nation state in this process. They also
argued that an institutional framework plays an important role for interactive
learning that leads to innovations.
There are several definitions of the “NIS” concept. As Lundvall (1992)
illustrated, there is a broad definition, that encompasses all interrelated institutional
actors that generate, diffuse and exploit innovations, but also a narrow definition,
that includes organizations and institutions involved in searching and exploring, e.g.
R&D departments, technical institutes and universities.
Having developed historically, NISs vary and should indeed vary greatly from
one nation to another (Ergas, 1987). Lundvall (1992) assumes that basic differences
in historical experience, language and culture will be reflected in five important
factors in each NIS:
a. The way in which firms are organized can have important consequences for the
learning process. All of these factors can affect the innovative capability of
firms.
b. Inter-firm cooperation is the second important factor. This takes a variety of
forms including user-producer interactions; network relationships in industrial
districts which facilitate the informal exchange of technical know-how; and
various forms of cooperation that are becoming increasingly important in
knowledge-intensive industries.
c. The public sector as a competent user of innovations; and as formulator of the
regulations and standards, which influence the rate and direction of innovation.
d. The institutional set-up of the financial sector, which finances innovation. This is
significant because investments in innovation imply more uncertainty than
ordinary investments, and involve a longer learning process for consumption and
production than for known products.
e. The resources, competencies and organization of the R&D system. This includes
public sector research directly funded by government (in universities and
government laboratories), as well as industrial research carried out by firms and
All of these factors give rise to a certain institutional structure. In aspects more
closely related to what is actually called the innovation systems, the previously
stated characteristics can be seen, for instance, in the way firms are organized, the
way firms deal with one another, the public sector’s role and the way in which S&T
and R&D systems are organized (Cooke et al., 1997).
2. 2 Elements of National Innovation Systems
Our analysis embraces a cross-nation approach to evaluating the performance
of major OECD member NISs. To this effect, the various NIS elements are
organized into three groups: inputs, moderators, and outputs (Naierowski & Arcelus,
1999).
a. Inputs: As with any other sector of the economy, the inputs, directly responsible
for the present and future development of a nation’s NIS, are labor and capital.
The first relates to the sources of technology and the potential for each nation to
develop NIS by itself, to acquire it from abroad or to involve private industry in
this endeavor. The second reflects the state of the human component of R&D.
This is accomplished by assessing:
i. The current state of the human contribution to NIS through an analysis of
ii. Each nation’s current state of involvement in the development of future
human resources (Dahlman, 1994), as consumers and developers of
technology, through the level of investment in future human capabilities.
b. Moderators: Nationwide in nature, representing elements of the nation’s
socio-economic structure impacting the relationship between the inputs and
outputs. The elements embrace the accumulated S&T capability, cultural
characteristics, patterns of technological development, and size, in terms of
people or economic wealth.
c. Outputs: The NIS ultimate contribution to the national economy, namely its
output toward technological progress via increase in productivity. Three sets of
outputs might be identified, denoted by solutions, knowledge base and
productivity. Solutions consist of various types of patent counts, widely used in
spite of their potential pitfalls (Pavitt, 1985), as a manifestation of relatively
short-term R&D strategies aimed at “investment in solution” (Basberg, 1987).
Such strategies reflect the R&D involvement of the world community in each
nation, as well as national efforts in their own nation and abroad. The
“knowledge base” evaluation is more long term (FMS, 1989) in nature and deals
and citations counts, which can be used as indicators of NIS output. The third
output, productivity, represents the effect of technology development strategies
on the economic base of a nation. Technology efforts are expected to lead to
improvements in the economy (Porter, 1990; Maital et al., 1994).
3. Data envelopment analysis
DEA, as developed by Charnes et al. (1978) and extended by Banker et al.
(1984) is a technique for measuring the relative performance of decision making
units (DMUs) on the basis of the observed operating practice in a sample
comparable DMUs. DEA has usually been applied to analyzing the relative
productive efficiency of DMUs in multiple incommensurate input variable and
multiple incommensurate output variable settings (Post & Spronk, 1999).
3. 1 Data envelopment analysis models
The performance measurement of major OECD members’ NIS was calculated
using various DEA models in this study. These models are detailed in Appendix A.
The following models and their efficiency scores for each nation were calculated.
a. Simple efficiency (Charnes et al., 1978 [CCR]; Banker et al., 1984 [BCC]) refers
to efficiency scores (technical and scale efficiencies) calculated using the basic
b. Ranked efficiency (RCCR) (Andersen and Petersen, 1993) is the efficiency score
calculated by the reduced CCR model for each nation.
3. 2 Strengths and shortcoming of Data envelopment analysis
When applying the DEA technique to the performance measurement for various
entities, the following methodological strengths and shortcomings were considered.
a. Strengths
i. DEA can incorporate important features related to NIS elements (e.g.,
Total number of researchers, number of patents and gross domestic
expenditure on R&D) into its analytical framework;
ii. The NIS contribution must be evaluated using NIS multiple- objectives.
b. Shortcomings
i. DEA may often produce many efficient DMUs although we searched for a
single DMU as the best performer.
DEA has become a popular technique for evaluating the relative efficiencies of
DMUs within a relatively homogenous set. This study represents one of the more
for additional insight and determines the consistency of the result.
4. Performance evaluation of major OECD members’ NISs
4. 1 Data collection
The data for the DEA models included both input and out factors. The input
used to evaluate the performance of the NIS consisted of five factors: Gross
domestic expenditure on R&D, degree of involvement in R&D by the private
business sector, total number of researchers, total education expenditure as a
percentage of GDP and inward direct investment flows. The outputs were comprised
of the number of national patent applications, the number of patents granted by the
U.S. Patent and Trademark Office, number of citations received by scientific
publications, number of scientific publications, and productivity growth-trend
growth in GDP per hour worked. All of these inputs and outputs are characterized
and summarized in Table 1.
To consider the consistency of the nation-level data, we attempted to evaluate
the performance of 23 member NISs under the OECD for 1996-1997. A good
rule-of-thumb in applying DEA involves including a minimum set of data points in
the evaluation set (e.g., the number of inputs multiplied by the number of outputs,
units. In our study with a total of five input and five output factors, a good minimum
set was 20 data points. We have 46 data points. Table 2 is composed of descriptive
statistics that includes the means and standard deviations for each of the input and
output factors for each of 2 years examine in this study.
4. 2 Empirical results
We conducted a major OECD members’ data evaluation that included the
overall average, technical and scale efficiency analysis and a brief evaluation of the
nation rankings.
The CCR and BCC efficiency results are shown in Table 3. At least 19 different
nations were considered technically-or scale-efficient in at least 1 of the 2 years
under consideration. Seven nations were efficient for entire 2 years. The NIS
performance or competitiveness was evaluated through analysis of the average
efficiencies. The average efficiencies from the CCR and BCC model increased
during 1996 and 1997. The differences in average CCR and BCC efficiency scores
point to some varying returns to scale in the data set. That is, the relationships
among the input and output values depended upon the magnitude of the data set. The
A&P model results were consistent with the CCR and BCC models. The A&P model
percentage of efficient nations and average efficiency scores mean that the major
OECD member nation NISs operations were becoming more efficient and
competitive. Yet, with less than half of the nations in this sample still not obtaining
an efficiency score equal to 1, there is ample room to increase their efficiency.
Table 4 represents the scale efficiency results. Nearly 73.91% of the examined
nations were scale efficient, with an average scale efficiency score of 0.9160 in 1996.
Nearly 86.96% were scale efficient, with an average scale efficiency score of 0.9552
in 1997. There was an upward trend in both percentage of efficient nations and
average scale efficiency scores. The scale category returns for IRS, CRS and DRS
were 6, 17, and 0 nations in 1996. The scores were 3, 20, and 0 nations in 1997.
Using the A&P ranking model, the most efficient nations for the two years were
Finland, U.S, Ireland, Norway, and Switzerland (appearing in the top eight ranks for
two years in the A&P model). The least efficient nations included Mexico, Spain,
Italy, Austria, Canada, and Hungary (appearing in the bottom eight ranks for two
years in the A&P model). The efficiencies (or inefficiencies) and rankings may be
due to circumstances beyond the nations’ S&T operations management policy.
4. 3 Discussions
NIS, that nation would be Ireland. In the 1990s the Irish, in part by joining the
European Union and in part on their own, removed restrictions on trade,
immigration, and commercial activity. They also invested in communications
networks and telecommunications infrastructure, without dictating how that
infrastructure should be used. The Irish Industrial Development Agency has
introduced a maximum 12.5 % corporate tax rate for all business activities,
including e-commerce, signaling a future for stable and acceptable tax rates. The
Irish took advantage of the time zone difference between the U.S and Dublin. It has
become the electronic hub (e-hub) for the new “Euro land.” (Ohmae, 2000)
In contrast, Spain has suffered from late industrialization and companies have
operated within a protected market for a long time. Spanish firms are usually small
and focused on traditional sectors compared to the European companies. Spanish
companies have faced a less stimulating environment with a smaller demand for
goods and services with high technological content. Furthermore, only 11% of the
Spanish firms were innovative. The R&D expenses of companies accounted for
0.4% of the Spanish GDP while in Europe it is about 1.2%. Only 25% of the
innovative firms developed R&D activities internally. However, these firms do not
usually cooperate with the public sector or other companies. The public system in
80% of Spanish researchers belong to the public sector. This number falls to 50% in
other European nations. Spain lags behind the rest of the European nations in
innovation.
5. Conclusions
The NIS performance evaluation is important for public and private
policy-makers. This paper attempted to shed light on the economic theory behind the
performance of major OECD member NISs by presenting a comparative analysis
based on nation-level data for 1996-1997, measured using the Data Envelopment
Analysis (DEA) approach. Various DEA models provide diverse and complementary
insights into evaluating the overall efficiencies and factors that may influence NIS
efficiency. The results showed that the overall mean efficiencies and scale
efficiencies of major OECD member NISs increased during 1996 and 1997. This
confirms the notion of increasing competitiveness and improving S&T resource
utilization by many nations. The most efficient nations during this two-year study
were Finland, the U.S., Ireland, Norway, and Switzerland..
The DEA technique and data used in this study had a number of limitations.
The first is the bias toward larger nations. Although this bias is not necessarily bad
characteristics, our generalization of the results to smaller nations must be evaluated.
In addition, data variations in the input and output sample might provide varying
results. The data variables selected were not exhaustive.
This paper makes a number of contributions. It provides some initial analysis
on NIS performance, an economic view of NIS and identifies factors that may
influence the NIS input and output. There are several areas worthy of future
consideration. A nation’s social and political characteristics may impact NIS
performance. Why Finland, the U.S., Ireland, Norway, and Switzerland are much
more efficient, and why Mexico, Spain, Italy, Austria, Canada, and Hungary are
inefficient should be discussed further. This paper proposed a technique for
evaluating NIS performance. This research could be used as a guide for public and
private policy-makers to conduct additional investigations into improving their S&T
Table 1
Input (I), Output (O) variables measuring the NIS elements
Type Variables Name Descriptions Data source
I GERD Gross domestic expenditure on R&D A measure of R&D expenditures incurred within a given country during a given period
OECD, Main Science and
Technology Indicators, Nov. 2001 I BRD Degree of involvement in R&D by the
private business sector
Ratio of business-to-government expenditures on R&D OECD, Main Science and Technology Indicators, Nov. 2001
I TR Total researchers (FTE) A measure of a nation’s state of involvement in R&D OECD, Main Science and
Technology Indicators, Nov. 2001 I EDU Total education expenditure as a
percentage of GDP
A measure of the investment in a nation’s human resource UNESCO, 2001 I IDI Inward direct investment flows (Billions of
US Dollars)
A measure of the increasing importance of foreign sources of technology in the composition of a nation’s NIS
OECD, Science, Technology and Industry Scoreboard , 2001 O NPA National patent applications A measure of the combined effort of the local and international
community in the nation’s “investment in solutions”
OECD, Main Science and Technology Indicators, 1999 O PAUS Patents granted in USP A measure of the excellence and important of the innovation TAF Special Report All Patents, All
Types Jan. 1977-Dec. 2001 O CIT Number of citations received by scientific
publications
A measure of the perceived (by others) quality of a nation’s create the “knowledge base”
Institute for Scientific Information, NSIOD 1981-1999
O PUB Number of scientific publications A measure of the nation’s ability to create the “knowledge base” Institute for Scientific Information, NSIOD 1981-1999
O PRO Productivity growth-trend growth in GDP per hour worked
A measure of the effect of technology development strategies on the economic base of a nation
OECD, Science, Technology and Industry Scoreboard, 2001
Table 2
Descriptive statistics for 23 nation samples
1996 1997
Type Variables Name
Mean SD Mean SD
I GERD Gross domestic expenditure on R&D
20183.491 43040.600 21331.731 46153.654
I BRD Degree of involvement in R&D by the private business sector
1.572 0.987 1.658 0.992
I TR Total researchers (FTE) 121203.261 229147.571 128827.217 251581.269
I EDU Total education expenditure as a percentage of GDP
5.797 0.799 5.671 0.814
I IDI Inward direct investment flows (Billions of US Dollars)
10.139 17.527 12.287 21.891
O NPA National patent applications 82969.783 81050.689 97315.217 82036.984
O PAUS Patents granted in USP 5121.565 14889.220 5208.957 14985.301
O CIT Number of citations received by scientific publications
201634.348 418550.353 139230.826 279438.861
O PUB Number of scientific publications 29034.000 52750.731 29814.217 52122.994
O PRO Productivity growth-trend growth in GDP per hour worked
Table 3 DEA results Nation [DMU] CCR [1996] CCR [1997] BCC [1996] BCC [1997] A&P [1996] A&P [1997] Australia 0.1378 0.8575 1 0.8575 1.0001 (10) 0.8575 (18) Austria 0.7250 0.7956 1 0.8005 0.7242 (19) 0.7956 (19) Belgium 1 1 1 1 1.1435 (9) 1.1425 (10) Canada 0.9611 0.9271 0.9611 0.9271 0.9611 (16) 0.9271 (17) Denmark 0.8027 1 1 1 0.8027 (18) 1.0513 (13) Finland 1 1 1 1 1.5481 (1) 1.5454 (3) France 0.7242 1 1 1 1.1686 (8) 1.0095 (15) Germany 0.9881 1 0.9881 1 0.9881 (12) 1.0246 (14) Hungary 0.7091 0.7460 0.7091 0.7460 0.7091 (20) 0.7460 (20) Italy 0.6742 0.6798 0.6742 0.6798 0.6742 (7) 0.6798 (1) Ireland 1 1 1 1 1.1873 (21) 2.5446 (21) Japan 0.9977 1 0.9977 1 0.9977 (11) 1.4198 (5) Korea 0.7127 1 1 1 1.2614 (5) 1.2000 (9) Mexico 0.5803 0.4496 0.5803 0.4496 0.5803 (23) 0.4996 (23) Netherlands 1 0.2899 1 0.6726 0.9875 (13) 1.0676 (12) New Zealand 0.9649 0.9613 1 0.9613 0.9649 (15) 1.2153 (6) Norway 1 1 1 1 1.4566 (4) 1.2053 (8) Poland 1 1 1 1 1.4827 (3) 0.6726 (22) Spain 0.6290 0.5454 0.6290 1 0.6290 (22) 0.9613 (16) Sweden 0.8247 1 0.8247 1 0.8247 (17) 1.1079 (11) Switzerland 1 1 1 1 1.2098 (6) 1.2116 (7) U.K 0.9845 1 0.9845 1 0.9845 (14) 1.4616 (4) U.S 1 1 1 1 1.5122 (2) 1.6178 (2) Average efficiency 0.8442 0.8805 0.9282 0.9171 1.0347 1.1289 Percent efficient (%) 34.7826 60.8696 60.8696 65.2174 -- -- ( ): Nations’ ranking under A&P model.
Table 4
Scale efficiency of major OECD member’s NIS for the period 1996-1997 Nation [DMU] Scale efficiency
[1996] Scale efficiency [1997] RTS [1996] RTS [1997] Australia 0.1378 1 IRS CRS
Austria 0.7250 0.9939 IRS IRS
Belgium 1 1 CRS CRS Canada 1 1 CRS CRS Denmark 0.8027 1 IRS CRS Finland 1 1 CRS CRS France 0.7242 1 IRS CRS Germany 1 1 CRS CRS Hungary 1 1 CRS CRS Italy 1 1 CRS CRS Ireland 1 1 CRS CRS Japan 1 1 CRS CRS Korea 0.7127 1 IRS CRS Mexico 1 1 CRS CRS Netherlands 1 0.4309 CRS IRS
New Zealand 0.9650 1 IRS CRS
Norway 1 1 CRS CRS Poland 1 1 CRS CRS Spain 1 0.5454 CRS IRS Sweden 1 1 CRS CRS Switzerland 1 1 CRS CRS U.K 1 1 CRS CRS U.S 1 1 CRS CRS Average efficiency 0.9160 0.9552 -- -- Percent efficient (%) 73.91 86.96 -- --
Appendix A. Data envelopment analysis models
This section provides a review of basic DEA and some cross-efficiency and ranking
A. 1 CCR and BCC models
Productivity models were traditionally used to measure the efficiency of systems.
Typically, DEA productivity models for a given DMU use ratios based on the amount of
output per given set of inputs. In this case, a DMU is a nation. DEA allows for the
simultaneous analysis of multiple inputs to multiple outputs, a multi-factor productivity
approach. Using the notation of Doyle and Green (1994), the general efficiency measure used
by DEA is best summarized by Eq. (A1).
∑
∑
= x kx sx y ky sy ks u I v O E (A1)where E is the efficiency or productivity measure of nation s, using the weights of test ks
nation k; Osy is the value of output y for nation s; Isx is the value for input x of nation s;
ky
v is the weight assigned to nation k for output y; and ukx is the weight assigned to nation
k for input x.
In the basic DEA ratio model developed by Charnes et al. (1978) (CCR model), the
objective was to maximize the efficiency value for a test nation k from among a reference set
of nation s, by selecting the optimal weights associated with the input and output measures.
Max
∑
∑
= x kx kx y ky ky kk u I v O Esubject to:Eks ≤1 ∀ Nations s (A2)
ks
u , vky ≥0
This nonlinear programming Eq. (A2) is equivalent to Eq. (A3) (Charnes et al. 1978):
Max =
∑
y ky ky kk O v Esubject to:Eks ≤1 ∀ Nations s (A3)
∑
= x kx kxu I 1 kx u , 0vky ≥The transformation is completed by constraining the efficiency ratio denominator from Eq. (A2) to a value of 1, represented by the constraint
∑
=x
kx kxu
I 1 . The Eq. (A3) result is an
optimal simple or technical efficiency value (E ) that is at most equal to 1. If kk* Ekk* =1, then no other nation is more efficient than nation k for its selected weights. That is, Ekk* =1 has nation k on the optimal frontier and is not dominated by any other nation. If Ekk* ≤1, then nation k does not lie on the optimal frontier and there is at least one other nation that is more
efficient for the optimal set of weights determined by (A3). Eq. (A3) is executed s times,
simple efficiency.
The dual of the CCR formulation is represented by Eq. (A4):
min θ (A4) subject to: 0 ≤ −
∑
sx s sx sIθ
Iλ
∀ Inputs I 0 ≥ −∑
s ky sy sO Oλ
∀ Outputs O 0 ≥ sλ
∀ Nations sthe CCR model has an assumption of constant returns to scale for the inputs and outputs. To
take into consideration variable returns to scale, a model introduced by Banker et al. (1984)
(BCC) is utilized. The BCC model aids in determining the scale efficiency of a set of units
(which is a technically efficient unit for the variable returns to scale model). This new model
has an additional convexity constraint defined by limiting the summation of the multiplier
weights (λ) equal to 1, or:
1 =
∑
s sλ
(A5)the using the CCR and BCC models together helps determine the overall technical and scale
A. 2 A&P models
A DEA-ranking model is a variation of the CCR model proposed by Andersen and
Petersen (1993). In this model, the test unit is eliminated from the constraint set. The new
formulation is represented by (A6).
Max =
∑
y ky ky kk O v Esubject to:Eks ≤1 ∀ Nations s≠k (A6)
∑
= x kx kxu I 1 kx u , 0vky ≥Eq. (A6), which we call the reduced CCR (RCCR) formulation, allows for technically
efficient scores to be greater than 1. This result allows for a more discriminating set of scores
for technically efficient units and thus can be used for ranking purposes.
References
Martin, B. R., Johnston, R. (1999) Technology foresight for wiring up the national innovation system: experiences in Britain, Australia, and New Zealand, Technological Forecasting and Social Change, 60, 37-54.
Chung, S., Lay, G. (1997) Technology policy between ‘diversity’ and ‘one best practice’ –a comparison of Korean and German promotion schemes for new production technologies, Technovation, 17(11/12), 675-693.
seven industrial countries, Elsevier Science Publishers, Amsterdam.
Andersen, P., Petersen, N. C. (1993) A procedure for ranking efficient units in data envelopment analysis, Management Science, 39, 1261-1264.
Banker, R. D., Charnes, A., Cooper, W. W. (1984) Some models for estimating technical and scale inefficiencies in data envelopment analysis, Management Science, 30, 1078-1092.
Banker, R. D., Morey, R. C. (1986) The use of categorical variables in data envelopment analysis, Management Science, 12, 1613-1627.
Basberg, B. L. (1987) Patents and the measurement of technological change: a survey of the literature, Research Policy, 16, 131-141.
Ben R. Martin, Ron Johnston (1999) Technology foresight for wiring up the National Innovation System experiences in Britain, Australia, and New Zealand, Technological Forecasting and Social Change, 60, 37-54.
Boussofiane, A., Dyson, R. G., Thanassoulis, E., (1991) Applied data envelopment analysis, European Journal of Operational Research, 52, 1-15.
Carlsson, B. (1995) Technological systems and economic performance: the case of factory automation, Kluwer Academic Publishers, Dordrecht.
Charnes, A., Cooper, W. W., Rhodes, E. (1978) Measuring the efficiency of decision making units, European Journal of Operational Research, 2, 429-444.
Cook, W. D., Kress, M., Seiford, L. M. (1996) Data envelopment analysis in the presence of both quantitative and qualitative factors, Journal of Operation Research, 47, 945-953.
Cooke, P., Uranga, M. G., Etxebarria, G. (1997) Regional innovation systems: institutional and organizational dimensions, Research Policy, 26, 475-491.
Dahlman, C. J. (1994) Technology strategy in East Asian developing countries, Journal of Asian Economics, 5, 541-572.
Doyle, J., Green. R. (1994) Efficiency and cross-efficiency in DEA: derivations, meanings and uses, Journal of the Operational Research Society, 45, 567-578.
Edquist, C. (1997) Systems of innovation: institutions and organizations, Pinter Publishers, London.
Ergas, H. (1987) The importance of technology policy. In: Dasgupta, P., Stoneman, P. (Eds.), Economic Policy and Technological Performance, pp. 51-96, Cambridge University Press, Cambridge.
Frascati Manual Supplement (1989) The measurement of scientific and technical activities, R&D statistics and output measurement in the higher education sector, OECD, Parsi.
Freeman, C., (1987) Technology policy and economic performance: lessons from Japan, Pinter Publishers, London.
Freeman, C., (1988) Japan: a new national system of innovation? Technical Change and Economic Theory, Pinter Publishers, London.
Golany, B., Roll, Y. (1994) Incorporating standards via DEA. In: Charnes, A., Cooper, W. W., Lewin, A. Y., Seiford, L. M. (Eds.), Data enveloping analysis: theory, methodology and applications, Kluwer Academic Publishers, Dordrecht, 313-328.
Janszen, F. H. A., Degenaars G. H. (1998) A dynamic analysis of the relations between the structure and the process of national systems of innovation using computer simulation; the case of the Dutch biotechnological sector, Research Policy, 27, 37-54.
Lundvall, B. A. (1988) Innovation as an interactive process: from user-producer interaction to the national system of innovation, Technical Change and Economic Theory, Pinter Publishers, London.
Lundvall, B. A. (Ed.) (1992) National systems of innovation: towards a theory of innovation and interactive learning, Pinter Publishers, London.
Maital, S., Frankel, A., Grupp, H., Kochatzky, K. (1994) Relation between scientific and technological excellence and export performance: theoretical model and empirical test for EC countries, Science and Public Policy, June, 138-146.
Mowery, D., Nelson, R. R. (1999) The sources of industrial leadership, Cambridge University Press, Cambridge.
Nasierowski, W., Arcelus, F. J. (1999) Interrelationships among the elements of national innovation systems: A statistical evaluation, European Journal of Operational Research, 119, 235-253.
Nelson, R. R. (1988) Institutions supporting technical change in the United States, Technical Change and Economic Theory, Pinter Publishers, London.
Nelson, R. R. (Ed.) (1993) National innovation of systems: a comparative analysis, Oxford University Press, New York and Oxford.
OECD (2001) Main science and technology indicators, OECD, Paris.
OECD (1999) Main science and technology indicators, OECD, Paris.
OECD (2001) OECD science, technology and industry scoreboard, OECD, Paris.
Ohmae K. (2000) The invisible continent: four strategic imperatives of the new economy, Nicholas Brealey Publishing, London.
Patel, P., Pavitt, K. (1994) The nature and economic importance of national innovations systems, STI Review (OECD, Paris), 9-32.
Patel, P., Pavitt, K. (1994) National innovation systems: why they are importance, and how they might be measured and compared, Economic Innovation and New Technologies, 3, 77-95.
Pavitt, K. (1985) Patent statistics as indicators of innovative activities possibilities and problems, Scientometrics, 7, 77-99.
Petersen, N. C. (1990) Data envelopment analysis on a relaxed set of assumptions, Management Science, 36 (3), 305-314.
Porter, M. (1990) Competitive advantage of nations, Free Press, New York.
Post, T., Spronk, J. (1999) Performance benchmarking using interactive data envelopment analysis, European Journal of Operational Research, 115, 472-487.
Sueyoshi, T., Ohnishi, K., Kinase, Y. (1999) A benchmark approach for baseball evaluation, European Journal of Operational Research, 115, 429-448.
TAF (2002) Technology assessment and forecast special report: all patents, all types 1/1977-12/31/2001, U.S. Patent and Trademark Office, Washington, DC.
PART 2
The Innovation Policy Priorities in Industry
Evolution: The Case of Taiwan’s IC Industry
The Innovation Policy Priorities in Industry
Evolution: The Case of Taiwan’s IC Industry
Abstract: This paper explores the innovation policy priorities in industrial evolution. This
issue has not been discussed in most of the literature. Taiwan has devoted considerable resources to the IC industry. Resources have been aimed at promoting research and development-based industrial activity and economic growth. This paper chose the Taiwan IC industry for an empirical study on the innovation policy priorities in industry evolution. Many of the policy tools for innovation were found different in the four phases. An ‘Environment side’ policy was exhibited as vital for the initial phase of industry evolution. Government involvement in the later phase of industry evolution is not necessary. However, to maintain domestic technology capacity, the government should focus its industrial development strategy onto innovation for the next generation technological R&D. ‘Environment side’ policy should play a vital actor once again. In the above shifting pattern, policy establishments were pulled by the industry needs for evolution.
Keywords: Innovation policy; industry evolution; policy priorities; IC industry.
1. Introduction
Schumpeter Dynamics pointed to new technology as a future omnipotent panacea. To be
able to continue ‘business as usual’, new technology is an indispensable element that could
also contribute to the self-destruction of businesses [1]. Theoretically, innovation is the
engine for national technological development. However, innovation has excessively high
Public policy, in turn, provides direction and coordination to the National system of
innovation [3-5]. The public role has the following aspects: it provides infrastructure in fields
like education, technology transfer, incubators, and so on. It should act as a large-scale buyer
of innovative products and services in the public sector (e.g., energy, traffic systems, city
renewal, defense, and health care). It promotes prestigious projects like high-energy,
astro-physics, manned space flight, and so on [1].
Innovation policy includes science and technology (S&T) and industry policy [2]. There
are significant differences among countries, according to the individual national policy style
[6]. Innovation policy research has been discussed in several nations (e.g., [2, 7-11]). The
other stream involves cross-national perspectives on innovation policy (e.g., [12, 13]). Many
of the determinants are more different across nations than within a nation. Government policy,
legal rules, capital market conditions, factor costs, and many other attributes make these
differences important.
Limited resources, coupled with seemingly unlimited demand for development, means
that policies must be made regarding the allocation of scarce resources. During the past
decades governments sought more ways of transparently dealing with the problem of scarcity.
The public was given a role in determining priorities [14]. While the need for priority setting
in the context of limited resources is not questioned, there are both theoretical and practical
cost-effectiveness, cost-benefit, and disease analysis burden differ in their methodologies.
However, each uses what is considered relevant data (e.g., epidemiological or economic
evidence) to determine priority [15].
Industry life cycle and shakeout theories provide the theoretical foundations for how an
industry typically evolves from an early ‘fluid’ state into one that is highly specific and rigid
[16]. It is well recognized that the magnitude and rapidity at which industry evolution can
occur depends partly on the industry’s technological opportunities. In this perspective, these
opportunities are themselves usually a lagged function of breakthroughs in science and
technology [17]. However, industry evolution might depend on a wide range of factors
besides technological development and opportunities. It also depends strongly on the
interaction between education, knowledge diffusion, structural flexibility, innovation, and
competition [18, 19]. For developing nations, to strengthen their global competitive
advantages for industries and maintain stable economic growth for the nation, governments
must develop effective innovation policies to insure sustained competitive advantage and
continued economic growth. In addition to the common macroeconomic and microeconomic
policies, direct government involvement in technological acquisitions and development is
necessary. In this regard, there is an apparent need to explore the innovation policy priorities
in each phase of industry evolution.
Taiwan’s IC industry in creating leading innovative institutions and shaping cooperation and
coordination between public research and development (R&D) centers and enterprises,
resulting in a different policy demand for Taiwan. It is essential for policy makers to
understand the innovation policy priorities for each phase of industry evolution. This paper
chose the IC industry in Taiwan as an empirical case because it is an appropriate
representative for this subject. The Taiwan IC industry performance is excellent and mature.
Based on Rothwell and Zegveld’s [20] framework for innovation policies, this paper proposes
a model to explore innovation policy priorities using an empirical case in the evolution of
Taiwan’s IC industry. To facilitate exploring the innovation policy priorities for Taiwan’s IC
industry, published or archived data analysis (e.g., [21, 22]), questionnaire survey (e.g., [23]),
and in-depth interviews (e.g., [22]) were used.
This paper is organized as follows. Section 2 summarizes the innovation policies and
Industry evolution. Section 3 reviews, the Taiwan’s IC industry and how the government
provided incentives to promote private sector investment in the IC industry. Methodologies
applicable to the proposed model will be described in Section 4. Section 5 explores the
priorities for innovation policies in the evolution of Taiwan’s IC industry. The conclusion is
documented in Section 6.
2. Innovation policies and industry evolution
Innovation policy includes S&T and industry policy. Science policy is the most
supply-side-oriented and the least direct of these policies. Technology policy is the most
difficult to define because technological research varies significantly in the continuum from
relatively mono-disciplinary scientific research to multidisplinary commercial innovation.
S&T policy aims to enhance the basic and applied research capacities of nations, it basically
supply-side oriented. The industrial policy is generally perceived as an instrument to
reinforce industry competitiveness. Industry policy formation is based upon demand-side
considerations [2]. However, innovation policy oriented toward appropriate new product
ideas, production processes, and marketing concepts can produce, at minimum, temporary
competitive advantages [24].
The search for appropriate policy tools is not easy. Macro measures are not effective;
thus, proposals like a general R&D tax credit are pointless. Policies must be designed to
influence particular economic sectors and activities. In this regard, the essential policy
problem is to augment or redesign institutions rather than to achieve particular resource
allocations [25]. A list of possible innovation policies given by Rothwell and Zegveld [20] is
summarized in Table 1. The various policies are organized into three categories:
A. Supply: Provision of financial, human resource and technical assistance, including the
establishment of S&T infrastructure.
the legal and fiscal framework in which an industry operates.
C. Demand: Central and local government purchases and contracts, notably for innovative
products, processes and services.
Through these three categories, this paper provides a model to analyze the innovation policy priorities in industry evolution.
2. 2 Industry evolution
An historical perspective is basic to understanding both the existing and future economic
conditions. Not surprisingly, biological metaphors have frequently been employed in this
context. Thus terms resonant with biological connotations, such as ‘life cycle’ and ‘evolution’,
have become familiar in the literature of economics (see [26, 27]). The notion of an industry
life cycle has been most influential and applied, in various ways, to industry evolution
interpretation. This subject is reviewed in the following before considering two major
weaknesses. The first weakness is a uni-directional, almost deterministic view of change that
fails to acknowledge the possibility that unpredictable events can fundamentally alter the
course of an industry’s development. The second weakness is an implicit assumption that
Table 1 Classification of innovation policy tools
Category Policy tool Descriptions
Supply side Public enterprise Innovation by publicly owned industries, setting up of new industries, pioneering use of new techniques by public corporations, participation in private enterprise
Scientific and technical
development
Research laboratories, support for research associations, learned societies, professional associations, research grants
Education General education, universities, technical education, apprenticeship schemes, continuing, and further education, retraining
Information Information networks and centers, libraries, advisory and consultancy services, databases, liaison services Environment
side
Financial Grant loans, subsidies, financial sharing arrangements, provision of equipment buildings or services,, loan guarantees, export credits
Taxation Company, personal, indirect and payroll taxation, tax allowances
Legal regulatory Patents, environmental and health regulations, inspectorates, monopoly regulations
Political Planning, regional policies, honor or awards for innovation, encouragement of mergers of joint consortia, public consultation
Demand side Procurement Central or local government purchases and contracts, public corporations R&D contracts, prototype purchase Public services Purchases, maintenance, supervision and innovation in health service, public building, construction,
transport, telecommunications
Commercial Trade agreements, tariffs, currency regulations Overseas agent Defense sales organizations
to sustain in a world of states and blocs where international boundaries represent
discontinuities between different policy environments.
In various guises in this literature shows us that in the early phases of an industry’s life
cycle demand is fragmented across a variety of individual product variants that are produced
primarily by young firms [28-32]. In this phase there is no extraordinary comparative
advantage to incumbency. Rather, there is a considerable amount of entry and exit into the
industry and market uncertainty is high. Young firms are attracted by the ease of competing
on novel product variants. This is what Geroski [33] refers to as technological opportunities.
In the later phases, dominant product designs become established and firms that do not
adhere to these tend to go bankrupt or drop out into small niche markets. Learning from
incumbent firms becomes incremental and cumulative with increasing returns on economic
scale, raising barriers to entry. One result is an industry ‘shakeout’ leading to increased
market concentration and lower uncertainty [32]. Depending on the prime theoretical
orientation, industry shakeout is explained as the result of either decreased entry or increased
exit.
Presented here are some findings from the literature review. The determinants and
conditions in each phase of industry evolution are different. The priorities for innovation
economic growth for the nation, direct (or indirect) government involvement in industry
evolution is necessary. Moreover, no case involving Asian developing countries has been
reported in the literature. This paper proposes a model to explore the innovation policy
priorities in each phase of industry evolution using Taiwan’s IC industry as the case study.
3. Taiwan’s IC industry: an overview
Over the past decades, Taiwan's economy has transformed from traditional industry into
a high technology industry. Although recessions have intervened, hundreds of billion dollars
were invested into the development of high-tech products such as computers, multi-media,
peripherals networks, and so on. Above all, with the boom in IC manufacturing, Taiwan has
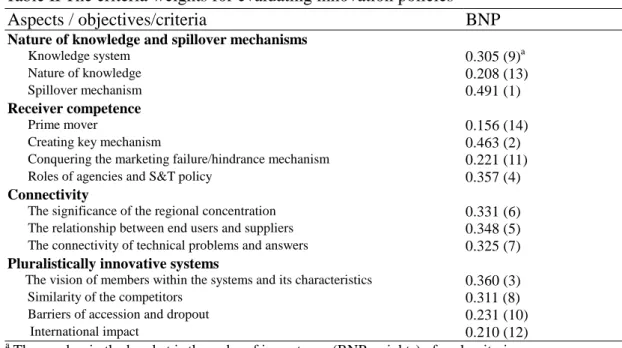
grown into one of the largest manufacturers in the global market. The structural evolution of
the IC industry in Taiwan can be divided into four phases (see Figure 1) [34]. There are
several competent actors that supported Taiwan’s IC industry: the government, Industrial
Technology Research Institute (ITRI), National Chaio Tung University (NCTU), National
Tsing Hua University (NTHU), etc.
The foremost role played by the Taiwan government in developing its IC industry was to
acquire technology from abroad and perform in-house pioneer research through a series of
national research projects. A series of government funded Electronics Industry Development
enterprises across the industry spectrum speed up commercialization of theses technologies to
meet specific market segments. ITRI is a national-level, government-sponsored non-profit
institute for applied research in Taiwan. In selecting various means for transferring enterprise
technologies, ITRI took into account the status of its technologies, the requirements and the
existing technological capacities of the private sector. ITRI also spun off an entire IC
manufacturing operation to create several new enterprises, such as: United Microelectronics
Corp (UMC), and Taiwan IC Manufacturing Co (TSMC). The government established the
Hsinchu Science-based Industrial Park (HSIP) in 1980, to engage in building a brand new
high-tech industry and upgrade current industrial technologies. HSIP is entirely government
oriented, for instance, developed on public land with infrastructure facilities; efficiently
supported one stop service; automated customs services, on-job training; domestic, and
international network; investment incentives and benefits [35]; etc. NCTU and NTHU are
Figure 1 The structural evolution of the IC industry in Taiwan Source:[34] Emerging phase 1966-1976 Assembly only Labor-intensive, no IC fabrication Multinational enterprises dominated International technology acquisition phase 1976-1979
Wafer foundry, assembly 7.0µm
Electronics Research & Service Organization, one pilot plant
Technology build-up and diffusion phase
1979-1988
Design, IC mask-making, wafer foundry, assembly, testing
1.0µm
Boom of domestic firms, design and manufacturing Self-supportive phase 1988- VLSI design, IC mask-making, high-density wafer foundry, high pin-count packaging, automatic testing, sub-µm Sub-µm
Many enterprises, more complete infrastructure, stronger industrial competitiveness
especially in electronics and information. They furnish this industry with talent enforcement
activities, high quality human resource and research and development support. Through these
efforts, Taiwan’s overall IC production was valued at $17.4 billion in 2002. In 2001, there
were more than 100 design enterprises in Taiwan. There are 20 firms producing wafers, over
40 enterprises involved in packaging and some 30 enterprises devoted to testing. The
clustering phenomenon has occurred at HSIP.
4. Remarks on methodologies
Based on Rothwell and Zegveld’s [20] framework for innovation policies, this paper
proposes a model for innovation policy priorities in the evolution of Taiwan’s IC industry
(see Table 1). This framework is helpful to illustrate and explain the innovation policy
priorities in industry evolution. With this framework important priorities can be observed and
evaluated.
To facilitate exploring innovation policy priorities using an empirical case in the
evolution of Taiwan’s IC industry, several methodologies will be introduced. Data analysis of
the published or archived data is widely utilized in the literature as an objective method for
corroborating proposed models and hypotheses (e.g., [21-22]). The questionnaire survey is a
multi-purposed approach capable of measuring either substantial or intangible indicators (e.g.,
drivers and interrelationships (e.g., [22]).
5. Exploring the innovation policy priorities in the evolution of
Taiwan’s IC industry
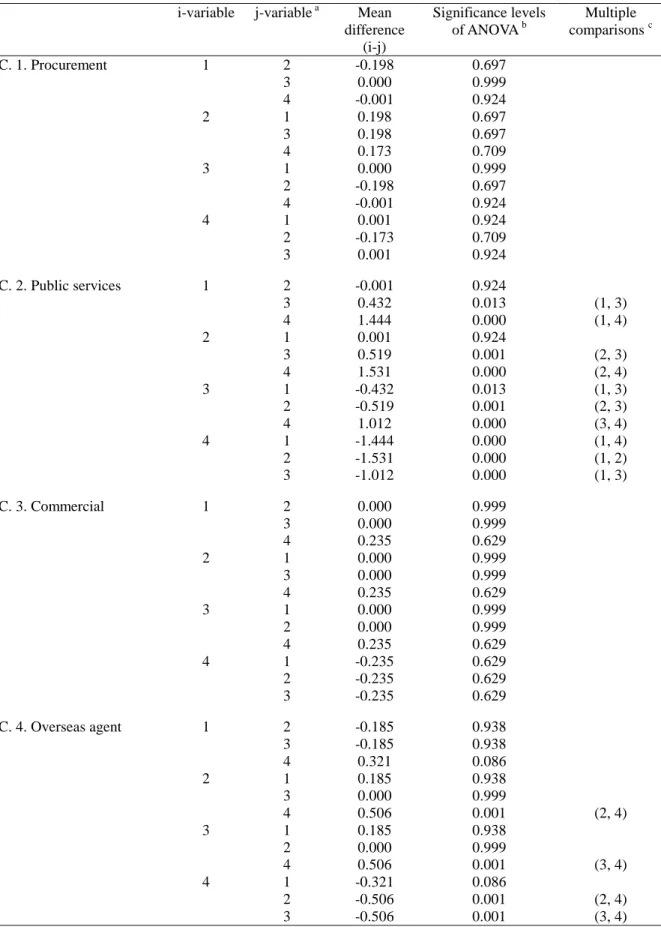
5. 1 Sample and questionnaire
A questionnaire survey study was selected to provide information about the 12 tools
used in the three types of policies (see Table 1) in Rothwell and Zegveld’s [20] framework.
This information was used to explain the innovation policy priorities in the evolution of
Taiwan’s IC industry. Stakeholders in this industry were asked to describe their perceptions
of the 12 tools in three types of policies and how they impact on Taiwan’s IC industry using
a 5-level scale (1 = significant negative effect, 2 = negative effect, 3 = no effect, 4 = positive
effect, 5 = significant positive effect). Of 200 questionnaires sent out, 81 valid returns were
collected calls, as 40.5% valid return rate. In this survey, the majority of the respondents
were managers at foreign-owned enterprises, locally owned enterprises, R&D institutions,
academic institutions, and local government officials in Taiwan. Of 81 valid questionnaires,
46 were from enterprises, 21 were from R&D institutions, 8 were from academic institutions,
and 6 were from government officials. The descriptive statistics are shown in Table 2.
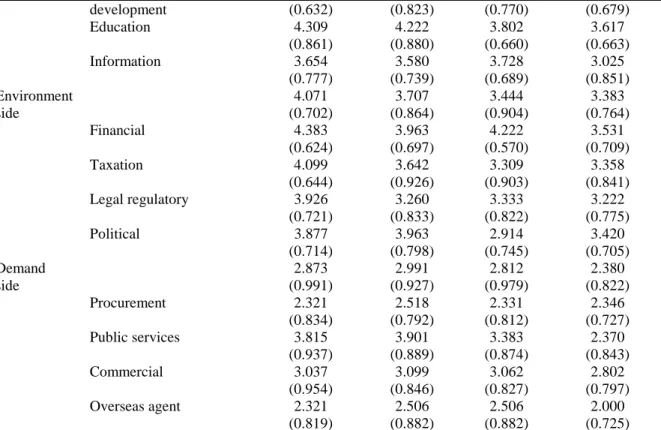
Table 2 Descriptive statistics for replies
Phase Category Policy tool
1. 2. 3. 4. Supply side a 3.657 (0.972) b 3.241 (0.976) 3.500 (0.902) 3.194 (0.808) Public enterprise 2.691 (0.768) 2.568 (0.907) 2.679 (0.849) 2.766 (0.763)
development (0.632) (0.823) (0.770) (0.679) Education 4.309 (0.861) 4.222 (0.880) 3.802 (0.660) 3.617 (0.663) Information 3.654 (0.777) 3.580 (0.739) 3.728 (0.689) 3.025 (0.851) Environment side 4.071 (0.702) 3.707 (0.864) 3.444 (0.904) 3.383 (0.764) Financial 4.383 (0.624) 3.963 (0.697) 4.222 (0.570) 3.531 (0.709) Taxation 4.099 (0.644) 3.642 (0.926) 3.309 (0.903) 3.358 (0.841) Legal regulatory 3.926 (0.721) 3.260 (0.833) 3.333 (0.822) 3.222 (0.775) Political 3.877 (0.714) 3.963 (0.798) 2.914 (0.745) 3.420 (0.705) Demand side 2.873 (0.991) 2.991 (0.927) 2.812 (0.979) 2.380 (0.822) Procurement 2.321 (0.834) 2.518 (0.792) 2.331 (0.812) 2.346 (0.727) Public services 3.815 (0.937) 3.901 (0.889) 3.383 (0.874) 2.370 (0.843) Commercial 3.037 (0.954) 3.099 (0.846) 3.062 (0.827) 2.802 (0.797) Overseas agent 2.321 (0.819) 2.506 (0.882) 2.506 (0.882) 2.000 (0.725)
Note: a In each questionnaire, the grades of the policy tools in one category are averaged into the category’s grade.
b The number in the bracket is the standard deviation.
5. 2 Empirical results
After the questionnaire collection was completed in April 2003, this paper used one-way
ANOVA (parametric method) and the Kruskal-Wallis (K-W) test (nonparametric method) to
examine the four phases exhibited the 12 policy tools. The results are shown in Table 3.
Using one-way ANOVA and the K-W test, the means and medians [36] were significantly
different for 9 policy tools for the four phases at the 0.05 significance level.
Table 3 ANOVA and Kruskal-Wallis test results for 12 policies for the four phases.
Significance levels of ANOVA b Significance levels of K-W test b
A. Supply side a 0.000 0.000
A. 1. Public enterprise 0.499 0.443
A. 2. Scientific and technical development 0.000 0..000 A. 3. Education 0.000 0.000 A. 4. Information 0.000 0.000 B. Environment side 0.000 0.000 B. 1. Financial 0.000 0.000 B. 2. Taxation 0.000 0.000
B. 3. Legal regulatory 0.000 0.000 B. 4. Political 0.000 0.000 C. Demand side 0.000 0.000 C. 1. Procurement 0.327 0.545 C. 2. Public services 0.000 0.000 C. 3. Commercial 0.267 0.136 C. 4 Overseas agent 0.000 0.000
Note: a In each questionnaire, the grades of the policy tools in one category are averaged into the category’s grade.
b
The difference is significant at the 0.05 level.
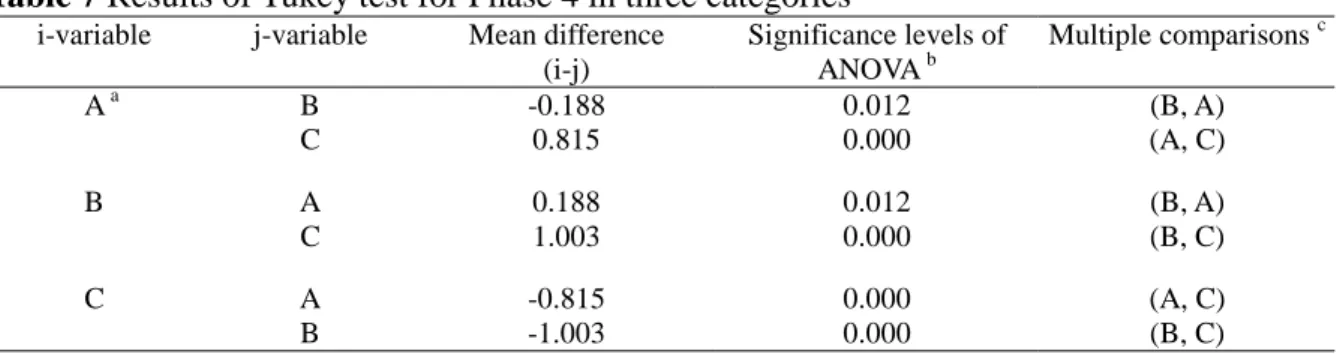
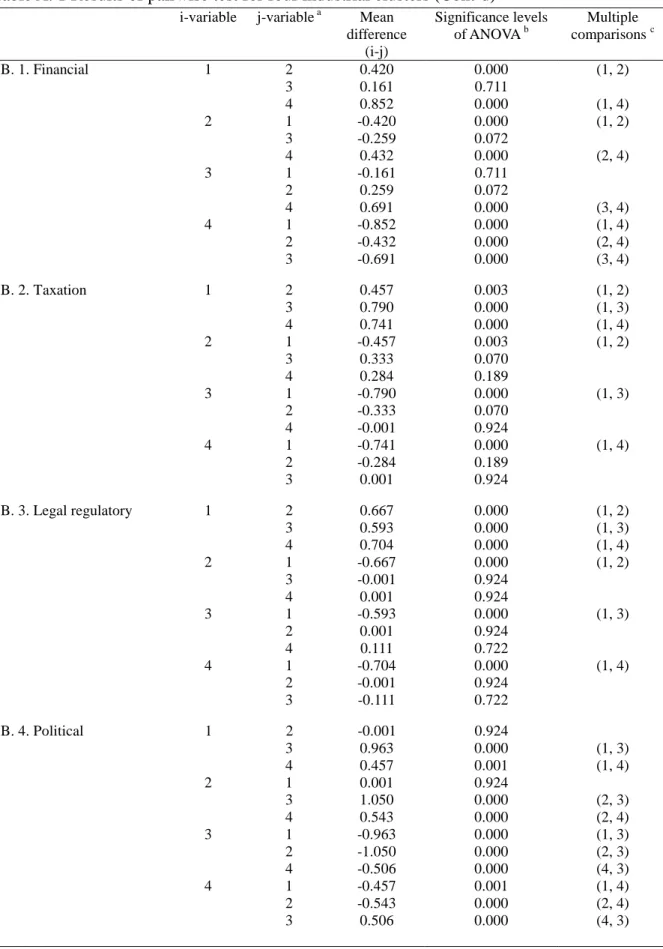
Pairwise comparisons were used to determine the priority for the four phases on the 12
policy tools (see Table A. 1). It was indicated that phases 1 and 3 were significantly superior
to phases 4 and 2 for ‘Scientific and technological development’. Phases 1 and 2 were
significantly superior to phases 3 and 4 for ‘Education’. The priority for the four phases for
‘Financial’ was ranked phase 1, phase 3, phase 2, and phase 4. However, phases 1, 3 and
phases 3 and 2 were not significantly different. Both ‘Taxation’ and ‘Legal regulatory’ might
be given precedence in phase 1 over the other phases. The priority for the four phases for
‘Political’ was ranked phase 2, phase 1, phase 4, and phase 3. However, phases 2 and 1 were
not significantly different. The priority for the four phases for ‘Public services’ were ranked
phase 2, phase 1, phase 3, and phase 4. However, phases 2 and 1 were not significantly
different.
The Tukey multiple comparisons test was applied to produce a ranking to indicate the
sequence for the three categories for the four phases, respectively (see Table 4-7). The
priority for the three category effects on phases 1, 2, and 4 were ranked as ‘Environment side’,
ranked as ‘Supply side’, ‘Environment side’, and ‘Demand side’. However, ‘Supply side’ and
‘Environment side’ were not significantly different.
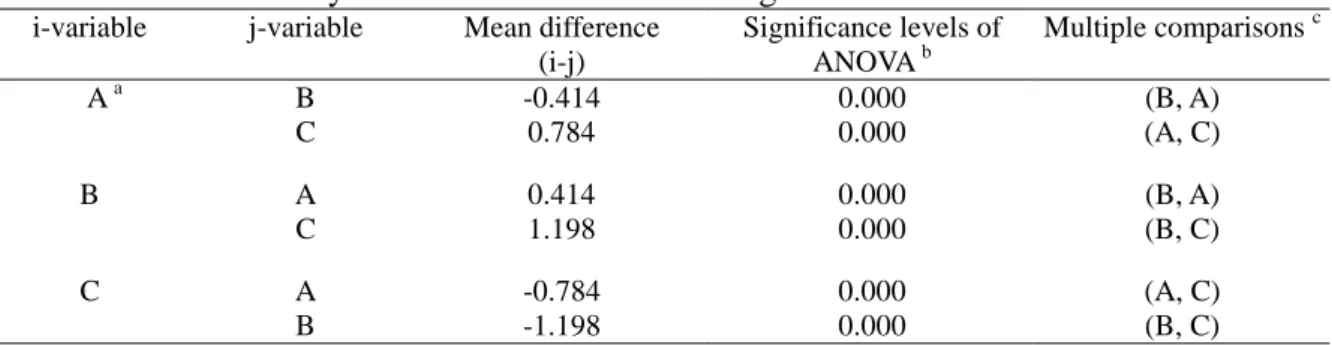
Table 4 Results of Tukey test for Phase 1 in three categories i-variable j-variable Mean difference
(i-j) Significance levels of ANOVA b Multiple comparisons c A a B -0.414 0.000 (B, A) C 0.784 0.000 (A, C) B A 0.414 0.000 (B, A) C 1.198 0.000 (B, C) C A -0.784 0.000 (A, C) B -1.198 0.000 (B, C)
Note: a A: Supply side; B: Environment side; C: Demand side.
b The difference is significant at the 0.05 level. c
(A, B) means that Supply side has significantly higher grade than Environment side at 0.05 significant level.
Table 5 Results of Tukey test for Phase 2 in three categories i-variable j-variable Mean difference
(i-j) Significance levels of ANOVA b Multiple comparisons c A a B -0.485 0.000 (B, A) C 0.216 0.019 (A, C) B A 0.485 0.000 (B, A) C 0.701 0.000 (B, C) C A -0.216 0.019 (A, C) B -0.701 0.000 (B, C)
Note: a A: Supply side; B: Environment side; C: Demand side.
b The difference is significant at the 0.05 level. c
(A, B) means that Supply side has significantly higher grade than Environment side at 0.05 significant level.
Table 6 Results of Tukey test for Phase 3 in three categories i-variable j-variable Mean difference
(i-j) Significance levels of ANOVA b Multiple comparisons c A a B 0.001 0.617 C 0.701 0.000 (A, C) B A -0.001 0.617 C 0.627 0.000 (B, C) C A -0.701 0.000 (A, C) B -0.627 0.000 (B, C)
Note: a A: Supply side; B: Environment side; C: Demand side.
b
The difference is significant at the 0.05 level.
c (A, B) means that Supply side has significantly higher grade than Environment side at 0.05 significant
Table 7 Results of Tukey test for Phase 4 in three categories i-variable j-variable Mean difference
(i-j) Significance levels of ANOVA b Multiple comparisons c A a B -0.188 0.012 (B, A) C 0.815 0.000 (A, C) B A 0.188 0.012 (B, A) C 1.003 0.000 (B, C) C A -0.815 0.000 (A, C) B -1.003 0.000 (B, C)
Note: a A: Supply side; B: Environment side; C: Demand side.
b The difference is significant at the 0.05 level.
c (A, B) means that Supply side has significantly higher grade than Environment side at 0.05 significant
level.
5. 3 Discussions
Through a series of analyses, the innovation policy priorities in the evolution of
Taiwan’s IC industry could be discussed using the four phases.
A. Emerging phase
An ‘Environment side’ policy is vital for the emerging industry evolution phase. The
government also focused on ‘Scientific and technical development’ and ‘Education’.
Taiwan’s IC industry began in 1966 when General Instrument Microelectronics established a
IC packaging business in Taiwan. Later, multinational corporations such as Philips, Texas
Instruments, and RCA started packaging operations. Fewer domestic firms entered this field.
All were labor intensive. In this phase, Taiwan had only IC assembly technology capability.
This was in accordance with cost-driven and export-oriented goals. To strengthen domestic
technological capacity, NCTU opened a IC laboratory to foster advanced technology
vital for the initial industry evolution phase. There is no extraordinary comparative advantage
to incumbency. Rather, there is a considerable amount of entry and exit into the industry and
market uncertainty is high. To attract more domestic participation in this industry the
government initiated several policies (e.g., export credits, subsidies, and tax allowances) for
it.
B. International technology acquisition phase
The priority for the three category effects on this phase were ranked as ‘Environment
side’, ‘Supply side’, and ‘Demand side’. ‘Political’, ‘Public service’, and ‘Education’ were
executed seriously in this phase. The integrated circuit (IC) was introduced in the late 1950s
by Texas Instruments. Their small size, low power consumption, rapid operating speed and
reliability led to dramatic changes in the market. To take advantage of this transition, the
Taiwan government opted to develop IC design and manufacturing technology to breed the
related industries. However, the fast development of IC technology in leading countries lead
to a technology gap that made it difficult for Taiwan to independently develop
commercialized IC technology. First, the private sector in Taiwan was too weak to afford
the large, risky investment in R&D. Second, the private firms, basically cost-driven, were
unwilling to invest in long-term R&D. They preferred to invest in areas with immediate
returns regardless if the area was technology or labor intensive. Finally, acquiring technology
![Table 3 DEA results Nation [DMU] CCR [1996] CCR [1997] BCC [1996] BCC [1997] A&P [1996] A&P [1997] Australia 0.1378 0.8575 1 0.8575 1.0001 (10) 0.8575 (18) Austria 0.7250 0.7956 1 0.8005 0.7242 (19) 0.7956 (19) Belgium](https://thumb-ap.123doks.com/thumbv2/9libinfo/8358842.176704/25.892.104.730.161.714/table-results-nation-dmu-ccr-australia-austria-belgium.webp)
![Figure 1 The structural evolution of the IC industry in Taiwan Source:[34] Emerging phase 1966-1976 Assembly only Labor-intensive, no IC fabrication Multinational enterprises dominated International technology acquisition phase 1976-1979](https://thumb-ap.123doks.com/thumbv2/9libinfo/8358842.176704/46.1263.91.1164.133.647/structural-intensive-fabrication-multinational-enterprises-international-technology-acquisition.webp)