國立交通大學
機械工程學系
博士論文
聚苯乙烯真空保溫片熱傳機制之影響研究
Investigation of the Heat Transfer Mechanism on the
Performance of Polystyrene Foam Insulation
研 究 生:曾鵬樟
指導教授:陳俊勳 教授
曲新生 教授
聚苯乙烯真空保溫片熱傳機制之影響研究
Investigation of the Heat Transfer Mechanism on the
Performance of Polystyrene Foam Insulation
研 究 生 : 曾鵬樟 Student : Pen-Chang Tseng
指導教授 : 陳俊勳、曲新生 Advisor: Chiun-Hsun Chen
Hsin-Sen Chu
國 立 交 通 大 學
機 械 工 程 學 系
博 士 論 文
A Thesis
Submitted to Department of Mechanical Engineering National Chiao Tung University
in partial Fulfillment of the Requirements for the Degree of
Doctor of Philosophy in
Mechanical Engineering
April 2010
Hsinchu, Taiwan, Republic of China
聚苯乙烯真空保溫片熱傳機制之影響研究
學生:曾鵬樟
指導教授:陳俊勳、曲新生
摘 要
本研究係針對 PE 添加物在 PS 發泡過程,對真空保溫片芯材之結構與熱傳機制的效 應進行探討。總計製作 42 組樣品,用來測試分析多孔發泡材結構與 PE 添加物對真空保 溫片性能的影響。這些樣品係使用自行研發的批次式設備來製作,並可藉製程溫度與壓 力來調整真空保溫片之芯材的發泡結構。本研究提出數個參數與定義芯材之發泡結構, 如破孔率、平均胞體直徑、與固體容積率。本研究結果發現,在特定的固體容積率條件 下,平均胞體直徑與破孔率有一線性相依的關係,同時存在著一最佳的平均胞體直徑可 使總熱傳降低至最低。此外,輻射熱傳係數及其它熱傳係數的特徵,也可使用這些參數 來描述與推測。增加 2%的 PE 添加物是可有效地來改變胞體結構與降低熱傳,而增加 PE 添加物至 5%時,對進一步改善性能效果的助益不大。在本研究中,獲得之最佳的熱傳導 係數是 4.4(mWm1K1),是已發表真空保溫材性能之文獻中最好的。本研究中固體熱 傳占真空保溫材之總熱傳的 80%以上,主要是受固體容積率的影響。故高性能真空保溫 材的改善原則,是儘可能的降低固體容積率以降低固體熱傳效應,然後維持平均胞體直 徑在一最佳值。但應注意固體熱傳與輻射熱傳之消長,若固體容積率的降低方式是降低 固體材料的質量時,因材料支撐大氣壓力的結構應力限制,胞體直徑會變小、或支架變 細、或微胞壁膜變薄,這些變化也有可能增加輻射熱傳。Investigation of the Heat Transfer Mechanism on the Performance
of Polystyrene Foam Insulation
Student:Pen-Chang Tseng Advisor:Chiun-Hsun Chen
Hsin-Sen Chu
Abstract
The effects of adding Polythene (PE) in (polystyrene) PS foaming material on the cell
structure and the heat transfer of vacuum insulation panels (VIPs) are examined in this study.
Totally 42 samples were fabricated and analyzed to examine the influence of porous foam
structure and PE additive on VIP performance. The samples were produced by in-house
equipment that was able to vary the foam structure by modulating the process temperature and
pressure. Several parameters were proposed to describe the foam structure, namely, the
broken cell ratio, the average cell size and the solid volume fraction. Under a specific solid
volume fraction, the average cell size and the broken cell ratio are linearly correlated, and it
was found that an optimum cell size exists such that the total heat transport is minimal.
Furthermore, these parameters are also suitable for characterizing heat transfer coefficients of
thermal radiation and other heat transports. Adding 2% PE was effective in altering the cell
structure and reducing the heat transfer, while adding 5% PE did not improve the performance
further. The lowest thermal conductivity found in this study is 4.4 1 1
K
mWm , which is
transport in VIPs. The rule of thumb of reducing VIPs’ heat transport is to decrease the solid
volume fraction as much as possible, while maintaining an optimal average cell size.
Nevertheless, attention should be paid to balancing solid conduction and thermal radiation.
The reduction of solid volume fraction is normally accompanied by the decrease of solid mass,
leading to weaker structural support such that smaller cell size is required to maintain
structure integrity. The decrease of solid mass is therefore accompanied by slimmer struts and
誌 謝
首先感謝恩師 曲新生及陳俊勳教授,恩師除了在學術上悉心的指導我之外,在待 人作事的處世方面,亦是值得我學習的典範。其次,感謝 鄭名山博士及王啟川教授在 交大求學過程中給予我莫大的幫助,使我的博士論文能進行的十分順利,也感謝口試委 員翁政義、陳朝光、林凊發、陳慶耀及顏維謀等諸位教授對於論文的建議及指導,使得 本論文更加的嚴謹及完整。 此外,特別感謝交大曲門實驗室與陳俊勳師門的學長、學姐、同學及學弟妹們在學 業及生活上的關心與照顧,幫助我在研究過程中解決許多困難。 最後特別感謝我的家人,在這漫長的求學過程,不斷給予我許多的支持及鼓勵,陪 伴我經歷了許多挫折及挑戰,謹以此論文獻給所有幫助、關心及照顧我的人。TABLE OF CONTENTS
page
ABSTRACT (IN CHINESE)
… … … ... iABSTRACT (IN ENGLISH)
… … … ... iiACKNOWLEDGEMENTS… … … …
ivTABLE OF CONTENTS
… … … ... vLIST OF TABLES
… … … ... viiiLIST OF FIGURES
… … … ... IxNOMENCLATURE
… … … .. xiiCHAPTER 1 INTRODUCTION
… … … ... 11-1 Overview of Thermal Insulation… … … … ...… … … ..… .… … … ..… … … 1
1-2 Literature Survey… … … ...… … .… … … .… … … ... 4
1-3 Motivation and Objective… … … ...… … … ..… … … .. 10
CHAPTER 2 THEORY
… … … … .… … … .... 172-1 Combined Solid Conduction and Thermal Radiation… … … … ..… … … ... 17
2-1-1 Assumptions… … … ..… … … .… … .… … … ... 17
2-1-2 Limitations… … … ..… … … .. 18
2-1-3 Equivalent Total Thermal Conductivity… … … ..… … … ... 18
2-2 Foam Parameters of Partial Open Polystyrene Foam… … … . 21
2-2-1 Broken Cell Ratio… … … ..… … … ... 21
2-2-2 Solid Volume Fraction… … … ..… … … ... 22
CHAPTER 3 EXPERIMENTS
… … .… … … ... 233-1 Sample Description… … … ..… … … ...… … … 23
3-2 Apparatus… … … .… … … .… … … ..… … … 23
3-2-1 Air Pycnometer… … … ..… … … 24
3-2-2 Fourier Transform Infrared (FTIR) Spectrometer… … … ..… .… … ... 24
3-2-3 Guarded-Hot-Plate System… … … ...… .… … … 26
3-3 Experimental Procedure… … … ... 27
3-4 Uncertainty Analysis… … … … ..… … … ..… … … .. 28
CHAPTER 4 RESULTS AND DISCUSSION
… … … ..… … … ... 404-1 Polystyrene Foam Vacuum Insulation Panels … … … … ...… … … … ... 40
4-1-1 The Relationship Description of Physical Properties… … … … ..… … … ... 41
4-1-2 The Effects of Foam Parameters… … … ... 41
4-1-3 The Influences of Lower Solid Fraction… … … ... 42
4-1-4 The Influences of Higher Solid Fraction… … … ... 43
4-2 The Effects of PE Additive… … … ..… .… … … 44
4-2-2 The Effects of Foam Parameters with PE Additive… … … ...… … … 46
4-2-3 The Influences of Lower Solid Fraction without PE Additive… … … ..… … 47
4-2-4 The Influences of Higher Solid Fraction with PE Additive… … … ... 48
CHAPTER 5 CONCLUSIONS AND RECOMMENDATIONS
… … ... 715-1 Conclusions… … … .. 71
5-2 Recommendations… … … 74
REFERENCES… … … .. 75
LIST OF TABLES
Table 4-1 The experimental results of the 14 samples… … … 50 Table 4-2 The characteristics of PS core material with 0%PE, 2%PE and
LIST OF FIGURES
Figure 1-1 The structure of vacuum insulation panel (VIP)… … … ... 14
Figure 1-2 Various types of cryogenic insulations [1]… … … . 15
Figure 1-3 Thermal conductivity of cryogenic insulation. Note: Forms are open cell
type between 1( 1 1
K
mWm ) to 10(mWm1K1) [1]… … … . 16
Figure 3-1 The picture of the 40 tons press equipment and the 400mm diameter
mold… … … ... 30
Figure 3-2 Sample of VIP with Polystyrene Form… … … 31
Figure 3-3 The dual pressure control system used to modulate the foaming Pressure… . 32
Figure 3-4 Schematic diagram of Air Pycnometer… … … 33
Figure 3-5 Photo picture of Air Pycnometer… … … ... 34
Figure 3-6 Schematic diagram of the Fourier Transform Infrared Spectrometer… … … . 35
Figure 3-7 Photo picture of the Fourier Transform Infrared Spectrometer… … … ... 36
Figure 3-8 Photo picture of micrometer gauge… … … ... 37
Figure 3-9 Photo picture of equivalent total thermal conductivity measurement
System… … … ... 38
Figure 3-10 Schematic diagram of equivalent total thermal conductivity
measurement system… … … . 39
Figure 4-2 The transmittance spectrums of several typical samples… … … ... 53
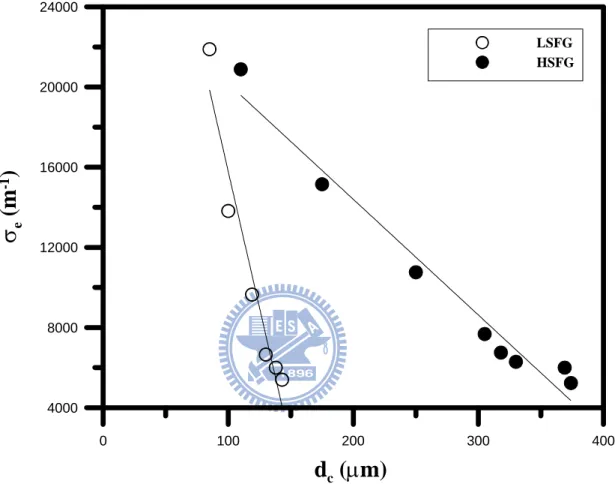
Figure 4-3 The spectral extinction coefficients of several typical samples… … … .. 54
Figure 4-4 The relation between average cell size and broken cell ratio, under two
different solid volume fractions… … … 55
Figure 4-5 The effects of average cell size on extinction coefficient, under two
different solid volume fractions… … … 56
Figure 4-6 The effects of broken cell ratio on extinction coefficient, under two
different solid volume fractions… … … 57
Figure 4-7 The influences of average cell size on the LSFG equivalent thermal
conductivities… … … ... 58
Figure 4-8 The influences of average cell size on the HSFG equivalent thermal
conductivities… … … ... 59
Figure 4-9 SEM of sample PE2L1 for PS core material with 2% PE additive… … … … . 60
Figure 4-10 SEM of sample PE5L3 for PS core material with 5% PE additive… … ... 61
Figure 4-11 Spectral transmittance varied with wavelength on PE2H samples… … ... 62
Figure 4-12 Spectral extinction coefficient varied with wavelength on PE2H samples... 63
Figure 4-13 Relationship between cell sizes and broken cell ratio on various PE
additives with high and low solid volume fraction… … … ... 64
in the growing cell… … … . 65
Figure 4-15 Rosseland mean extinction coefficient varied with cell sizes with/without
PE additives on high and low solid volume fraction… … … . 66
Figure 4-16 Rosseland mean extinction coefficient varied with broken cell ratio
with/without PE additives on high and low solid volume fraction… … … ... 67
Figure 4-17 The relation between equivalent thermal conductivity and cell sizes for
PS core material without PE additive… … … 68
Figure 4-18 The relation between equivalent thermal conductivity and cell sizes for
PS core material with 2% PE additive… … … .. 69
Figure 4-19 The relation between equivalent thermal conductivity and cell Size for
NOMENCLATURE
c
d cell size ( )m
b
e the emitted blackbody energy flux, ( / m2
W )
b
e Planck’s spectral distribution of emissive power, ( /( 2 )
m m
W )
s
f solid volume fraction, V /s Vt, eq.(15)
g s
f volume fraction of combined solid and gas, ( Vub + Vs)/V .t
i spectral intensity of radiant energy ( 2 1 1
sr m
Wm )
b
i spectral intensity of a blackbody ( 2 1 1
sr m
Wm )
g s
k the equivalent thermal conductivity of combined solid and gas
( 1 1
K
mWm )
r
k the thermal radiation conductivity ( 1 1
K
mWm )
t
k the equivalent total thermal conductivity ( 1 1
K
mWm )
m the weight of the sample (kg)
n the refractive index of the medium, eq.(9)
g s
q the heat flux of combined solid and gas ( 2
Wm )
r
q radiation heat flux ( 2
Wm )
t
q total heat flux ( 2
Wm )
S Coordinate along path of radiation ( m )
b
V the broken cell volume ( 3
m )
s
V the volume of solid ( 3
m )
g s
V the volume of combined solid and gas in the unbroken cell ( 3
m )
t
V the apparent volume or total volume ( 3
m )
tb
V the volume of all the cells ( 3
m )
ub
V the volume of gas in the unbroken cell ( 3
m )
Greek symbols
f
apparent density or foam density, ( 3
kgm )
s
the density of the solid, 991.96( 3
kgm )
g s
the density of the combined solid and gas in the unbroken cells, ( 3
kgm )
Stefan-Boltzmann constant, 5.67108( 2 4
K
Wm )
e
Rosseland mean extinction coefficient, eq. (8)
a spectral absorption coefficient, eq. (13)
e spectral extinction coefficient, eq. (13)
s spectral scattering coefficient, eq. (13)
spectral transmittance, eq. (13)
i
,
phase function
broken cell ratio, V /b Vtb, eq.(14)
i
incident solid angle ( sr )
CHAPTER 1
INTRODUCTION
1-1 Overview of Thermal Insulation
The improvement of thermal insulation technology has long been a major issue for
researchers who seek reliable and efficient ways of energy conservation. Thermal insulation is
a passive energy-saving method that minimizes energy loss during thermal energy storage and
transportation. It is widely applied in many modern engineering systems, such as building
HVAC, industrial process cooling and refrigeration, cryogenic engineering systems, hydrogen
storage, etc. The amount of energy-saving that a good thermal insulation can provide is
tremendous. For example, the HVAC loading of a low-temperature logistics center can be
reduced by more than 30% using adequate thermal insulation, which consequently reduces the
HVAC equipment capacity and energy consumption.
Theoretically, an evacuated metal box can provide excellent thermal insulation because
the only heat transport route in an evacuated metal box is thermal radiation. The metal acts as
the structural support of the box that is under the pressure difference between ambient
atmosphere and vacuum. Nevertheless, the irregular shape of most industrial products has
limited the application of evacuated metal box.
panels that were constituted by fibrous or grainy supporting structure enclosed by sealing
bags. Heat transport routes in the plate-type panels include solid conduction through fibers
and particles, air convection, air conduction, and radiation. The relatively low thermal
conductivity and light-weight of plate-type panels were very attractive for early HVAC and
building insulation.
Along with the advancement in foaming technology, closed-cell foams such as PU
(polyurethane) and PS (polystyrene) gradually replaced fibrous and grainy materials in
insulation applications. Closed-cell foams are superior in several aspects. They are
lightweight, low cost, easy to mass produce, and most importantly, without the hazardous
effects that fibers and particles could have on human health. Typical closed-cell foams consist
of voids, struts, and wall membranes. The voids typically have characteristic length of 1mm
and the convection inside the voids is negligible because the Rayleigh number is much lower
than 1000, the critical number necessary to initiate natural convection. A typical example of
PS foam [8] has an average void size of 400 μm and an effective thermal conductivity of 26
mW/mK at 300K, which consists of contributions by solid conduction (3 mW/mK), gas
conduction (19 mW/mK) and radiation ( 4 mW/mK). Gas conduction in closed-cell foams
arises from the gases entrapped inside the cells during foaming process. Figure 1-1 shows the
structure of a typical closed-cell PU foam. Although the entrapped gases, which are
organic substances, typically have much lower thermal conductivity than air, gas conduction
still accounts for most of the heat transfer in closed-cell foams. It is essential for the foaming
agents to have adequate diffusivity so that they can diffuse into the cells during foaming
process. Nevertheless, the foaming agents also diffuse out the cells after a period of time and
is replaced by air, which has higher thermal conductivity and consequently degenerates the
insulation performance of closed-cell foam, a phenomenon known as the thermal aging
process [3,9]. Furthermore, CFCs are detrimental to the ozone layer. Searching for new
foaming agents that have lower environmental impacts and better insulation performance is
therefore crucial for the future development of closed-cell foams.
In addition to polymer foams, other materials such as metal foams and ceramic have also
been applied in insulation in different temperature ranges. The major issues in high
temperature insulation materials are surface oxidation and material sublimation. For low
temperature applications, researchers have developed vacuum insulation panel (VIP)
technology, see Fig 1-2(b). A VIP is constituted by an open-cell core material that acts as
structural support and is enclosed by an impermeable sealing bag. The open-cell structure
allows the bag to be evacuated to vacuum to remove all the entrapped air and completely
eliminate the heat transfer by air conduction and convection. The effective thermal
conductivity could be greatly reduced since only solid conduction and radiation are left in VIP.
2 to 6 times lower than closed-cell insulation foams. Three types of VIPs are most common,
namely, simple high-vaccum insulation, evacuated porous insulation, and evacuated
multilayer insulation, as shown in Fig. 1-2. Figure 1-3 depicts their corresponding effective
thermal conductivities.
1-2 Literature Survey
Many researchers remain highly interested in fibrous and grainy insulation materials
over the last several decades. Tong and Tien [18-20] predicted radiant heat flux by two-flux
and linear anisotropic models to investigate the thermal radiation in fibrous insulation.
Comparing with the experimental results obtained by infrared spectrophotometer and
guarded-hot-plate apparatus, their model calculation showed consistent results. Chu et al. [21]
systematically studied the thermal radiation of ultra-fine powder insulation formed by Aerosil
380 SiO2 particles with 7nm diameter. If the pore size between the solid particles is lower than
the mean free path of air, which is about 20nm at 300K, the diffusive transport of air
conduction would be greatly reduced. They concluded that thermal radiation accounts for
10% of the overall effective thermal conductivity at room temperature. The proportion rises to
50% at 1000K. Marge [22] proposed to reduce thermal radiation by adding micro-size
powders into foaming materials. Heinemann and Caps [23] thoroughly investigated the
described a numerical technique that precisely predicts the temperature profile and total heat
flux in semi-transparent, non-scattering and non-gray media.
The past researches of heat transfer in porous foams can be classified into solid
conduction [24-27], gas conduction and convection [8, 28], and radiation [8-57]. Some
prominent research results are described below.
Glicksman’s group derived thermal radiation of closed-cell foams, as follows. Using
cubic model [24-26] and assuming two-third of the membranes and one-third of the struts are
parallel to the temperature gradient direction, the solid conduction can be expressed by,
ks
2/3 fm/3
fsk0 (1)where f is the mass fraction of the struts, m f is solid volume fraction, and s k is the 0
thermal conductivity of the solid material. Assuming independent radiation and simulating the
closed-cell foam by random arrangement of partially transparent window membranes, a
scaled extinction coefficient is given by [29-32],
f f d
Q
kr 5.23 m s 0.5/ (2)
where Q is efficiency factor and d is average cell size.
Caps et al. [28] studied polyimide foam and proposed a heat transfer model based on the
parameters of temperature, pressure and density to calculate gas and solid heat transfer, as
well as radiation and overall thermal conductivity. Druma et al. [27] simulated carbon foam
radiation heat transfer. They investigated heat transfer in carbon foams with different porosity
and compared the results of finite element simulation, theoretical solutions, and
semi-empirical analysis.
The majority of research papers in foam insulation have been focused on radiation heat
transfer. In general, the thermal radiation of foam insulation can be investigated by two
approaches [33]: the macroscopic method that uses an inverse technique to retrieve the values
of radiation parameters from experimental data, and the microscopic method that analyzes the
foam structure from a microscopic point of view to develop predictive models. Several
notable researches adopting the macroscopic approach are briefly described below. Larkin and
Churchill [34] employed a two-flux model to predict the thermal radiation of Fiberglas,
Foamglas and Styrofoam. They presumed an optimal cell diameter in foam materials in terms
of minimizing thermal radiation. Arduini and Ponte [35] suggested a solution of equations
combining heat conduction and radiation to overcome the nonlinear correlation between
thermal radiation and temperature. Giaretto et al. [36] studied the thermal conduction and
radiation of open-cell melamine foam insulation. Comparing the measurement results with the
prediction by integral model and by diffusive model indicates that the latter is less applicable.
Wu et al. [37] investigated the heat transfer of PU foams at 760 torr and 0.014 torr. They
concluded that thermal radiation accounts for 20% of the heat transfer at 0.014 torr. They also
absorbents were required to absorb the gases and maintain low thermal conductivity. Li [38]
proposed a conjugate gradient method to solve the inverse conduction-radiation problem for
simultaneous estimation of the single scattering albedo, the optical thickness, the
conduction-to-radiation parameter, and the scattering phase function. The single scattering
albedo and the optical thickness can be estimated accurately from both exact and noisy data.
For microscopic approach, the following researches are notable and worth mentioning.
Doermann and Sacadura [39] adopted a dodecahedron cell structure to simulate foaming
materials and used a weighted scattering coefficient for anisotropic scattering to correct the
Rosseland mean extinction coefficient. For carbon foam in high temperature applications,
their model provides a better prediction of thermal radiation than earlier models. Kamiuto [40]
adopted the Dul’nev cubic unit cell model to predict the thermal and radiative properties of
open-cellular porous materials for applications in high-temperature heat transfer
augmentations. Quenard and Giraud [41] developed an experimental procedure to measure the
micro-structural geometrical parameters of a packing of cellular pellets such as EPS foam.
They concluded that a critical value of foam density exists for any given cell size to minimize
effective thermal conductivity. Baillis et al. [42] used the predictive model developed by
Doemann and Sacadura that incorporates the minimum/maximum strut thickness and foam
porosity. Their accurate description of foam geometry allows an estimation of the spectral
simulation of foam geometry attracted a lot of interests. Lu et al.[43] developed a simple
cubic unit cell model to explore the applications of open-cell metal foam in compact heat
exchangers. Nevertheless, their prediction led to an overestimate result. Zhao et al. [44-45]
measured the radiative heat transfer of FeCrAlY alloy foams having high porosity (larger than
95%) and various cell diameters. The extinction coefficient decreases along with the increase
of cell diameter, which has little influence on reflectivity. Both the extinction coefficient and
reflectivity were found to increase as the operation temperature increased. Micco and Aldao
[46] derived radiative heat transfer rates using a geometrical model and concluded that the
geometrical model produces results more consistent with experimental data than the
derivation based on Rosseland mean extinction coefficient. Coquard and Baillis [47]
simulated the closed-cell structure of EPS by dodecahedrons and cubes. By solving
one-dimensional steady state coupling equations of radiative and conductive transfer, they
found the following parameters pertinent to heat transfer, which are listed in order from
higher influence to lower influence: foam density, mean cell diameter, inter-bead porosity,
and mean bead diameter. Wang and Pan [48] developed a random generation-growth method
for reproducing the microstructures of open-cell foam by using periodic arrays with regular
geometries. Due to high porosity, low thermal conductivity of each component, and
non-negligible radiative heat transfer, the predicted thermal conductivity is lower than the
that is based on cylindrical struts, pentagon membranes, and dodecahedron cell. Their analysis
of solid and gaseous heat transfer followed the model proposed by Schuetz and Glicksmann
[25] and Caps et al. [28]. Many earlier studies simulated the complex cell geometry of porous
foams by simplified regular cell models and had been focused on polymer foams having
relatively high density. For low density foams, the model prediction results are not as good in
terms of comparing with experimental data. To some degree, it can be explained by the fact
that many earlier studies relied on a single parameter to evaluate thermal radiation, namely,
the weighted Rosseland extinction coefficient, which is not enough to describe all thermal
radiation properties of low density foaming materials.
To obtain more precise prediction of thermal radiative properties, some earlier studies
have employed tomography scanning technique to study the cell structure of foaming
materials. Zeghondy et al. [49, 50] were the first to utilized X-ray scanning technique to
acquire the information of cell structure and applied it in thermal radiation calculation. They
employed the technique of Radiative Distribution Function Identification (RDFI), which was
developed by Tancrez and Taine[51], to obtain the structure of open-cell foams. Comparing
with experimentally measured reflectance, the data of a semi-transparent homogeneous
material showed excellent consistency. In the case of aluminum foams, Loretz et al. [52] used
geometric optics law to model the interaction of radiation with the particles forming the foam
the model of Glicksman and Torpey that neglects the scattering effect, the scattering of the
aluminum foam is normally modeled by opaque spheres with diffusive reflection, because the
high reflectivity of aluminum metal makes scattering an indispensible part in describing the
radiative characteristics of the foam.
To summarize, many models based on regular-shaped cell assumption have been
proposed in earlier studies, but their application to low-density irregular shaped foams,
especially those partially-open-cell foams, is questionable. The x-ray scattering technique
provides another approach to reveal the detailed transport in porous foams. It is, however,
specific to individual cases and does not provide general guidelines for material improvement.
1-3 Motivation and Objective
In open-cell foams, a cell breaks when forming agents induce enough internal pressure to
overcome the cell membrane strength, which depends largely on the viscosity of the material, and therefore on the glass transition temperature (Tg). The material viscosity is relatively high
at temperatures above Tg, but the material hardens immediately when the temperature falls
below Tg. Both features hinder the cell from breaking. It is very difficult to control the
material temperature and simultaneously break all the cells inside the material. The positions
and number of the unbroken, i.e., closed, cells are hard to control. Nevertheless, cell geometry,
thermal radiation in VIPs. Further enhancement of VIP performance requires determining the
influence of cell geometry on conduction and radiation, and using this knowledge to improve
the manufacturing process.
Because of the complex structural geometry of open-cell core material in VIP, most of
the previous studies assumed all closed-cell or all open-cell structures in their analyses.
However, practical applications are far more complicated since the cells in VIPs are not 100%
broken, which means that some cells are closed. Due to the lack of systematic experimental
data of partially-open-cell structure, it is difficult to verify the model prediction even using
cell structure obtained by tomography scanning. The purpose of the present study is to
systematically investigate partially-open-cell foams as the core materials in VIP. Appropriate
macroscopic parameters, such as broken cell ratio, solid volume ratio, and average cell size,
will be identified to characterize the foam performance, which will form a basis for future
researches of cell morphology in thermal radiation. This study therefore deals with heat
transfer in VIPs with partially open cell structures, focusing on VIPs with most of the cells
broken. Specifically, more than 90% of the cells are broken and less than 10% of the cells are
closed. This high ratio of broken cells is necessary and common in VIPs with satisfactory
performance.
Chapter 2 reports a mathematical modeling of partially open polystyrene foam. The total
effective thermal conductivity consists of the equivalent thermal conductivity by combined
solid and gas, and the equivalent thermal conductivity by radiation. Because all the samples
are optically thick, the radiative conductivity can be calculated by Rosseland mean coefficient.
In the mean time, this study proposed a new parameter of broken cell ratio to describe open
cell content. Together with the parameter of specific solid volume ratio, the geometric
influence on extinction coefficient can be clearly manifested.
Chapter 3 describes the preparation of samples, air pycnometer, Fourier transform
infrared spectrometer, and guarded-hot-plate system. This chapter also includes the
uncertainty analysis of effective total thermal conductivity.
Chapter 4 studies the relationship between broken cell ratio, solid volume ratio and cell
size, and their effects on heat transfer mechanisms. A total of 14 samples with different cell
geometries were produced, and their heat transfer rates were measured and analyzed. The
results will be helpful in describing heat transfer in VIPs and serve as a basis for improving
VIP performance in the future. Besides, Chapter 4 also explores the effects of polythene
additive on the performance of PS vacuum insulation panels. A total of 42 samples with
different PE contents, namely, 0wt%, 2wt% and 5wt%, were fabricated in this study. Their
heat transfer rates were measured and analyzed. The results will be helpful in manufacturing
VIP with improved performance.
Fig.1-1 The structure of closed cell foam [1]
cold
warm
core material
(close cell)
boundary1
boundary 2
Fig.1-2. Various types of cryogenic insulations [1]
cold
warm
high vacuum
reflective surfaces (a) SIMPLE VACUUM
cold warm gas barrier (c) MULTILAYER (c1) cold warm (c2) core material (open cell) high vacuum metal reflector high vacuum layers of criukler or embossed metal coated plastic film cold warm gas barrier high vacuum core material (open cell) (b) POROUS
Fig.1-3. Thermal conductivity of cryogenic insulation. Note: Forms are open cell type between 1( 1 1
K
mWm ) to 10(mWm1K1) [1].
0.01 0.1 1 10 100
Effective thermal conductivity (mWm k ) multilayer insulations opacified powder,and fibers powders, fibers and foams powders, fibers,foams, cork,etc. non-evacuated evacuated N2 He -1 -1
CHAPTER 2
THEORY
2-1 Combined Solid Conduction and Thermal Radiation
2-1-1 Assumptions
The core material of PS foam has a partial open-cell porous structure. Heat transferred
through VIP via two mechanisms: (1) conduction by gas and solid; and (2) by radiation. The
one-dimensional, steady state energy equation for a participating medium with no internal
heat generation is considered in this study. It is further assumed that ks ksg since the contribution by gas conduction is relative small in the samples with broken cell ratio higher
than 90%. Note that the heating before sealing and evacuating also helped to eliminate the
gases enclosed in closed cells.
The solid volume fractions of the samples are normally less than 0.6. For the solid
phase, over 97% material is polystyrene, which has a refractive index of 1.55. Therefore, if
one estimates the refractive index ( n ) of the foam by weighing the ratio of solid to void
volume, the result would be around 1.03, which is very close to the refractive index of air and
vacuum and is neglected in the calculation. The dimensionless optical thickness of a PS
sample is evaluated by multiplying its geometrical thickness by its mean extinction coefficient
[58-59].
2-1-2 Limitations
The samples in this study normally operate in the temperature range of 0℃ to 30℃ and
without heat generation within the core material. Contact thermal resistance between envelope
and core material is considered part of the solid conduction and is not distinguished from it in
this study. This simplification does not influence the measurement accuracy or the
determination of total thermal conductivity, because the contact surface is under a
compression force exerted by the atmospheric pressure and the contact resistance is relatively
constant for a given sample.
In this study, thermal radiation and total heat transfer are measured experimentally. Solid
conduction is determined by deducting thermal radiation from total heat transfer, as described
in Eq.(4). Theoretically, it is also possible to measure solid conduction and determine thermal
radiation by deducting solid conduction from total heat transfer. Nevertheless, the uncertainty
of determining thermal radiation indirectly is likely to be larger. This is manifested by
assuming an equal uncertainty percentage in measuring thermal radiation and solid
conduction. The influence on thermal radiation uncertainty by solid conduction uncertainty is
higher because the former accounts for less than 20% of the total heat transfer. An 1%
uncertainty in solid conduction represents an 4% uncertainty in thermal radiation.
2-1-3 Equivalent Total Thermal Conductivity
(qs+g), and by radiation (qr),
qt
qr qsg
( 3)The concept of equivalent thermal conductivity applies,
g s r
t k k
k ( 4)
where k is the equivalent total thermal conductivity, t k is the fraction of equivalent r
thermal conductivity induced by thermal radiation, and ksg is the equivalent thermal
conductivity of combined solid and gas.
2-1-4 Equivalent Thermal Conductivity by Radiation
The contribution to the equivalent thermal conductivity by radiation is evaluated by the
following method. A medium is considered optically thick, if its optical thickness is far
greater than 1. Since all the measured optical thickness of this study’s samples exceeded 45, it
is satisfactory to assume all samples are optically thick and use Rosseland mean coefficient .
For the diffusion approximation, the total net radiative heat flux of an absorbing,
emitting, and isotropic scattering medium can be written as [37, 58-59 ],
d dS S T de q b e r
0 1 3 4 (5)The derivate of eb
T
S
with respect to Scan be written as
dS T de T de T de dS de b b b b . (6)
d T de T de dS T de q b b e b r
0 1 3 4 . (7)The Rosseland mean extinction coefficient, , is defined as [ 58-59 ]e
d de de b b e e
0 1 1 . (8) Since
4 2 T n T eb (9)where n is the refractive index of the medium and is the Stefan-Boltzmann constant, for
constant n , Eq. (9) can be written as
dS S dT T k qr r( ) (10)and the equivalent thermal conductivity for radiation is defined as
e m r T n k 3 16 2 3 (11)
where T is the arithmetic mean of the boundary temperatures.m
The mean extinction coefficient, , can be related to the transmittance of the media,as e
follows. The radiative heat transfer in an one-dimensional homogeneous planar system is
described by [59]
4 0 , , 4 i i i i s b a s a d S i S i S S i S S dS di (12)where i is the spectral intensity of thermal radiation.
energy. The solution is Eq.(5) given by Beer’s law, and a transmittance is defined by [59]
e S
exp (13)
where e
a s
is the spectral extinction coefficient. The equivalent thermal conductivity of radiation, k , can be experimently determined by Eq.(13), (8), and (11), as rdescribed in Sec. 3-2-3.
2-2 Foam Parameters of Partial Open Polystyrene Foam
2-2-1 Broken Cell Ratio
To further distinguish the contribution by solid and by gas, this study introduces a
broken cell ratio, , representing the ratio of broken cell volume to the total cell volume
f s f g s g s s s f g s f s t g s t tb b m m m m m V m V V V ( 14)where m is the mass of the sample, V is the apparent volume (total volume), t V is the s
volume of solid, Vsg is the volume of combined solid and gas in the unbroken cell, V is ub
the volume of gas in the unbroken cell, V is the vacuum volume inside the VIP (which b
actually contains air in extremely low pressure) or the broken cell volume, and V is the tb
volume of all the cells. The apparent density, or foam density, = f m /Vt, was measured
using the ASTM D-1622 method. The value = m / Vs+g sg = m / ( Vub + Vs) is the density of
the combined solid and gas in the unbroken cells. Note that this approach disgards the mass of
volume produces Vs+g. The former was measured by an AccuPyc 1330 Pycnometer with an
accuracy of 0.03 %. The term is the density of the solid, taken as the density of the raw s
polystyrene, which is 991.96( 3)
kgm .
2-2-2 Solid Volume Fraction
The solid volume fraction, fs, is the ratio of solid volume to the total volume and is
readily obtained by dividing the foam density of the sample by the polystyrene density.
) 1 ( 1 s g t s s f V V f (15)
CHAPTER 3
EXPERIMENTS
3-1 Sample Description
The samples were prepared by the following procedure. A mixture of polystyrene,
polyethylene, carbon black, and calcium stearate were put into a batch die of 400mm diameter
and subjected to a 40-ton press. A photo picture of the die and the press equipment is shown
in Fig. 3-1. After mixing with the molten mixture, foaming was performed by introducing
CO2 and R-134a into the die to form a supercritical fluid. The high pressure gas in the die was
released after 6 hours, forming a plain board measuring 250mm long × 250mm wide ×
6~26mm thick. After about an hour of heating, the material was enclosed by a metal foil
envelope, which was sealed after the enclosed air was evacuated to 10-4torr. The photo picture
is shown as Fig.3-2 Experiments were designed to vary the cell geometry of the samples by
modulating die temperature and gas pressure. Die temperature is controlled by heaters and is
maintained at a fixed temperature with a stability of ±0.5C throughout the process. Figure 3-3
shows the dual pressure control system that was able to separately control the pressure and the
amount of CO2 and R-134a. During the forming process, the gas pressure normally ranged
3-2-1 Air Pycnometer
The operation principle of air pycnometer is followed in accord with Boyle’s law
depicted the relationship that a increase in pressure of a confined gas should be proportional
to decrease in volume. The simplest type of air pycnometer essentially has two identical
equal-volume cylinders and pistons, A and B as shown Fig.3-4. The photo picture can be seen
in Fig.3-5. The cylinder B inserted a sample of PS foam. Pistons in both cylinders allow
volume change. When a sample of PS foam appears in the cylinder B, the decreased the
volumes results in the increased pressure. With the extent of this difference, the method of air
pynometer can determine numerical values for the percentage of volume occupied by open
cell PS foam. Detailed calculation procedure can take it reference as D 2856-70 Standard Test
method.
3-2-2 Fourier Transform Infrared (FTIR) Spectrometer
A Perkin-Elmer Spectrum 2000 Fourier Transform Infrared Spectrometer was used to
measure the infra-red transmission of the foam insulation specimen. The infra-red
transmission apparatus are made up of three basic parts:the light source unit, a spectral
radiation detector, and the sample cell. A deuterated triglycine sulfate (DTGS) with a
pyroelectric bolometer standard is using as the detector. It is noted that the spectrometer needs
nitrogen gas to purge and KBr windows to seal. KBr is the beam-splitter. A reference signal
empowers the spectrometer electronics to sample the interferogram at precise intervals. Fig.
3-6 is a schematic diagram illustrating the basic system. The photo picture of FTIR is shown
in Fig. 3-7. This spectrometer is the type using mechanical bearing of a fast scanning
Michelson interferometer which consists of a fixed mirror, a movable mirror, and a
beam-splitter. Beam-splitter equally divides the incident radiation into two beams. One
transmits to the moving mirror and the other reflects to the fixed mirror. Then, these two
beams are reflected from the mirrors back to the beam-splitter and recombine. Due to the two
beams travel different distances before recombining, an optical difference occurs. Because of
the position of moving mirror and the frequency of the retardation, it generates a pattern of
constructive and destructive interference. The varying optical path difference can be obtained
from the moving mirror which is driven at a constant velocity by a linear motor under
computer control. An interference pattern is obtained as the path difference. Finally, the
combined beam traverses the specimen to reach the detector. It converts the interferogram into
a single-beam spectrum by using a Fourier transform in the computer.
To begin the experiments, the specimen of PS foam is cut to less than monocellular
thickness. The heat flow direction of all specimens is perpendicular to the cutting planes. The
thickness of specimen is measured by micrometer gauge as shown in Fig.3-8.
The average cell size of each sample was calculated by a method in accordance with
3-2-3 Guarded-Hot-Plate System
The Guarded-Hot-plate System made by EKO Instruments trading company (model
HC-072) is used to measure the equivalent total thermal conductivity of VIP at 104 torr. The photo picture and schematic diagram of the guarded hot plate system are shown as
Fig.3-9 and Fig. 3-10, respectively. The Guarded-Hot-plate System consists of thickness
measurement sensor, hot and cold plates and heat-flow meter. Due to the effect of edge heat
losses and to the thermal unbalance between test section and guard ring, it is very important to
treat the specimen thickness and the hot plate dimensions (guard and gap width, side) in order
to less affect the errors in the measurement of thermal conductivity. The heat flow meter is a
simple, rapid and accurate device to sense that heat passes through the quantities of VIP. The
relative specification needs consult the standard of ASTM C518 and JIS 1412. Before
experiment, the sample of VIP places between two flat plates maintained at different
temperature. Then, the difference temperature between hot plate and cold plate sets
approximately 30 Ko . The heat flow meter and the copper-constantan thermocouples were
mounted on the center of hot and cold plates to sense the heat and the temperature. Using
P.I.D. digital heater controls temperature of hot and cold plates. Besides, the cold plate is
cooled by a 400W air cooling compressor type chiller. The standard reference material (SRM)
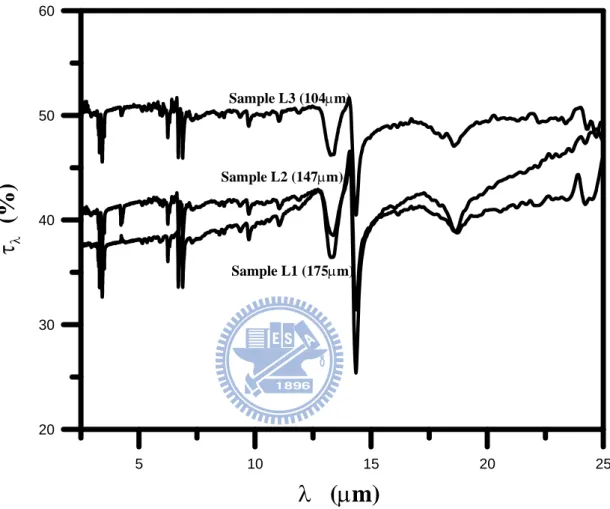
The spectrum transmittances of the samples were measured by a Perkin Spectrum 2000
Fourier Transform Infrared Spectrometer. For the measurement, a thinly sliced foam
specimen was subjected to normal incident irradiation in the wavelength range of 2.5 to
25 . The specimen was first put into an oven to remove its moisture and volatile organic m
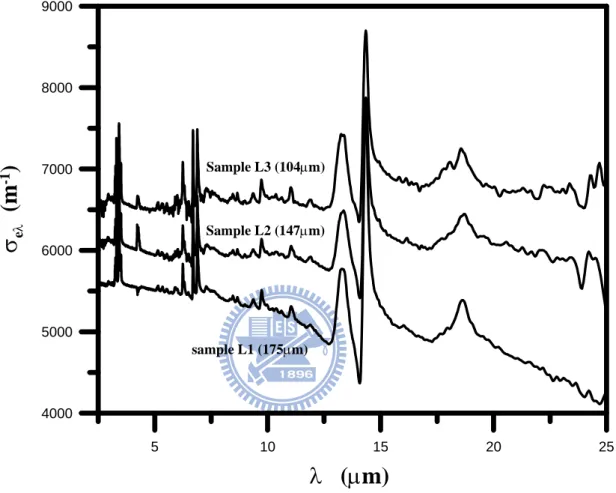
gas contents. With the measured transmittance, the spectral extinction coefficient is calculated
by Eq. (13). The term is then calculated by substituting e einto Eq. (8) and k is r
subsequently obtained by Eq. (11). With the knowledge of k and r k , t ksg can be inferred
from Eq. (4). Note that k and r ksgreveal the contribution by radiation and combined solid
and gas, respectively.
3-3 Experimental Procedure
The estimation of cell size based on the principle of ASTM D 3576-77 ( Standard test
method for cell size of rigid cellular plastics) is briefly described as below. Three
equally-spaced parallel lines and three equally-spaced vertical lines were plotted on the SEM
picture of the sample. Their lengths (in μm) were measured by a ruler. The line length divided
by the number of the cell counted along the line to obtain cell chord length. Average cell
chord length was calculated based on the information obtained from all the line. The averaged
cell size was then calculated by the relationship between cell size (cell diameter) and cell
and gas in the unbroken cells with eq. (14). The density of solid is taken as the density of the
raw polystyrene, which is 991.96(kgm-3). The density of foam is obtained by dividing the
sample weight by its total volume. To obtain the density of combined solid and gas in the unbroken cells, which is defined by (= m / Vs+g sg = m / ( Vub + Vs)), the combined volume
of unbroken cell and solid ( Vub + Vs) was first measured by an AccuPyc 1330 Pycnometer.
The AccuPyc 1330 Pycnometer consists of a sample volume cup (cylinder B), a valve (Valve
B) and an expansion volume device (Cylinder A) as shown in Fig.3-4. After a testing sample
was put into the sample volume cup, the system started to evacuate to below 0.1 torr. Piston A
and Piston B came to position 2 and Valve B was closed. Helium gas then filled into the
expansion volume device and Piston A moved to be position 1. A reference hand-wheel was
used to push the piston A back to the position 2. When the Valve B was opened, Helium gas
diffused into the Cylinder B. Because the testing sample adsorbed Helium within the voids of
the broken cells, Piston B moved to position 3. The volume between position 2 and position 3
was then the desired volume ( Vub + Vs). The weight (m) was measured by mass balance. Finally, fsg was obtained by dividing ( Vub + Vs) by V . Substituting t fsgand into the
eq.(15) led to f .s
3-4 Uncertainty Analysis
standards JIS A 1412 and ASTM 518. The device consists of a hot and a cold plate, thin film
heat-flow meters and a thickness measurement sensor. The temperature of center of hot and
cold plates was measured by the thermocouples. The 250mm long × 250mm wide ×
(6~26)mm thick samples were clapped between the hot and the cold plate with integrated heat
flow meters. The following formula is used to the thermal equivalent conductivity,
T S L E kt
where S is the sensitivity of heat-flow meter, T is the temperature difference between
the hot and the cold plate, E is the output of heat-flow meters, and L is the thickness of
the sample. The uncertainty is estimated based on the data of sample L ,3
5 . 0 2 2 2 2 2 2 T T k s s k q q k k t t t t t
5 . 0 2 2 2 2 2 8 . 22 6 . 6 00005 . 0 00646 . 0 6 . 6 02 . 0 34 . 23 6 . 6 k 0.05896
mW /mK
Therefore, the equivalent total thermal conductivity can be calculated by,
k/kt
0.05896/6.6
0.0089. That is, the uncertainty of measuring specimen totalthermal conductivity can be controlled to within 0.89%, as estimated by the method of Wu et al. [ 37 ].
Fig.3-1. The picture of the 40 tons press equipment and the 400mm diameter mold.
Fig.3-3. The dual pressure control system used to modulate the foaming pressure. CO2 N2 Booster Pressure reguator Pressure guage 1St. pressure tank Liquid tank Safety valve 2nd. pressure tank Valve Valve Pressure reguator Valve Valve Valve Valve Valve Valve Valve Check valve Check valve Foaming equipment
Fig.3-4. Schematic diagram of Air Pycnometer Position 1 Stop Sample Cylinder B Piston A Position 3 Position 2 Cylinder A Counter Valve A Valve B Piston B Reference Handwheel Measuring Handwheel Differential Pressure Indicator
Fig. 3-6 Schematic diagram of the Fourier Transform Infrared Spectrometer
light source
He-Ne laser
detector
coumputer sample compartment
interferometer optical signal
Fig.3-10. Schematic diagram of equivalent total thermal conductivity measurement system Hot Plate Specimen Cold Plate H ea t F lo w Chiller T em p er ra tu re C o n tr o ll er T h ic k n es s Terminal base Multi-channel A/D convertor Amp.
CHAPTER 4
RESULTS AND DISCUSSION
4-1 Polystyrene Foam Vacuum Insulation Panels
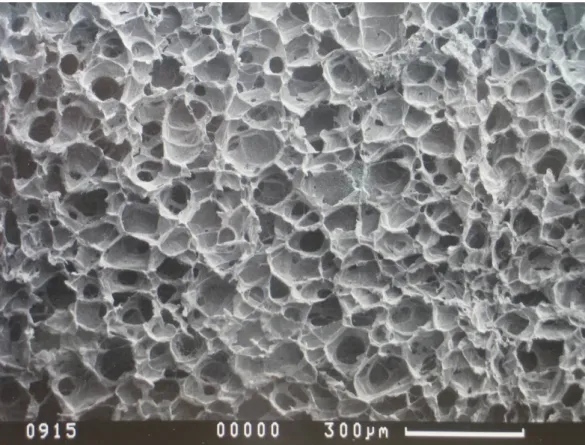
Figure 4-1 shows a SEM picture of the material sample. The structure typically consists of
struts, cell membranes, broken cells, and unbroken cells. A total of 14 samples were produced
for analysis in this study, all with partially open cell structures and broken cell ratios (see the
definition below) ranging from 90% to 98%.
Table 4-1 summarizes the measurement results of the 14 samples. The samples fall into
two distinct groups with different solid volume fraction. The first group has a lower solid
volume fraction (referred to as LSFG) and includes L1 to L6 with 0.0413<f <0.0494. The s
second group has a higher solid volume fraction (referred to as HSFG) and includes H1 to H8
with 0.0615<f <0.0706. The variation of solid volume fraction exerts a profound influence s
on VIP heat transfer, as explained later. Figures 4-2 and 4-3 show examples of spectral
transmittance and spectral extinction coefficient, respectively. Note that this spectrum does
not reveal CO2 absorption, which could occur at 2.7 , 4.3m , 9.4m , 10.4m , and m
15 , or Hm 2O absorption, which could occur at 2.7 and 6.3m . This indicates that the m
amount of CO2 and H2O trapped in the unbroken cells is insignificant in terms of influencing
4-1-1 The Relationship Description of Physical Properties
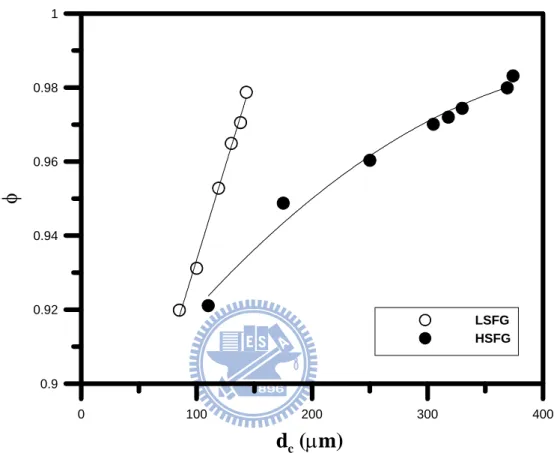
Figure 4-4 plots the broken cell ratio versus the cell size of the 14 samples. The data
visibly falls into two groups based on the solid volume fraction. The HSFG cell sizes are
typically larger than LSFG cell sizes. Both groups show an almost linear dependence of cell
size on open cell ratio. The trend in Fig. 4-4 can be explained by the fact that a higher solid
volume enables the cells to expand further before they are broken, and therefore they have a
larger cell size after foaming. On the other hand, to obtain a higher broken cell ratio, some of
the unbroken cells must be expanded further until they are broken. Consequently, this also
increases the average cell size.
4-1-2 The Effects of Foam parameters
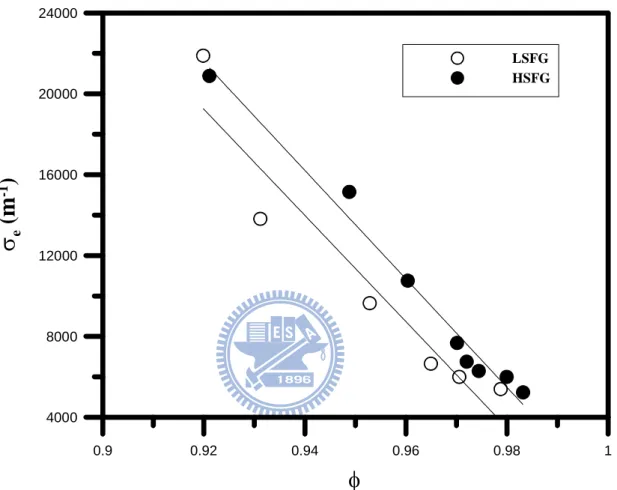
Figures 4-5 and 4-6 plots the Rosseland mean extinction coefficient data against
variations in cell size and broken cell ratio, respectively. All the extinction coefficient data
falls into a single straight line when plotted against the broken cell ratio, as Fig. 4-06 shows.
This indicates that the broken cell ratio is the dominant factor in determining the extinction
coefficient. The VIP extinction coefficient consists of two parts, the absorption part, , and
the scattering part, , that is, s e s. The former represents the absorption effect of
solid material and depends largely on the solid volume fraction. The latter is affected by the
broken cell ratio. For the 14 samples investigated in this study, the solid volume fraction plays
a minor role in determining the extinction coefficient, as Fig. 4-6 indicates. The group with a
higher solid volume fraction exhibits only a slight increase in extinction coefficient compared
with the lower solid volume fraction group, although the average solid volume fractions of the
two groups differ by more than 44% (0.045 to 0.065). This can be explained by the fact that
the solid volume fraction of the samples is so small that the extinction is dominated by
scattering and the contribution of absorption is insignificant. The apparent dependence of
extinction coefficient on cell size, as Fig. 4-5 shows, could be interpreted as the dependence
on broken cell ratio, since cell size and broken cell ratio are well correlated under a specific
volume fraction, as Fig. 4-4 indicates.
4-1-3 The Influences of Lower Solid Fraction
Figure 4-7 shows the equivalent thermal conductivities of the lower solid volume group,
including the total thermal conductivity, k , the thermal conductivity by solid conduction, t k , s
and the equivalent thermal conductivity by radiation, k . Figure 4-7 shows that as the cell r
size decreases, which creates more conduction transport routes in the solid material, solid
conduction increases. On the other hand, radiation decreases as the cell size decreases. Note
that the decrease in radiation (increase in extinction coefficient) is attributable to the change
In Fig. 4-7, the lowest total thermal conductivity is around 6.5 ( 1 1
K
mWm ), which occurs at
a broken cell ratio of approximately 0.95 and corresponds to a cell size of about 120 .m
4-1-4 The Influences of Higher Solid Fraction
Figure 4-8 shows the thermal conductivities of the higher solid volume fraction group,
with a trend similar to that in Fig. 4-7. The best broken cell ratio falls at around 0.97,
corresponding to a cell size of 300 , and results in the lowest total thermal conductivity of m
7.6 ( 1 1
K
mWm ). Similar dependence of total thermal conductivity on cell size is found in the
simulation work by Placido et al. [33], who assumed constant gas contribution in fully-closed
cell structures and concluded a best cell size of around 100 . However, they also m
concluded that the minimum total conductivity corresponds to the minimum radiative
conductivity in fully-closed cell structures [33], in contrast to the results of partially-open cell
structures in Fig. 4-7 and Fig. 4-8.
The total thermal conductivity of the lower solid volume fraction group (Fig. 4-7) is
generally lower than that of the higher solid volume fraction group (Fig. 4-8). This difference
is caused by a change in solid conduction, which accounts for more than 80% of the heat
transfer in the samples (see Fig. 4-7 and Fig. 4-8). The equivalent thermal conductivity of
radiation, which is generally responsible for less than 20% of the total heat transfer, shows a
proportion of radiative contribution to total heat transfer, namely, 20% of the total heat
transfer in vacuum are attributed to radiative transfer.
4-2
The Effects of PE Additive
Figure 4-1, 4-9 and 4-10 show typical SEM pictures of material samples with 0wt%,
2wt% and 5wt%PE, respectively. The structure typically consists of struts, cell membranes,
broken cells and unbroken cells. Table 4-2 summarizes the measurement results of the
samples without PE additive. The samples fall into two distinct groups with different solid
volume fraction. The first group, referred to as PE0L, has a lower solid volume fraction, and
includes PE0L1 to PE0L6 with 0.0413< f <0.0494. The second group, referred to as PE0H, s
has a higher solid volume fraction and includes PE0H1 to PE0H8 with 0.065< f <0.0706. s
Similar results of samples with 2.0wt% and 5.0wt% PE additive are also listed in Table 4-2,
respectively. Similar to the samples without PE additive in Table 4-2, each PE additive
contains two distinct groups with different solid volume fraction. The groups with higher solid
volume fraction are designated as PE2H and PE5H, and the groups with lower solid volume
fraction are designated as PE2L and PE5L, for the 2% and 5% PE samples, respectively. Note
that all solid volume fractions in the 42 investigated samples are extremely low (less than
0.07), indicating a good foaming process. Nevertheless, the distinction between high and low
Figures 4-11 and 4-12 show examples of spectral transmittance and spectral extinction
coefficient, respectively. Note that the spectra do not reveal any CO absorption, which 2
could occur at 2.7 , 4.3m , 9.4m , 10.4m , and 15m , or m H2O absorption, which
could occur at 2.7 and 6.3m . This indicates that the amount of m CO and 2 H2O
trapped in the unbroken cells is insignificant in terms of influencing radiation heat transfer.
This is reasonable since most of the cells in the samples are broken and evacuated.
4-2-1 The Relationship Description of Physical Properties with PE Additive
Figure 4-13 plots the broken cell ratio versus the cell size. Each group shows an almost
linear dependence of cell size on open cell ratio. Higher solid volume fraction is typically
associated with larger cell size for a given PE additive weight percentage. The trend can be
explained by the fact that a higher solid volume allows the cells to expand further before
breaking. In the meantime, in order to obtain a higher broken cell ratio, more of the unbroken
cells must be expanded further until they are broken, which also increases the average cell
size. Different slopes of the relationship between broken cell ratio and cell size for different
PE additive weight percentages in Fig. 4-13 are attributed to the effects of PE on the strength
of cell membranes. These effects are also responsible for the larger cell sizes of PE2 and PE5
when compared to PE0. PE0H is an exception because its solid volume fraction is too high,