國 立 交 通 大 學
交通運輸研究所
碩士論文
消費者對線上拍賣店配取貨點之選擇行為研究
Exploring the Choice Behavior on the Retailing
Delivery Provider for Online Auction
Consumers
指導教授: 馮正民 老師
黃昱凱 老師
研 究 生: 林欣萍 9636504
I 消費者對線上拍賣店配取貨點之選擇行為研究 學生:林欣萍 指導教授:馮正民 教授 黃昱凱 教授 國立交通大學 交通運輸研究所碩士班 摘要 網際網路的興起,電子商務成為重新整合供應者與消費者關係的新商業模式。 隨著網路購物普及化,資策會統計指出臺灣網路拍賣規模達516億,相較於去年 成長約五到六成之間。由此可見,線上拍賣的規模與成長不容小覷。然而,如何 與物流配送體系的配合,將網路交易商品交付到消費者手中是線上拍賣賣家所需 克服的問題之ㄧ。台灣由於超商高度聚集的特質,藉由多次配送及高度資訊化的 優勢而發展出以超商為基礎之「線上購物、超商取貨」物流模式,快速成為台灣 電子商務中最令人矚目的物流暨金流運作方式。 過去的文獻指出決定消費者選擇取貨點的主要因素,是超商的地點。就店配 物流服務提供者而言,想在取貨點數量固定以及物流績效相同的情況下擴大其市 場占有率,就有必要進一步深入了解消費者的選擇行為。因此,本研究想進一步 深入了解消費者的選擇行為,探知除時間與成本外,不同體系的超商所提供之物 流服務品質對消費者選擇行為之影響。根據隨機抽樣的調查數據,我們使用logit model與結構方程模式來進行分析。 研究結果發現,資訊品質與便利性是消費者選擇取貨點最重要的影響因素。 最後,針對分析結果,研擬對應策略以作為物流服務提供者增加市佔率之行銷策 略參考。 關鍵字:電子商務、線上拍賣、消費者行為、Logit 模式、結構方程模式
II
Exploring the Choice Behavior on the Retailing Delivery Provider for Online Auction Consumers
Student:Hsin-Ping Lin Advisors:Dr. Cheng-Min Feng
Dr. Yu-Kai Huang
Institute of Traffic and Transportation
National Chiao Tung University
ABSTRACT
The internet represents a growing and huge market. The development of e-commerce is an efficient business model which enables new relationship between consumers and suppliers. In particular, the auction (C2C) market is reaching NT $51.6 billion with an increase between 50% and 60%. The online auction is obviously becoming a noticeable market. However, how to deliver goods to customers becomes one of the challenges for the sellers. In Taiwan, convenience stores have integrated the e-commerce with the logistics system of convenience stores to a new retail delivery model: “Online shopping in an electronic store and pick-up goods in a convenience store”.
Previous researches proposed that the location of the convenience store and logistics service quality are major factors to influence consumers‟ choice behavior. Thus we combine SEM with binary logit model to incorporate latent variables into the choice model to understand the choice behavior of the online auction consumers and what constructs will affect to choose the retailer delivery provider.
The empirical results demonstrated that two variables- information quality and convenience are the key factors to impact on consumers to choose the RD provider. In accordance with these variables, we propose some marketing strategies to the managers of retailing delivery system to increase the market share.
III
誌謝
經過一年的扎根訓練,一年的投入,辛苦有了代價,終於完成了碩士論文, 為我的學生生涯畫下個完美的句點。這篇碩士論文之所以可以順利如期完成,一 切都要歸功於在我身邊一直陪伴我的師長、朋友以及家人,讓我在學術知識與個 人發展上都獲得許多充實與成長。首先,我要感謝我的兩位指導教授,馮正民老 師及黃昱凱老師,從一開始的碩士論文起頭的方向探索到之後的論文撰寫及問卷 資料的發放,兩位老師都給予我很大的幫助。在這段期間給予我許多書寫上的寶 貴意見,提供我一些論文的方向,把我導引到對的方向上,我十分感謝馮正民老 師與黃昱凱老師。接下來感謝口試委員康照宗老師的建議及溫馨的鼓勵,郭奕妏 老師深入的見解與指教。以及感謝博士班學長 jacky 學長、承憲學長及士軒學長, 幫我釐清研究方法上的問題點。因為各位老師、學長們的指教,加強了我在各方 面的專業知識及邏輯歸納能力,成為我獨立研究的基礎。 除此之外,感謝何姐在這些日子以來的陪伴與幫助,一同分享喜悅與悲傷, 給予我精神上的支持。感謝一同學習、一同成長、一同唱歌舒壓、一同歡樂出遊 的 ITT98 級的各位,在研究室裡共同的生活點滴,學術上的討論、言不及義的閒 扯、趕作業的革命情感,因為你們的陪伴讓兩年的研究生活變得絢麗多彩。 最後,感謝關心我健康,每次回家都會煮我愛吃的東西,一直給我精神上支 持的媽媽,以及在天上的爸爸,默默關心我的健康與安全,教導我正確的生活態 度。感謝大姐、孟薇、小莉、弟弟和 QQ 在這段時間當我的垃圾筒,分享我的喜 怒哀樂,帶給我許多歡樂,給我些建議,舒解我的情緒。你們總是在我最需要的 時候,即時送上加油與打氣,讓我可以繼續下去的勇氣,謝謝你們。 林欣萍 謹致 民國九十八年六月 于國立交通大學運輸研究所IV
Table of Contents
Table of Contents ... IV
List of Figures ... VI
List of Tables ... VII
CHAPTER1 INTRODUCTION... 1
1.1 Research Background and Motivation ... 1
1.2 Research Objectives ... 3
1.3 Research Methodology... 3
1.4 Research Scope ... 4
1.5 Research Procedures ... 5
CHAPTER2 LITERATURE REVIEW ... 7
2.1 Retailing Delivery ... 7
2.2 Consumer Behavior ... 10
2.2.1 Logistics Service Quality ... 10
2.2.1.1 Traditional Service Quality ... 10
2.2.1.2 Logistics Service Quality ... 12
2.2.1.3 Logistics Service Quality in Electronic Channels ... 15
2.2.2 Perceived Value and Perceived Sacrifice ... 16
2.2.3 Switching Cost ... 18
2.2.4 Customer Satisfaction ... 20
2.2.5 Customer Behavioral Intention ... 21
2.3 Discrete Choice Model with Latent Variables ... 24
CHAPTER3 METHODOLOGY ... 28
3.1 Research Framework... 28
3.1.1 Research Model of SEM ... 28
3.1.2 Research Framework of Integration Model ... 29
3.2 Constructs Measurement ... 30
3.2.1 Logistic Service Quality ... 30
3.2.2 Perceived Value ... 30
3.2.3 Perceived Sacrifice ... 31
3.2.4 Switching Cost ... 31
3.2.5 Customer Satisfaction ... 31
3.2.6 Customer Behavioral Intention ... 31
3.2.7 Information of Respondents ... 32
3.3 Questionnaire Design ... 35
V
3.5 Data Analysis Procedures ... 36
3.5.1 Descriptive Analysis ... 36
3.5.2 Factor Analysis ... 36
3.5.3 Reliability ... 37
3.5.4 Validity ... 38
3.5.5 Structural Equation Modeling (SEM)... 38
3.5.6 Logit Model ... 40
CHAPTER 4 DATA ANALYSIS AND RESULTS ... 42
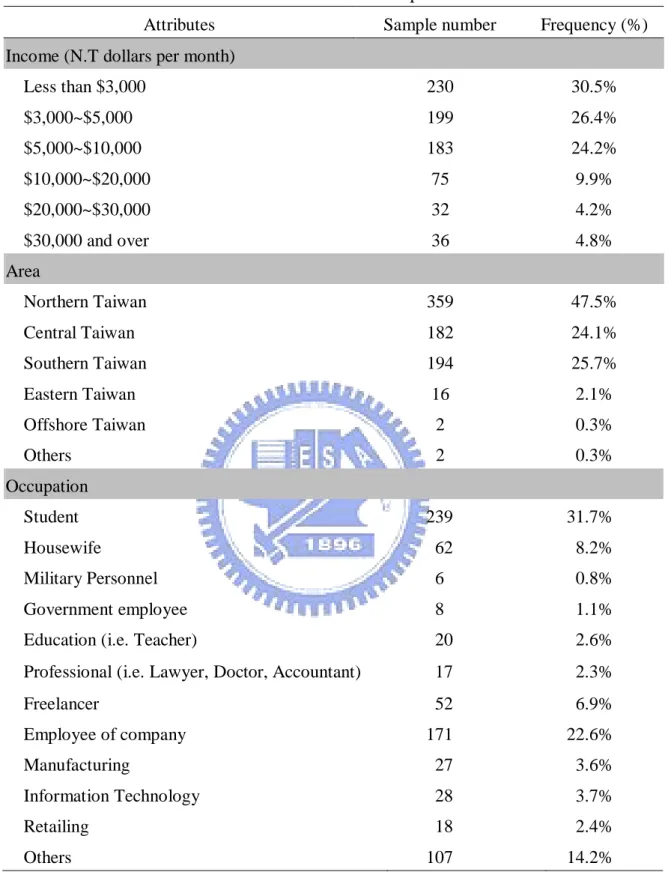
4.1 Descriptive Analysis ... 42
4.1.1 Characteristics of Respondents ... 42
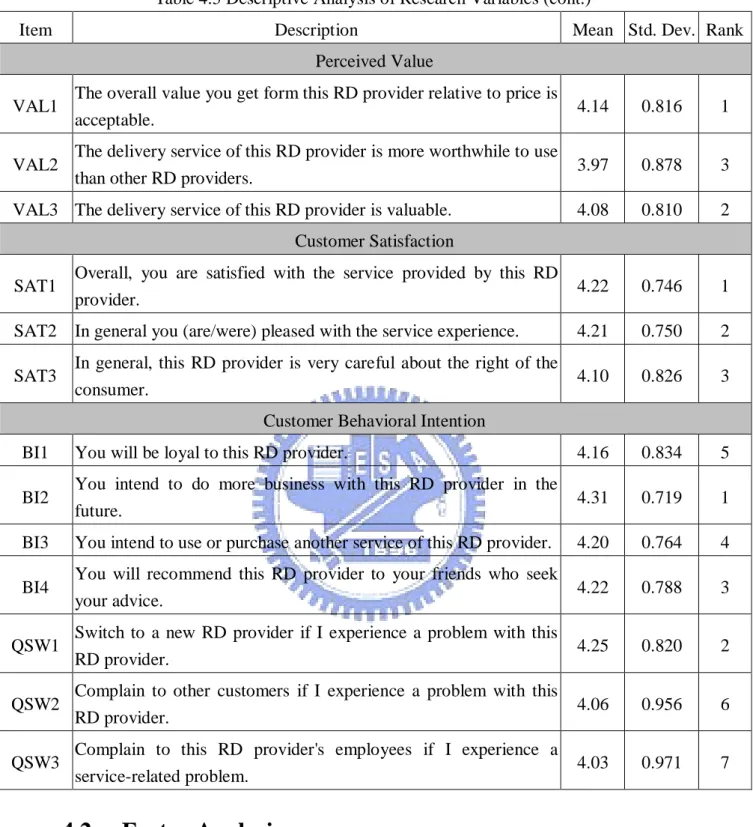
4.1.2 Measurement Results of Research Variables ... 45
4.2 Factor Analysis ... 47
4.3 Reliability Analysis ... 49
4.4 Validity Analysis ... 50
4.4.1 Logistics Service Quality ... 50
4.4.2 Perceived Value ... 52
4.4.3 Perceived Sacrifice ... 53
4.4.4 Switching Cost ... 54
4.4.5 Customer Satisfaction ... 55
4.4.6 Customer Behavioral Intention ... 56
4.5 Structural Equation Modeling ... 58
4.5.1 Model Test ... 58 4.5.2 Path Result ... 62 4.5.3 Effects Analysis ... 62 4.6 Logit Model ... 64 4.6.1 Variables Specification ... 64 4.6.2 Calibration Results ... 65 4.6.3 Simulation Results ... 67
CHAPTER5 CONCLUSION AND SUGGESTION ... 70
5.1 Conclusion ... 70
5.2 Suggestion ... 71
REFERENCE ... 73
VI
List of Figures
Figure 1.1 Research Scope ... 4
Figure 1.2 Research Procedure ... 6
Figure 2.1 Relationship of online auction of RD ... 8
Figure 2.2 Procedure of online shopping and picking-up at the convenience store ... 9
Figure 2.3 Theory of Planned Behavior (TPB) ... 22
Figure 2.4 A Contemporary View of Attitude ... 22
Figure 2.5 Four competing models ... 24
Figure 3.1 Research Model of SEM ... 29
Figure3.2 Research Framework ... 29
Figure 4.1 Convergent Validity of Logistics Service Quality ... 51
Figure 4.2 Convergent Validity of Perceived Value ... 53
Figure 4.3 Convergent Validity of Perceived Sacrifice... 54
Figure 4.4 Convergent Validity of Switching Cost ... 55
Figure 4.5 Convergent Validity of Customer Satisfaction ... 56
Figure 4.6 Convergent Validity of Customer Behavioral Intention ... 57
Figure 4.7 Structural Model ... 58
VII
List of Tables
Table 2.1 Refined PZB model ... 11
Table 2.2 SERVQUAL vs. SERVPERF ... 12
Table 2.3 The important attributes of logistics service ... 13
Table 2.4 Definitions of the nine concepts about LSQ ... 14
Table 2.5 A Typology of Consumer Perceptions of Switching Costs... 19
Table 3.1 Measurements of Research Constructs ... 33
Table 3.2 Measurements of Research Constructs (cont.) ... 34
Table 4.1 Profiles of the Sample ... 43
Table 4.2 Profiles of the Sample ... 44
Table 4.3 Profiles of the Sample ... 45
Table 4.4 Descriptive Analysis of Research Variables ... 46
Table 4.6 EFA Results for the Logistics Service Quality Scale ... 48
Table 4.7 Reliability Analysis of Research Variables ... 49
Table 4.8 Reliability Analysis of Research Variables (cont.) ... 50
Table 4.9 Convergent Validity of Logistics Service Quality ... 52
Table 4.10 Convergent Validity of Perceived Value ... 53
Table 4.11 Convergent Validity of Perceived Sacrifice ... 54
Table 4.12 Convergent Validity of Switching Cost ... 55
Table 4.13 Convergent Validity of Customer Satisfaction ... 56
Table 4.14 Convergent Validity of Customer Behavioral Intention ... 57
Table 4.15 Preliminary Model Fit ... 59
Table 4.16 Overall Model Fit ... 60
Table 4.17 Fit of Internal Structure ... 61
Table 4.18 Path Results of Research Model ... 62
Table 4.19 Path Effects of Research Constructs ... 62
Table 4.21 Effect Results of Research Constructs on BI ... 63
Table 4.22 Effect Results of Research Constructs on BI (cont.)... 64
Table 4.23 The Estimation Results of Binary Logit Model ... 66
1
CHAPTER1 INTRODUCTION
1.1 Research Background and Motivation
Digital technology has provided a new paradigm for our society and changed our lives through interaction with the Internet. As an efficient and flexible sales channel, companies can use auction sites to liquidate unwanted inventory, as well as to assist in pricing new products, acquiring new markets for low-margin items, and reaching markets that would be too costly using traditional distribution methods. Consumers can surf on the Internet, browse the information, and compare prices of diversified merchandise. The development of e-commerce is an efficient business model that enables new relationship between consumers and suppliers. Electronic stores are becoming popular for online shopping.
According to a January 2008 report established by the MIC1 in Taiwan, the online shopping market is anticipated to be NT $145.1 billion in 2008. In Particular, the auction (C2C) market is reaching NT $51.6 billion with an increase between 50% and 60%. Due to the economic recession in 2008, more and more consumers will be shopping through online auction markets (about 80% increase) and the average consumption amount in C2C market is NT $ 7,834 with a 4.3% increase. The online auction is obviously becoming a noticeable market.
As this percentage continues to increase, how to deliver goods to customers is a more critical activity in any business. In the Internet, consumers can place orders at any time any where through the Internet, and the delivery service response is expected to be fast. Therefore, e-retailing needs a quick-response logistics system to support the order deliveries. In Taiwan, convenience stores provide a 24-hour purchasing environment for consumers and are distributed everywhere with high-quality information system. Convenience stores in Taiwan have integrated e-commerce with the logistics system of convenience stores to a new retail delivery model: “Shop online in an electronic store and pick-up goods in a convenience store”, and have made many remarkable successes.
The retailing delivery (RD) system provides an easy online shopping process, safe method of payment and quick delivery service for e-retailing (Huang and Feng 2005, 2006, and 2007). The main retailing delivery providers in Taiwan are 7-11.com2
1
MIC, Market Intelligence Center was established in 1987, which is a division of Taiwan's Institute for Information Industry
2
2
and CVS.com3. CVS.com is a joint venture by four families of convenience stores including Family.com, Hi-Life.com, Okcvs.com and Nikomart.com4. In the present day, over 1,000,000 orders have been complete by the electronic commerce of the retail delivery model.
Because of the short development history and the data collection difficulty of E-commerce retail delivery, there are few studies about the E-commerce retail delivery. Feng and Haung (2005) proposed that various convenience stores provide the similar retail delivery service, so the location of the convenience store becomes a major factor for a consumer to decide the pick-up point. Since customers are the main resources of gaining profits, how to develop the differentiating strategies to maintain the existing customers with customer satisfaction and to obtain new customers becomes an important issue for convenience stores.
Customer satisfaction is fundamental to business (Sharma, Grewal, and Levy 1995). The quality of logistics service performance is an important key factor to create customer satisfaction. In the past decade, several investigations on the theoretical domain of service quality to a business-to-business context, especially in the area of logistics service quality, have been published (Stock and Lambert 1987; Sharma et al. 1995; Bienstock, Mentzer, and Bird 1997; Mentzer, Flint, and Hult 2001; Huang and Feng 2005). However, research on the retailing delivery for the online auction in C2C environment scarce in the literature.
Based on the above-mentioned research background and literature review, this study has three objectives. First, we explore the structure of the retailing delivery service of online auction market working within the framework of confirmatory factor analysis.
The second objective is to examine the relationships between logistics service quality, perceived value, customer satisfaction, switching costs and customer behavioral intention. The relationships between logistics service quality, perceived value, customer satisfaction and customer behavioral intentions have been discussed theoretically (Zeithaml 1988; Sweeney, Soutar, and Johnson 1997; Woodruff 1997; Cronin and Taylor 1992; Mentzer et al. 2001), but the switching cost is also a component in influencing the customer behavioral intention. In this study, we add this factor to observe the relationship between each other. The third objective is to integrate choice and latent variable model to incorporate psychological factors and to understand the crucial factors of logistics service quality that are important to affect consumers to choose an RD provider and provides information to help managers of RD do some marketing strategies to increase their market share.
3
http://www.cvs.com.tw
4
3
1.2 Research Objectives
Base on the research background mentioned above, there are five objectives for this study:
1. To explore the retailing delivery (RD) logistics service process in which shopping is done through the online auction and the goods are picked-up at the convenience store.
2. To investigate the relationship between logistics service quality, perceived value, perceived sacrifice, switching cost, customer satisfaction and customer behavioral intention.
3. Use the structure equation model (SEM) to explore the relationship between the logistics service quality and customer behavioral intention, as well as that between the logistics service quality, perceived value, and perceived sacrifice, customer satisfaction, switching cost and customer behavioral intention.
4. Use logit model to understand the consumers‟ choice behavior.
5. Provide suggestions on developing marketing strategies to the managers of retailing delivery system to increase market share.
1.3 Research Methodology
The purpose of this study is to understand the crucial factors of logistics service quality that are taken into account by consumers before choosing an RD provider. But in behavioral sciences, there are concepts of interest that are not well defined and cannot be directly measured, e.g. knowledge, ambition, or personality. These concepts are referred to as latent constructs. These constructs affect consumers‟ emotion, cognition and choice behavior. While there exists no operational models to directly measure these constructs, latent variable modeling techniques such as SEM are often applied to infer information about latent variables. Ben-Akiva et al. (1999) presented a rigorous and general methodology which integrated choice and latent variable model to model the theoretical framework by explicitly incorporating psychological factors and their influences on choices. Therefore, this research aims to combine SEM with binary logit model to incorporate latent variables into the choice model to understand the choice behavior of the online auction consumers.
4
1.4 Research Scope
Based on two classification schemes-Seller and Buyer, e-commerce can be placed into four categories: business-to-business (B2B), business-to-consumers (B2C), consumer-to-business (C2B), consumer-to-consumer (C2C). This study will focus on consumer-to-consumer (C2C) business model which concentrates on individual consumers to individual consumers‟ view of e-commerce, and find out the crucial factors influencing customers‟ behavioral intention.
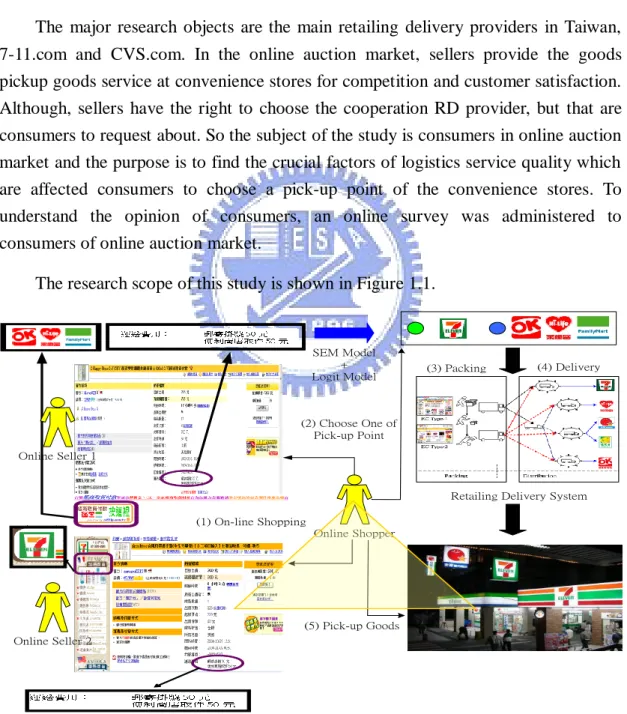
The major research objects are the main retailing delivery providers in Taiwan, 7-11.com and CVS.com. In the online auction market, sellers provide the goods pickup goods service at convenience stores for competition and customer satisfaction. Although, sellers have the right to choose the cooperation RD provider, but that are consumers to request about. So the subject of the study is consumers in online auction market and the purpose is to find the crucial factors of logistics service quality which are affected consumers to choose a pick-up point of the convenience stores. To understand the opinion of consumers, an online survey was administered to consumers of online auction market.
The research scope of this study is shown in Figure 1.1.
Online Shopper
Retailing Delivery System
(5) Pick-up Goods (2) Choose One of Pick-up Point (3) Packing (4) Delivery SEM Model + Logit Model (1) On-line Shopping Online Seller 1 Online Seller 2
5
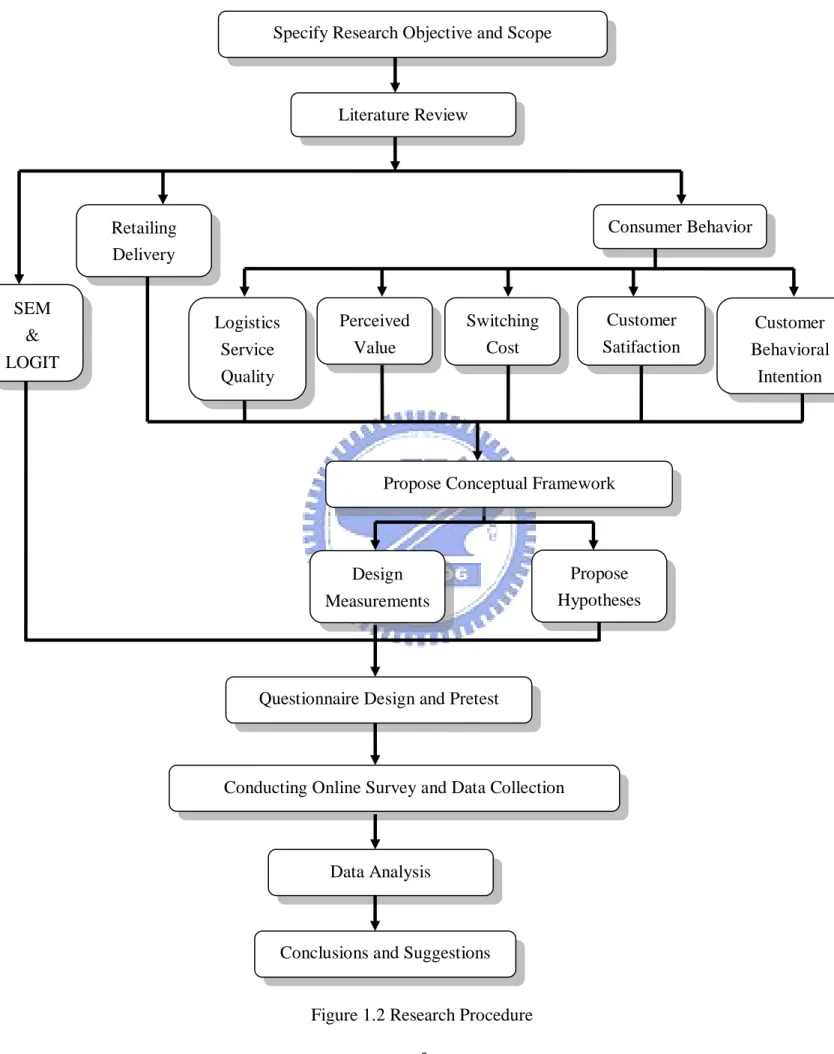
1.5 Research Procedures
In Chapter1, this study defines research objectives while explaining an outlook of this issue. The remaining of this study is organized as follows: Chapter2 firstly describes some background about retailing delivery (RD) system in C2C business model and reviews on previous related literatures for understanding the definitions and the interrelationships among logistics service quality, perceived value, customer satisfaction, switching cost and customer behavioral intention. Second, the scale of RD‟s LSQ will be developed by online consumers‟ opinion. Third, the construct measurements, the conceptual framework, and the hypotheses of this study were made up. Chapter3 presents the scope; introduces the research methodology and the impending research procedure. In Chapter 4, includes the descriptive results of measurement variables and the results of data analysis. Chapter 5 is a summary of the crucial findings and contributions of this study. Research limitations of this study are stated as well.
6
Figure 1.2 Research Procedure Data Analysis
Conclusions and Suggestions
Specify Research Objective and Scope
Literature Review
Questionnaire Design and Pretest
Conducting Online Survey and Data Collection Propose Conceptual Framework Retailing Delivery Logistics Service Quality Perceived Value Switching Cost Customer Satifaction Customer Behavioral Intention Consumer Behavior SEM & LOGIT Propose Hypotheses Design Measurements
7
CHAPTER2 LITERATURE REVIEW
The background of retailing delivery is reviewed first and then retraces the consumer behavior and definition of each research construct including logistics service quality, perceived value, and customer satisfaction, switching cost and customer behavioral intentions. Then, through the above studies a logistics service quality measuring scale of the retailing delivery (RD) in online auction market will be developed and then the interrelationships among research constructs will be developed. Finally, the discrete choice model with latent variables is illustrated.
2.1 Retailing Delivery
Online shoppers (consumers) make their orders at their office or home anticipating quicker delivery than offline purchasing, and timely delivery at convenient times. Feng and Huang (2007) pointed out that consumers can place orders at any time any where through the Internet in the online environment, so that the orders are unpredictable and dynamic, but the delivery service response is expected to be fast. Therefore, e-retailing needs a quick-response logistics system to support the order deliveries.
In Taiwan, most of the e-commerce-related delivery is operated by the third-party logistics provider (3PL). Because of the need for an information system and timely delivery system, low logistics operations cost and there are many convenience stores in Taiwan, 3PL providers have had to improve the flow of information both internally and externally and integrate their logistics services into the retail delivery provided by convenience stores. A new RD model proposed: “Online shopping with pick-ups at convenience stores.” The RD services have made many remarkable successes in portal sites such as Yahoo.com and Pchome.com.
The new RD providers in Taiwan are 7-11.com and CVS.com. CVS.com is a joint venture by four convenience stores including Family.com, Hi-Life.com, Okcvs.com and Nikomart.com that began service in the beginning of 2000, while 7-11.com joined the market at the end of 2000. Because the safe payment method and the quick delivery, RD services by convenience stores have played an important role in the e-commerce logistics in Taiwan. The relationship of online auction of RD is shown in Figure 2.1, which includes three functions: (1) e-map, (2) delivery system and (3) pick-up point (see Fig. 2.1).
8 DC (7-ELEVEN) Online Seller 1 . . . Online Seller 2 Online Seller j DC (FM, NK) DC (LF) DC-KYYO DC (FM, NK) DC (LF) Online auction (C2C) On-line Shopping & Packing Process
Delivery Process Pick-up points
Figure 2.1 Relationship of online auction of RD
The RD system provides an easy online shopping process, a safety payment method, pick-up points of convenience stores and quick delivery service for online consumers. The RD system has two characteristics: consumers can shop online even without a credit card and it provides consumers with a self pick-up approach through convenience stores. The procedure that combines online auction with online sellers, online buyers and RD system is illustrated below and shown in Figure 2.2:
1. Online shopping
The online sellers in Taiwan mostly have provided RD service (e.g., home delivery and pickup at the convenience store). In the part of pick-up at the convenience store, the sellers have the right to decide their RD provider, 7-11.com or CVS.com. Then the online consumers trade with the sellers who provided the pick-up point of convenience store where the consumers want to pick-up goods.
2. Choose a pick-up point
After finishing the transaction, 7-11.com or CVS.com will be shown on the website. The buyer should select the pick-up point on the e-map provided by the RD system.
3. Packing process
After the seller confirms the orders, the seller would finish the packing process (e.g., pick goods, print invoice and package), and dispatch the goods to the selected convenience store (e.g., Family.com, Hi-Life.com, Okcvs.com), that is provided by
9
CVS.com system or wait the delivery centre to receive the goods and transport the goods to the delivery centre, that is provided by 7-11.com system.
4. Delivery process
The delivery centre of CVS.com system collects the orders form different convenience stores and transports the orders to the convenience store (pick-up point of the orders) and then replies the completed information to the system and online sellers. The delivery centre of 7-11.com system also receives information from sellers‟ place and transports the orders to the 7-11 convenience store (pick-up point of the orders) and then replies the completed information to the system and online sellers.
5. Picking-up Goods
According to the reply information, the system will notify the buyer by e-mail or cell phone massage about the pick-up status of goods.
In General, the consumers order the goods on D day the seller will proceed to pack and dispatch the goods on the D+1 day, and the consumers can pick the goods from the convenience store on the afternoon of the D+3 day, or the D+5 day if there it involves a weekend.
On-line shopper (seller)
On-line shopper (buyer)
Retailing Delivery Logistics Service Quality Choose one cooperation system On-line shopping Pick-up goods To dispatch On-line auction
10
2.2 Consumer Behavior
Choice behavior can be characterized by a decision process, which is informed by perceptions and beliefs based on available information, and influenced by affect, attitudes, motives, and preferences. Thus the behavioral intention is the most important indicator in the choice behavior. Previous researches focused on the cause-and effect relationships between service quality, perceived value, satisfaction, switching cost and behavioral intention. Those constructs will be defined and described in the following.
2.2.1
Logistics Service Quality
In this section, a review of theoretical background of service quality including both physical and virtual marketplace, and the measured scale of logistics service quality of RD system in the online auction market will be developed and presented.
2.2.1.1 Traditional Service Quality
The last few decades have seen a growing interest in the definition, modeling, and measurement of service quality.
Parasuraman, Zeitithaml and Berry (1985) proposed that service quality has four distinguishing characteristics: (1) Service quality is more difficult for the customer to evaluate than the quality of goods; (2) Service quality perceptions result from a comparison of consumer expectations with actual service performance; (3) Quality evaluations are not made solely on the outcome of a service; they also involve evaluations of the process of service delivery; (4) Services cannot be stored and carried forward to a future time period.
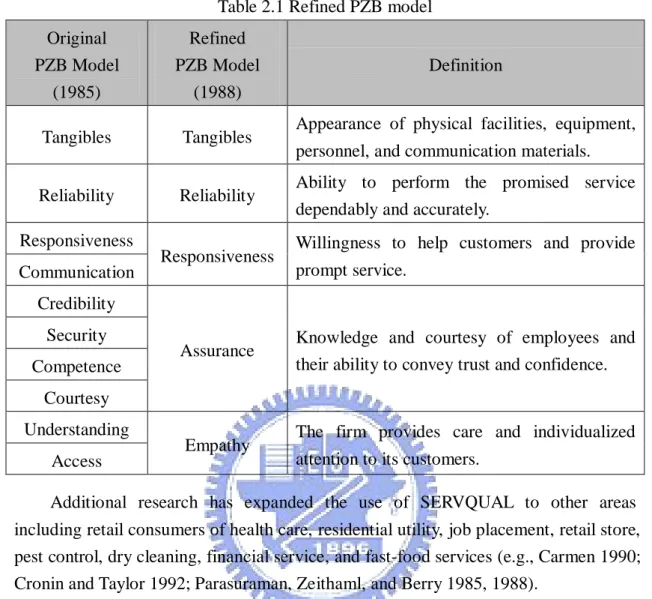
Parasuraman et al. (1985) proposed that service quality is a function of the gap between expected service and perceived service. They developed a model of service quality by an exploratory investigation of quality in four retail consumers including appliance maintenance, retail banking, securities brokers, and credit card services. This model is based on the gaps between consumers and marketers, and it is widely called the “PZB model” or “GAP model”. According to the study, ten key dimensions about service quality were introduced in 1985, and then refined into five dimensions named SERVQUAL in 1988 for measuring customers‟ subjective perception of service quality as shown in Table 2.1.
11
Table 2.1 Refined PZB model Original PZB Model (1985) Refined PZB Model (1988) Definition
Tangibles Tangibles Appearance of physical facilities, equipment, personnel, and communication materials.
Reliability Reliability Ability to perform the promised service dependably and accurately.
Responsiveness
Responsiveness Willingness to help customers and provide prompt service.
Communication Credibility
Assurance Knowledge and courtesy of employees and their ability to convey trust and confidence. Security
Competence Courtesy Understanding
Empathy The firm provides care and individualized attention to its customers.
Access
Additional research has expanded the use of SERVQUAL to other areas including retail consumers of health care, residential utility, job placement, retail store, pest control, dry cleaning, financial service, and fast-food services (e.g., Carmen 1990; Cronin and Taylor 1992; Parasuraman, Zeithaml, and Berry 1985, 1988).
Several researchers have criticized SERVQUAL. For example, the estimation of customer perception may already include perception minus the expected mental process, and SERVQUAL applications in different industries reveal that 5 dimensions may not cover the aspects of customer service present in all service encounters.
Carman (1990) proposed that those categories should be specifically defined to measure the quality to meet the retailing consumers‟ attributes.
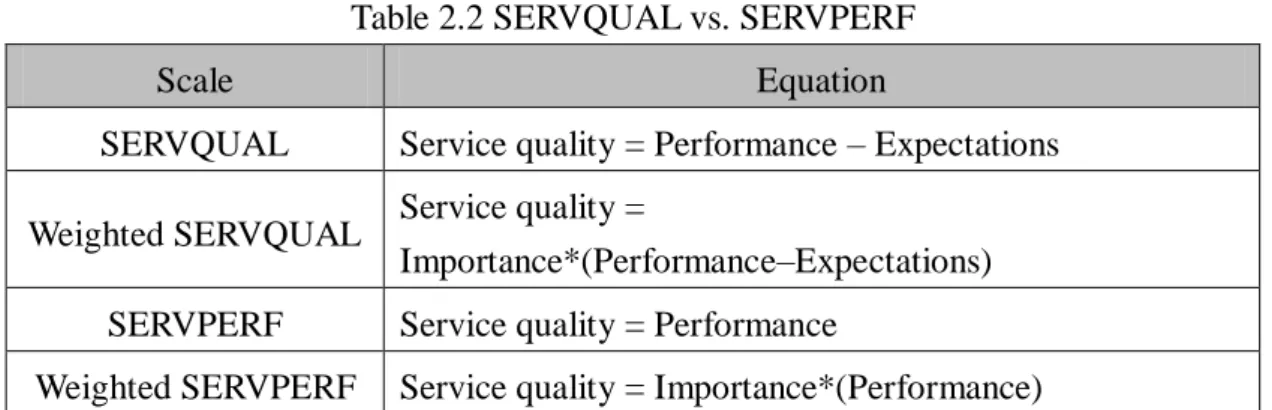
Cronin and Taylor (1992) suggested that it is not required to measure the customer expectations in service quality, thus the conceptualized model based on the performance measurement, named SERVPERF. It is an efficient predictor of service quality in comparison with the disconfirmation-based (SERVQUAL) measurement. Four alternatives shown in Table 2.2 were proposed for investigation.
12
Among these four scales, the empirical analysis of Cronin and Taylor support that SERVPERF approach is an enhanced means of measuring service quality.
Table 2.2 SERVQUAL vs. SERVPERF
Scale Equation
SERVQUAL Service quality = Performance – Expectations
Weighted SERVQUAL Service quality =
Importance*(Performance–Expectations) SERVPERF Service quality = Performance
Weighted SERVPERF Service quality = Importance*(Performance)
Current researches start to show more and more support for the exclusion of expectations in measuring service quality (Mentzer, Flint, and Hult 2001). The theoretical background of service quality is moving from expectancy disconfirmation to the theory of reasoned action (Collier and Bienstock, 2006). The theory of reasoned action states that individuals‟ behavior can be predicted from their attitudes about the behavior and subjective norms (Ajzen and Fishbein, 1980).
2.2.1.2 Logistics Service Quality
Logistics excellence has clearly been recognized as an area in which firms can create competitive advantage, in part because of its visible service impact on customers (Bienstock, Mentzer, and Bird 1997). To successfully leverage logistics as a competitive advantage to customers, logisticians must coordinate with marketing (Mentzer and Williams 2001). The quality of logistics service performance is a key marketing component that helps create customer satisfaction (Bienstock et al. 1997), develop market segmentation strategies (Mentzer et al. 2001), and has been recognized as such for some time (Perrault and Russ 1974).
There are many definitions and descriptions of how logistics creates customer satisfaction. The most traditional are based on the creation of time and place utility (Perrault and Russ 1974). The so-called seven Rs describe the attributes of the company‟s product/service offering that lead to utility creation through logistics service; that is, part of a product‟s marketing offering is the company‟s ability to deliver the right amount of the right product at the right place at the right time in the right condition at the right price with the right information (Stock and Lambert 1987). This conceptualization implies that part of the value of a product is created by logistics service.
However, these all focus on the provider firm, not on the customer. Although this research incorporates internal and external customers, it predominantly involves
13
provider firms-that is, how logistics executives and quantify the value they create for customers. A process is needed to measure customers‟ perceptions of the value created for them by logistics service, because it is the customers‟ perspective of service quality that determines their satisfaction level.
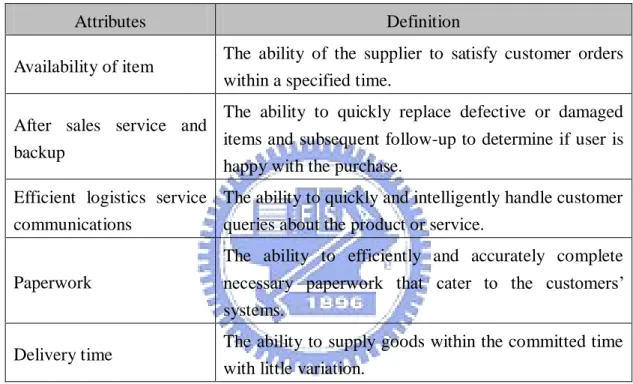
Sharma, Grewal, and Levy (1995) identified major areas of logistics service and summarized five attributes which are consistently ranked as very important by customers: availability of item, after sales service and backup, efficient logistics service communications, paperwork, and delivery time, illustrated in Table 2.3.
Table 2.3 The important attributes of logistics service
Attributes Definition
Availability of item The ability of the supplier to satisfy customer orders within a specified time.
After sales service and backup
The ability to quickly replace defective or damaged items and subsequent follow-up to determine if user is happy with the purchase.
Efficient logistics service communications
The ability to quickly and intelligently handle customer queries about the product or service.
Paperwork
The ability to efficiently and accurately complete necessary paperwork that cater to the customers‟ systems.
Delivery time The ability to supply goods within the committed time with little variation.
Source: Sharma et al. (1995).
Mentzer, Gomes, and Krapfel (1989) argued that two elements exist in service delivery: marketing customer service and physical distribution service (PDS). Here, PDS is composed of three crucial components: availability, timeliness, and quality. Mentzer et al. (2001) view PDS as a component of LSQ.
Bienstock, Mentzer, and Bird (1997) proposed that business-to-business logistics services are offered in a context in which people are replaced with “things”, and the customer and provider are physically separated. They maintain that the former is appropriate for the SERVQUAL‟s emphasis on “functional or process dimensions”, but the latter logistics service context is composed more of “technical or outcome dimensions”. They conclude that an alternative conceptualization of physical distribution service quality (PDSQ) dimensions: availability, timeliness, and condition with service quality process are necessary for logistics service quality. Mentzer et al. (2001) view PDSQ as a component of the broader concept of LSQ.
14
Mentzer, Flint, and Kent (1999) conceptualized and tested LSQ as a second-order construct, with two categories of nine dimensions:
Order placement-personnel contact quality (PQ), order release quantities (OR), information quality (IQ), ordering procedures (OP), and
Order receipt-order accuracy (OA), order condition (OC), order quality (OQ), order discrepancy handling (OD), timeliness (TI) (Table 2.4).
Table 2.4 Definitions of the nine concepts about LSQ Logistics Service Quality Definitions
Personnel contact quality
The customer orientation of the supplier‟s logistics contact people. Customers care about whether customer service personnel are knowledgeable, empathize with their situation, and help them resolve their problems.
Order release quantities
Product availability. Customers should be the most satisfied when they are able to obtain the quantities they desire.
Information quality
Customers‟ perceptions of the information provided by the supplier regarding products from which customers may choose.
Ordering procedures The efficiency and effectiveness of the procedures followed by the supplier.
Order Accuracy How closely shipments match customers‟ orders upon arrival.
Order condition The lack of damage to orders.
Order quality How well products work, includes how well they conform to product specifications and customers‟ need. Order discrepancy handling How well firms address any discrepancies in orders
after the orders arrive.
Timeliness
Whether orders arrive at the customer location when promised. The length of time between order placement and receipt.
Source: Mentzer et al. (2001).
Mentzer et al. (2001) proposed and tested a “process of LSQ” and found that all nine components were important for at least one of the customer segments tested. This research revealed that LSQ is a complex concept demanding a great deal of attention
15
from supplying firms. They also found that LSQ is a process, rather than a single concept or second-order construct. When viewed as a process, suppliers can identify the drivers of various LSQ perceptions.
PZB‟s SERVQUAL scale has been widely tested in various conventional marketplaces and received good empirical results. It has also been argued that, however, it is improper to directly employ SERVQUAL on the area of logistics service quality. Logistics services not only include cycle time, on time delivery, and inventory availability, but also any handling of individual customer requests beyond traditional service measures (Davis and Mentzer, 2006).
2.2.1.3 Logistics Service Quality in Electronic Channels
From the above studies, we deal with the quality of all non-Internet-based customer interactions and experiences with companies. In the Internet, it offers an efficient and flexible sales channel to sellers and consumers, but how to provide a quick-response logistics system to support the order deliveries for sellers is a critical activity to RD provider. Therefore, an important research question is, How to measure LSQ in electronic channels provided by the RD provider?
Before this research question can be answered, we need to know more about how to measure the e-service quality. Zeithaml, Parasuraman, and Malhotra (2000) defined the e-service quality as the service quality on the Internet which is the extent to a website that facilitates efficient and effective shopping, purchasing, and delivery of products and services. Zeithaml et al. (2000, 2002) used the means-end framework as a theoretical foundation to develop and test e-SERVQUAL for measuring the service quality delivered by Web sites and they also split the scale into two separate parts in 2005:
E-S-QUAL- the core dimensions: efficiency, system availability, fulfillment, and privacy;
E-RecS-QUAL- responsiveness, compensation, and contact, focused on the recovery part.
Collier and Bienstock (2006) measured the service quality in E-Retailing and they developed a conceptual framework of e-service quality. The purpose of this study not only focused on website interactivity or process quality but also outcome quality and recovery quality. It consisted three second-order dimensions and eleven first-order dimensions:
16
Process quality-privacy, design, information accuracy, ease of use, and functionality;
Outcome quality-order timeliness, order accuracy, and order condition;
Recovery-interactive fairness, procedural, and outcome fairness.
According to the above researches, the SERVQUAL and SERVPERF models can measure service quality well in offline environments, but online service quality reflects different characteristics from physical environments, for example, connectivity and server problems (Collier and Bienstock, 2006).
Following the precedent literatures, several logistics researchers focus on the service quality of e-retailing or home delivery of e-retailing, and develop the scale for measuring home delivery logistics service quality (Mentzer et al., 2001, Collier and Bienstock, 2006), or the service quality of Internet (Parasuraman et al., 2000, 2002, and 2005). Recently, Feng, Zheng, and Tan (2007) developed and tested LSQ with seven dimensions on online shopping malls including timeliness quality, personal contact quality, order quality, order discrepancy handling, order condition and convenience. Feng and Huang (2003, 2006, and 2007) revealed business-to-customers logistics services at the retailing delivery and developed five LSQ components including information quality, ordering procedures, timeliness, order condition and order discrepancy handling, and used AHP and SEM to analyze consumers‟ behavioral intention about online shopping.
However, in the customer-to-customer environment, research on the logistics service quality of online auction market and pick-up goods at a convenience stories relatively scarce. Therefore, this study tries to develop the definition and measurement of LSQ based on the research focused on shopping in the online auction market and pick-ups at convenience stores.
2.2.2 Perceived Value and Perceived Sacrifice
How to create value or value added has been often treated as the main part of organization‟s mission statements and objectives. Evidence for delivering superior customer value is an essential strategy for firms to gain competitive advantage and long-term success (Parasuraman 1997).
Zeithaml (1988) proposed the definition of perceived value which is the consumer‟s overall assessment of the utility of a product based on the perceptions of what is received and what is given. Zeithaml follows the exploratory study to group the perceived value into four consumer definitions of value: (1) value is low price, (2)
17
value is whatever I want in a product, (3) value is the quality I get for the price I pay, and (4) value is what I get for what I give. In short, the value represented a trade-off between give (price) and get (quality) components and it also provides a comparison of benefits and sacrifices. The sacrifice can be described as consumers sacrifice of both money and other resources (e.g., time, energy, effort) to acquire a service/product, so that the measured scale of sacrifice includes monetary prices and nonmonetary prices.
Bolton and Drew (1991) followed Zeithaml‟s (1988) concept of perceived value to define perceived value as a function of service quality, sacrifice, and customer characteristics. Due to the monetary and nonmonetary cost and customer preference and past experience, the evaluation of perceived value from customers is different to each other.
Monroe (1990) argued that perceived value is a trade-off between perceived benefits. The equation can be developed as:
Perceived Value = Perceived Benefits/ Perceived Sacrifices
According to the above studies, this study defines perceived value as an overall feeling of the RD service and perceived sacrifice as the consumers sacrifice to both money and nonmonetary costs to acquire a service/product. So we regard perceived value as a uni-dimensional construct to measure customers‟ overall feelings and use a multidimensional scale to measure the sacrifice including monetary prices and nonmonetary prices (e.g., time, energy, and effort) in this study.
Following Zeithaml (1988) and Bolton and Drew (1991) views, service quality is directly associated with perceived value, and perceived value will be influenced by service quality, sacrifice, and customer characteristics.
Sweeney, Soutar, and Johnson (1996) adopted Gronroos‟ (1983, 1988, and1990) concept of service quality, divided service quality to two types: technical quality and functional quality. The empirical study showed that the functional quality would be through the perceptions of product quality and the perceptions of value to affect the willingness to buy.
Based on the above researches, we examine the following hypotheses regarding service quality, perceived value, and perceived sacrifices:
H1: perceived sacrifices have a direct, positive effect on perceived value.
H2: service quality has a direct, positive effect on perceived value.
18
2.2.3 Switching Cost
Switching costs refer to the buyer‟s perceived costs of switching from the existing to a new supplier (Heide and Weiss 1995). The domain of switching costs encompasses both monetary expenses and nonmonetary costs (e.g., time spent and psychological effort) (Dick and Basu 1994). Furthermore, the domain could include the loss of loyalty benefits as a result of ending the current relationship. (Lam, Shankar, and Murthy 2004). Thus, as switching costs increase, the intention of customer loyalty increases.
Burnham, Frels, and Mahajan (2003) based on the literature reviews to distinguish the switching cost to eight facets, and comprised into three higher-order types. Show on Table 2.6. The study of Burnham et al. proposes that the regression intercepts to represent switching costs not only combines the effects of multiple switching cost types but also confounds switching costs with other possible influences on repeated purchase behavior.
Jones, Mothersbaugh, and Beatty (2000) argued that switching barriers including interpersonal relationships, perceived switching costs, and the attractiveness of alternatives are important factors impacting the decision of a customer to remain with a service provider. They also found that the effect of core service satisfaction on repurchase intentions was reduced when customers perceived high switching barriers. That is, when it is under the conditions of high switching barriers, the influences of core-satisfaction on repurchase intentions decreases.
Therefore, based on the above researches, this study defines switching cost as the costs of switching from the existing to a new supplier (e.g., time spent and learning cost) and examines the following hypothesis regarding switching cost, and customer behavioral intention:
H4: the cost of switching RD provider has a direct, positive effect on customer behavioral intention.
19
Table 2.5 A Typology of Consumer Perceptions of Switching Costs
Types Facets Definition
Procedural Switching Costs
Economic risk costs
The costs of accepting uncertainty with the potential for a negative outcome when adopting a new provider about which the consumer has insufficient information including performance risk, financial risk, and convenience risk.
Evaluation costs
The time and effort costs associated with the search and analysis information needed to make a switching decision.
Learning costs
The time and effort costs of acquiring new skills or know-how in order to use a new product or service effectively.
Setup costs
The time and effort costs associated with the process of initiating a relationship with a new provider or setting up a new product for initial use.
Financial
Switching Costs
Benefit loss costs
The costs associated with contractual linkages that create economic benefits for staying with an incumbent firm.
Monetary loss costs
The onetime financial outlays that are incurred in switching providers other than those used to purchase the new product itself.
Relational Switching Costs
Personal relationship loss costs
The affective losses associated with breaking the bonds of identification that have been formed with the people with whom the customer interacts.
Brand relationship loss costs
The affective losses associated with breaking the bonds of identification that have been formed with the brand or company with which a customer has associated.
20
2.2.4 Customer Satisfaction
Customer satisfaction is fundamental to the practice of consumer sovereignty. However, the definition of consumer satisfaction is not so clear in the marketing literature (Tomiuk, 2000; Spreng and Mackoy, 1996). While there is not a clear consensus regarding the definition of satisfaction, most definitions would involve “an evaluative, affective, or emotional response” (Oliver, 1989). Tse and Witon (1988) view satisfaction as the customer‟s response to the evaluation of perceived discrepancy between prior expectations and the actual performance of the product as perceived after its consumption.
There always existed two viewpoints for evaluating customer satisfaction: transaction-specific (multiple items scale) and cumulative (overall satisfaction). While transaction-specific satisfaction is identified as a post-choice evaluative judgment of a specific purchase occasion (Oliver, 1980), cumulative satisfaction is an overall evaluation of the firm‟s past, current, and future performance (Oliver, 1996; Rust and Oliver 1994). In this study, we define customer satisfaction as an overall satisfaction of the RD service and regard customer satisfaction as a uni-dimensional construct to measure customers‟ overall feelings.
There seems to be consensus that customer satisfaction and service quality are unique constructs, but distinctions in their definitions are not always made clear in the literature. The lack of clarity in the definitions of service quality and customer satisfaction is linked to the ongoing controversy surrounding the causal order of service quality and customer satisfaction.
Oliver (1993) proposed a model that is intended to integrate the satisfaction and the service quality. He proposes that while service quality is formed by a comparison between ideals and perceptions of performance regarding quality dimensions, satisfaction is a function of the disconfirmation of predictive expectations regarding both quality dimensions and non-quality dimensions. Further, perceived service quality is proposed to be an antecedent to satisfaction (Wilkie, 1986; Cronin, 1992).
Therefore, based on the above researches, this study defines customer satisfaction as the customer‟s response to the evaluation of the perceived discrepancy between prior expectations and the actual performance of the product as perceived after its consumption and examines the following hypothesis regarding service quality and customer satisfaction:
H5: service quality has a direct, positive effect on customer satisfaction.
21
impact on the customers‟ overall satisfaction. Brady, Knight, Cronin, Hult, and Keillor (2005) tested the conceptual effects of quality, satisfaction, and value on consumers‟ behavioral intentions across multinational and multi-setting environments. They found that service value perceptions strongly affect customer satisfaction. Thus, that, examines the following hypothesis regarding service value and customer satisfaction:
H6: perceived value has a direct, positive effect on customer satisfaction.
2.2.5 Customer Behavioral Intention
Consumer behavior is an integrated science; it includes economics, marketing, psychology and sociology. American Marketing Association (AMA) defined consumer behavior as a dynamic relationship between the interaction of emotion, cognition and behavior. That also means that consumer behavior includes the feelings and thoughts experienced by consumers and the behavior during their buying process. At the same time, it also includes environment which affect consumers‟ emotion, cognition and behavior, like the comments of other consumers, advertisement marketing, product price information, package, and product appearance.
Two popular theories of consumer behavior are theory of reasoned action (TRA) proposed by Ajzen and Fishbein (1975) and the theory of planned behavior (TPB) proposed by Ajzen (1991). Both theories mean that attitude affects intention then intention affects behavior shown in Figure 2.2. Ajzen and Fishbein defined attitude, intention and behavior as follow:
Attitude: it is continuous trend that people like or dislike particular object through studying or experience.
Behavior intention: subjective possibility of executing particular behavior, it reflects personal intention of particular behavior.
22
Affect Feedback
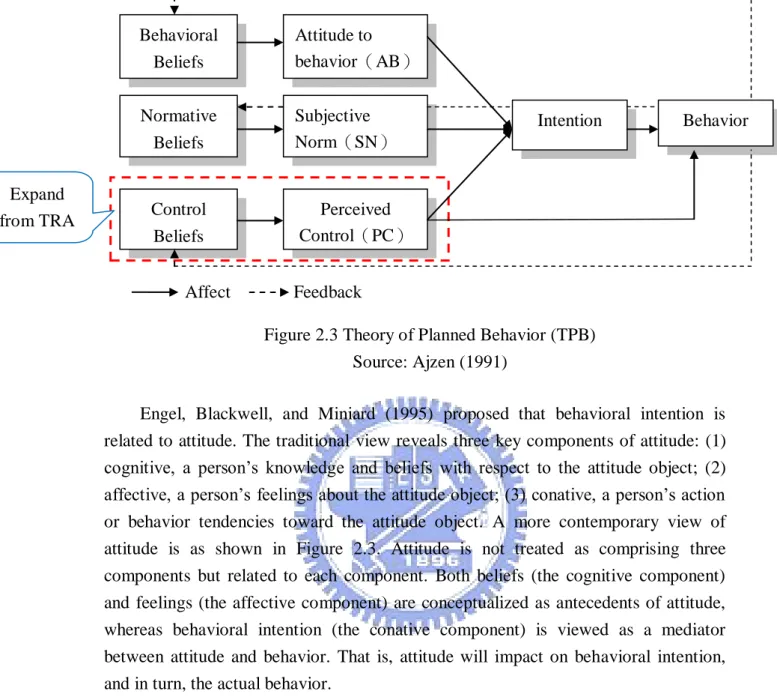
Engel, Blackwell, and Miniard (1995) proposed that behavioral intention is related to attitude. The traditional view reveals three key components of attitude: (1) cognitive, a person‟s knowledge and beliefs with respect to the attitude object; (2) affective, a person‟s feelings about the attitude object; (3) conative, a person‟s action or behavior tendencies toward the attitude object. A more contemporary view of attitude is as shown in Figure 2.3. Attitude is not treated as comprising three components but related to each component. Both beliefs (the cognitive component) and feelings (the affective component) are conceptualized as antecedents of attitude, whereas behavioral intention (the conative component) is viewed as a mediator between attitude and behavior. That is, attitude will impact on behavioral intention, and in turn, the actual behavior.
Zeithaml, Berry, and Parasuraman (1996) used multiple measures of service quality and behavioral intentions. The behavioral intentions construct split broadly into favorable and unfavorable behavioral intentions. Favorable behavioral intentions include several specific elements such as saying positive things, recommending the
Beliefs Feelings Attitude Behavioral Intention Behavior Expand from TRA Behavioral Beliefs Control Beliefs Normative Beliefs Perceived Control(PC) Subjective Norm(SN) Attitude to behavior(AB) Intention Behavior
Figure 2.3 Theory of Planned Behavior (TPB) Source: Ajzen (1991)
Figure 2.4 A Contemporary View of Attitude Source: Engel et al. (1995)
23
company to others, expressing loyalty to the company, and paying a price premium. Similarly, unfavorable behavioral intentions include some indicators, for example, “saying negative things, switching to another company, complaining to external agencies, and doing less business with company.”
Therefore this study applies a multi-dimensional scale to measure customers‟ potential behaviors. Both favorable and unfavorable outcomes are embodied in order to get a whole view of consumers‟ evaluations on behavioral intentions as well as the correlations between behavioral intentions and other key constructs.
Zeithaml et al. (1996) proposed the relationship between service quality and behavioral intention and suggest that service quality on particular behaviors that signal whether customers will remain with or defect from a company.
Cronin, Brady, and Hult (2000) in accordance with recent advances in services marketing theory, made efforts to conceptualize the effects of quality, satisfaction, and value on consumers‟ behavioral intentions across multiple service industries. It stated three competing models based on different research objectives from the literatures; those are value model, satisfaction model, and indirect model. And then, the authors developed the forth model called “Research Model” to depict the relationship amongst the primary service evaluation constructs of sacrifice, service quality, service value, satisfaction, and behavioral intentions.
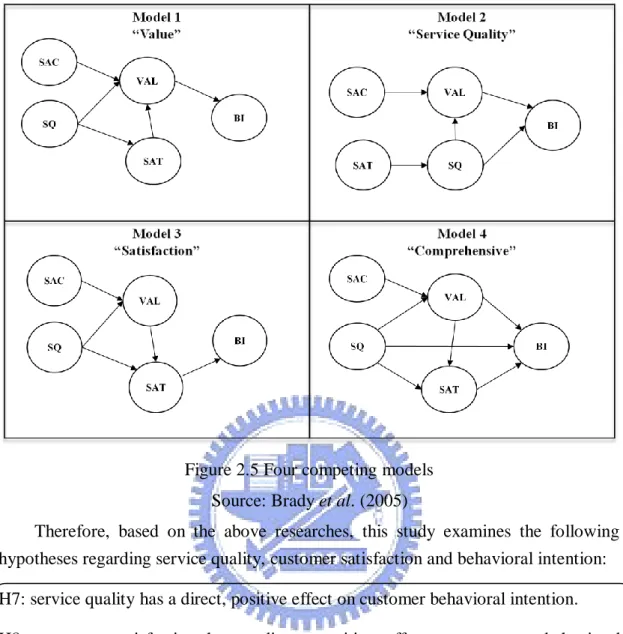
Brady et al. (2005) built upon Cronin et al.‟s tested the models using samples of service consumers in Australia, Hong Kong, Morocco, the Netherlands, and the United States, as well as across varied temporal and service settings. The models were shown in Figure 2.4. They found that service quality, service value, and satisfaction are all directly influence service consumers‟ behavioral intentions by the comprehensive model (e.g., SQBI, VALBI, and SATBI). The results not only imply that service quality, service value, and satisfaction have a strong, collective influence on behavioral intentions, but also lend support to cognitionaffectintention models.
24
Figure 2.5 Four competing models Source: Brady et al. (2005)
Therefore, based on the above researches, this study examines the following hypotheses regarding service quality, customer satisfaction and behavioral intention:
H7: service quality has a direct, positive effect on customer behavioral intention.
H8: customer satisfaction has a direct, positive effect on customer behavioral intention.
2.3 Discrete Choice Model with Latent Variables
Choice behavior can be characterized by a decision process, which is informed by perceptions and beliefs based on available information, and influenced by affect, attitudes, motives, and preferences. Preferences are comparative judgments between entities. Under certain technical conditions, including completeness and transitivity, preferences can be represented by a numerical scale, or utility.
The random utility (or discrete choice) model was formalized by Manski (1977). The model is based on the notion that an individual derives utility by choosing an alternative. The utilities U are latent variables and the observable preference
indicators y are manifestations of the underlying utilities. The utilities are assumed to
25
and the alternative i. The resulting utility equation can be written as:
𝑈𝑖𝑛 = 𝑉 𝑋𝑖𝑛; 𝛽 + 𝜀𝑖𝑛, (1) where 𝑈𝑖𝑛 is the utility of alternative 𝑖[𝑖 = 1, . . . , 𝑗𝑛] for decision-maker 𝑛 𝑛 =
1, … , 𝑁 (𝑈𝑛 is a vector of utilities for decision-maker n); 𝑋𝑛 is a vector of
explanatory variables describing alternative i and decision-maker n (𝑋𝑛 is a matrix of
explanatory variables describing all alternatives and decision-maker n); 𝛽 is a vector of unknown parameters; V (called the systematic utility) is a function of the explanatory variables and unknown parameters 𝛽; and 𝜀𝑖𝑛 is a random disturbance for i and n (𝜀𝑛 is the vector of random disturbances, which is distributed 𝜀𝑛~𝐷 𝜃𝜀 , where 𝜃𝜀 are unknown parameters).
RUM assumes utility maximization:
Decision-maker n chooses i if and only if 𝑈𝑖𝑛 ≥ 𝑈𝑗𝑛 for all 𝑗 ∈ 𝐶𝑛 where 𝐶𝑛 is the set of 𝐽𝑛 alternatives faced by n.
The choice probability equation is then:
𝑃 𝑖|𝑋𝑛; 𝛽, 𝜃𝜀 = 𝑃𝑟𝑜𝑏 𝑈𝑖𝑛 ≥ 𝑈𝑗𝑛, ∀𝑗 ∈ 𝐶𝑛 . (2) Employing classical techniques, estimation involves maximizing the likelihood of the preference indicators (𝑦𝑛 ). The likelihood is derived from the structural
equation, in this n case the utility Eq. (1), and the measurement equation, which defines 𝑦𝑛 as a function of the utilities via the utility maximization Eq. (2). For
example, the measurement equation for choice data is: 𝑦𝑖𝑛 = 1 for the chosen alternative and 0 otherwise for all 𝑖 ∈ 𝐶𝑛 , which leads to the following likelihood:
𝑃 𝑦𝑛|𝑋𝑛; 𝛽, 𝜃𝜀 = 𝑖∈𝐶 𝑃 𝑖|𝑋𝑛; 𝛽, 𝜃𝜀 𝑦𝑖𝑛
𝑛 . (3)
Starting from this general formulation, assumptions on the distributions of the disturbances lead to various choice models, such as logit model and nested logit model. The logit model is derived from the assumption that the error terms of the utility functions are independent and identically Gumbel distributed.
Often in behavioral sciences, there are concepts of interest that are not well defined and cannot be directly measured. These concepts are referred to as latent constructs, e.g. knowledge, ambition, or personality. While there exists no operational models to directly measure these constructs, latent variable modeling techniques are often applied to infer information about latent variables. These techniques are based on the hypothesis that although the construct itself cannot be observed, its effects on measurable variables (called indicators) are observable and such relationships provide
26
information on the underlying latent variable.
Ben-Akiva et al. (1999) presented a rigorous and general methodology which integrated choice and latent variable model to model the theoretical framework, explicitly incorporating psychological factors and their influences on choices.
Ben-Akiva and Walker (2002) followed Ben-Akiva et al.‟s (1999) concept of integrated choice and latent variable model to present the generalized model of Random Utility Models which added relaxed simplifying assumptions and enriched the capabilities of the basic model. The extensions are flexible disturbances, latent variables, latent classes and combining revealed preferences and stated preferences. The component of latent variables of the generalized model is to explicitly incorporate the psychological factors, such as attitudes and perceptions, affecting the utility by modeling them as latent variables.
The portions of the generalized model related to integrating choice and latent variable models. The choice model is like any standard choice model, except that now some of the explanatory variables are not directly observable. The notation 𝑋𝑛∗ is
used to denote these unobservable explanatory variables, and the utility equation for the choice model is then:
𝑈𝑛 = 𝑉 𝑋𝑛, 𝑋𝑛∗; 𝛽 + 𝜀
𝑛 (5)
If the latent variables were given, the probability of 𝑦𝑛 conditional on 𝑋𝑛∗
would be:
𝑃 𝑦𝑛, 𝑋𝑛∗; 𝛽, 𝜃𝜀 . (6) This must be integrated over the distribution of the latent variables to obtain the unconditional probability of interest. This requires the latent variable structural model:
𝑋𝑛∗ = 𝑋∗ 𝑋𝑛; 𝜆 + 𝜔𝑛, (7) which describes the latent variable (𝑋𝑛∗) as a function of observable explanatory
variables (𝑋𝑛 ), a set of parameters (𝜆), and a disturbance 𝜔𝑛~𝐷 𝜃𝜔 . From this
equation, the density function of the latent variables𝑓(X∗|X
n; λ, 𝜃𝜔) is obtained and
the resulting unconditional probability equation is then:
𝑃 𝑦𝑛|𝑋𝑛; 𝛽, 𝜆, 𝜃𝜀, 𝜃𝜔 = 𝑃 𝑦𝑛|𝑋𝑛, 𝑋∗; 𝛽, 𝜆, 𝜃𝜀 𝑓(X∗|Xn; λ, 𝜃𝜔)dX∗. (8) It is difficult to estimate this model based on the observed preference indicator alone and so psychometric data, such as responses to attitudinal and perceptual survey questions, are used as indicators of the latent psychological factors. These data (𝐼 𝑛)
27
are incorporated through the latent variable measurement equation:
𝐼 𝑛 = 𝐼 𝑋𝑛∗; 𝛼 + 𝜐𝑛, (9)
which describes the indicators (𝐼 𝑛) as a function of the latent variables (𝑋𝑛∗), a set of n
parameters (𝛼) and a disturbance 𝜈𝑛~𝐷 𝜃𝜐 . From this equation, the density function of the indicators𝑓(In|X∗; α, 𝜃
𝜐) is obtained. Incorporating this into the likelihood
leads to the final form of the integrated choice and latent variable model:
𝑃 𝑦𝑛, 𝐼𝑛|𝑋𝑛; 𝛽, 𝛼, 𝜆, 𝜃𝜀, 𝜃𝜐, 𝜃𝜔 =
𝑃 𝑦𝑛|𝑋𝑛, 𝑋∗; 𝛽, 𝜃𝜀 𝑓 𝐼𝑛 X∗; α, 𝜃𝜐 𝑓 X∗ Xn; λ, 𝜃𝜔 dX∗ (10)
28
CHAPTER3 METHODOLOGY
This chapter first introduces the conceptual model and construct measurements of research constructs, including service quality, perceived value, switching cost, customer satisfaction, and customer behavioral intentions. Then, the hypotheses to be tested and the research design (the sampling plan, data collection, and data analysis techniques) are described.
3.1 Research Framework
3.1.1
Research Model of SEM
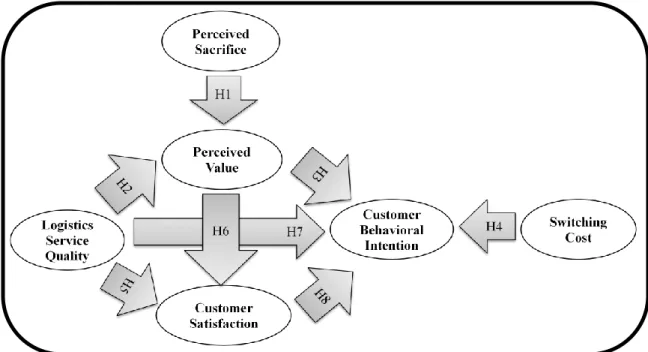
The literature review shows that all research constructs have direct effects on each other and the comprehensive model proposed by Brady et al. (2005) yields the best empirical results than other competing models. In this study, we first developed the retailing delivery (RD) logistics service quality scales and build an integrative research model and identify both direct and indirect relationships among key constructs. Secondly, the retailing delivery provider types (e.g., 7-11.com or CVS.com) and the online consumers‟ individual differences (i.e., demographic differences) are explored to clarify their impacts on consumers‟ perceptions of research variables. Afterwards this study tests the integration research model through conducting online questionnaire surveys in the auction market of online shopping. The research model of SEM in this study is shown in Figure 3.1. According to the literature review, switching cost also is a critical antecedent to behavioral intention. Although the comprehensive model presented in Brady et al.‟s (2005) article (see Figure 2.4) did not illustrate the relationship of the component between switching cost and customer behavioral intention, their results verified this relationship. As a consequence, the direct link between switching cost and customer behavioral intention is hypothesized in our research model.
29
Figure 3.1 Research Model of SEM
3.1.2
Research Framework of Integration Model
In this study, we use the combined methodologies of Ben-Akiva et al.‟s (1999) integration model and SEM to understand the choice behavior of the online auction consumers. The research framework of this study is shown in Figure 3.2.
Figure3.2 Research Framework Source: Ben-Akiva et al. (1999)