國 立 交 通 大 學
機械工程學系
碩 士 論 文
探討添加球狀補強材之奈米複合材料的阻尼響應及
其三明治結構的阻尼響應
Investigating Damping Responses of Particulate Nanocomposites and
Nanocomposite Sandwich Structures
研 究 生 :張乃仁
指導教授 :蔡佳霖 博士
探討添加球狀補強材之奈米複合材料的阻尼響應及其三明治結構
的阻尼響應
Investigating Damping Responses of Particulate Nanocomposites and
Nanocomposite Sandwich Structures
研 究 生:張乃仁 Student:Nar-Ren Chang
指導教授:蔡佳霖 Advisor:Jia-Lin Tsai
國 立 交 通 大 學
機 械 工 程 學 系
碩 士 論 文
A ThesisSubmitted to Department of Mechanical Engineering College of Engineering National Chiao Tung University
in partial Fulfillment of the Requirements for the Degree of Master
in
Mechanical Engineering
June 2009
Hsinchu, Taiwan, Republic of China
探討添加球狀補強材之奈米複合材料及其三明治結
構的阻尼響應
學生:張乃仁 指導教授:蔡佳霖
國立交通大學機械工程學系碩士班
摘 要
本研究探討添加二氧化矽奈米顆粒與橡膠顆粒(CTBN, CSR)於環氧樹脂基材中之奈 米複合材料的阻尼特性,並觀察當奈米複合材料作為三明治結構中核心部份材料時,三 明治結構的阻尼響應。以上材料的阻尼特性則是透過振動試驗與半能量頻寬法所決定。 接著,本研究利用傳統的微觀力學模型來預測奈米複合材料的阻尼特性,並與實驗結果 作比較。此外,透過有限元素法的分析,可瞭解奈米複合材料與三明治結構於振動試驗 時其主導的能量消散機制。 由實驗結果可發現,雙重顆粒的材料系統(10 wt%二氧化矽奈米顆粒與 10 wt% CTBN 橡膠顆粒)有優於其他材料系統的阻尼特性,而在它的三明治結構複合材料上也可 觀察到較佳的阻尼特性。另外,在本研究中發現添加二氧化矽顆粒的奈米複合材料有比 純樹脂材料還好的阻尼效果,這與微觀力學模型所預測的結果是相佐地。所以,若要以 微觀力學模型來描述奈米複合材料的阻尼特性時,分子鏈段的型態學、奈米顆粒與基材 介面的作用力等情況也需要一併加入計算考量中。最後,雖然主導的能量消散機制在懸 臂梁試片與三明治結構並不相同,但實驗結果皆顯示在添加雙重顆粒的奈米複合材料擁 有優於其他材料系統的阻尼響應。Investigating Damping Responses of Particulate Nanocomposites
and Sandwich Nanocomposite Structures
Student: Nai-Ren Chang Advisor: Dr. Jia-Lin Tsai
Department of Mechanical Engineering
National Chiao Tung University
Abstract
The research aims to investigate the damping responses of the epoxy based nanocomposites as well as the composites sandwich structures with the nanocomposite as core materials. Both the silica nanoparticles and the rubber particles (CSR, CTBN) are introduced in the epoxy matrix. The damping performances of the material systems were basically determined from the vibration test together with the half power method. The damping properties of the nanocomposites were predicted using conventional micromechanical model. In addition, the dominant energy dissipation mechanisms during the vibration tests were characterized through the FEM analysis.
Results indicate the hybrid material system (10wt% silica nanoparticles and 10wt% CTBN rubber particles) can have better damping properties than other cases. Moreover, this superior damping property can also be present in its composite sandwich structures. It is noted that the silica nanocomposites can have better damping behavior than the pure resin. This observation is different from the model prediction and thus, the micromechanical model including the morphology of molecular chains and the interfacial interaction is required to
describe the damping properties of the nanocomposites. In addition, Although the dominant modes in cantilever-type sample and sandwich structures is different, experimental results demonstrate that the hybrid nanocomposites still exhibit superior damping responses than other cases.
誌 謝
兩年,匆匆的一閃即逝,轉眼間已到了口試結束、碩士論文完稿之刻。回想碩士生 涯的這些日子,精彩豐富,印象深刻,完成了諸多終生懷念的回憶。在這段時間裡蒙受 許多人的照顧與幫忙,若無你們乃仁是無法順利完成這本碩士論文地,先在此致上最大 的謝意。而其中最要萬分感謝是指導教授蔡佳霖老師,在乃仁求學期間中不遺餘力的給 予指導,甚至讓我有赴日本九州參加國際研討會和在國際期刊上發表論文的難忘經驗, 您的悉心指導讓我於做研究的態度與方法上獲益良多,謝謝您! 接著感謝的是室驗室的全體成員,世華學長、鄒阿楨、鳳姊等學長姊、同學大牛、 孟哲和泰元學弟,陪乃仁渡過這段充滿歡笑與辛勞的兩年,大家一起出遊吃飯的日子讓 常我心中倍感溫馨與充實。還有工研院與台灣駐極體的幾位大哥,借我許多實驗相關儀 器和協助,讓我能順利完成許多測試。接著是我三位兄弟,明軒、柏綱、益安,這兩年 你們有事沒事就接到乃仁的電話,聽我抱怨和給予我衷心建議,也是因為彼此互相的砥 礪,讓我更有努力求進步的動力,祝福即將踏入研究所生涯的益安,一切順利!還要感 謝我親愛的家人,沒有你們在背後提供經濟上的支援和最溫馨的避風港,我也沒辦法順 順利利地一路從大學念到碩士。 最後,特別感謝清華大學的葉孟考教授、系上的金大仁與蕭國模教授,於百忙中抽 空擔任學位論文口試委員並給予論文內容甚多建議,使此論文更趨完善與正確。尚有許 多欲感謝之人,無法一一贅述,在此致上歉意並於文末一道感謝,感謝一路支持我的走 到今日的親朋好友,謝謝你們。 2009 7/21 乃仁 于交通大學目 錄
中文摘要 ……… i 英文摘要 ……… ii 誌謝 ……… iv 目錄 ……… v 表目錄 ……… vii 圖目錄 ……… ix Chapter 1 Introduction………..………. 1 1.1 Research motivation……….. 1 1.2 Paper review……….. 2 1.3 Research approach……… 5Chapter 2 Material Preparation……..………... 7
2.1 Materials………... 7 2.2 Sample preparation………... 8 2.2.1 Silica/epoxy nanocomposite……… 8 2.2.2 CTBN/epoxy nanocomposite……….. 9 2.2.3 Silica/CTBN/epoxy nanocomposite………. 9 2.2.4 CSR/epoxy nanocomposite……….. 10 2.2.5 Silica/CSR/epoxy nanocomposite……… 11 2.2.6 Organoclay/epoxy nanocomposite………... 11
2.2.7 Nanocomposite sandwich structures……… 12
2.3 Material characterization.………. 13
Chapter 3 Experiment………..………. 15
3.1 Damping characterization of particulate nanocomposites……… 15
3.1.1 Apparatus for vibration test………. 15
3.1.2 Determination of vibration damping……… 16
3.1.3 Determination of flexural modulus……….. 18
3.1.4 Dynamic mechanical analysis……….. 18
3.2 Damping characterization of nanocomposite sandwich structures……... 19
Chapter 4 Analysis and Discussion………..………. 21
4.1 Experimental results……….. 21
4.1.2 DMA test results of particulate nanocomposites………. 22
4.1.3 Vibration test results of nanocomposite sandwich structures…….. 23
4.2 Micromechanical model……… 24
4.3 Finite element analysis……….. 26
4.3.1 FEM modal analysis of particulate nanocomposites………... 27
4.3.2 Simulation of nanocomposite in the DMA test by FEM analysis………. 28
4.3.3 FEM modal analysis of the sandwich structures……….. 29
Chapter 5 Conclusion……… 31
Reference……….. 33
Appendix A: Stoichiometric Calculation………. 37
List of Tables
Table 3.1 Comparison results of loss factor by two types of FRF………... 44 Table 4.1 Natural frequency and loss factor raw data of the particulate nanocomposite
vibrating in the first mode……… 44 Table 4.2 Natural frequency and loss factor raw data of the particulate nanocomposite
vibrating in the second mode………... 45 Table 4.3 Natural frequency and loss factor of the particulate nanocomposites
vibrating in the first mode……… 46 Table 4.4 Natural frequency and loss factor of the particulate nanocomposites
vibrating in the second mode………... 46 Table 4.5 Flexural modulus of the particulate nanocomposites determined by the
experimental results in first mode……… 47 Table 4.6 Flexural modulus of the particulate nanocomposites determined by the
experimental results in second mode………... 47 Table 4.7 Loss factor of the particulate nanocomposites at 25Hz in the DMA test……. 48 Table 4.8 Loss factor of the particulate nanocomposites at 150Hz in the DMA test…... 48 Table 4.9 Natural frequency and loss factor raw data of the sandwich nanocomposite
structure vibrating in the first mode………. 49 Table 4.10 Natural frequency and loss factor raw data of the sandwich nanocomposite
structure vibrating in the first mode………. 50 Table 4.11 Effective flexural modulus of the sandwich nanocomposite structures via
the vibrating results in the first mode……….. 50 Table 4.12 Material properties for micromechanics model………... 51 Table 4.13 Simulation results of silica/epoxy nanocomposite through micromechanics
Table 4.14 Material properties for neat epoxy plate……….. 51 Table 4.15 First two mode results of epoxy plate through FEM modal analysis……….. 52 Table 4.16 First two mode results of epoxy plate through FEM modal analysis……….. 52 Table 4.17 Material properties for CFRP lamina………... 52 Table 4.18 First mode results of the sandwich structure with epoxy layer interleaved
List of Figures
Fig 2.1 Mechanical stirrer………..………...…... 54
Fig 2.2 Misonix sonicator 3000……… 54
Fig 2.3 Curing process of particulate/epoxy nanocomposite………..…. 55
Fig 2.4 Temperature controller and thermocouple………... 55
Fig 2.5 Stacking sequence of the sandwich nanocomposite structure……….… 56
Fig 2.6 Hot press machine……… 56
Fig 2.7 Stacking sequence of the assisted materials and nanocomposite laminates for fabricating sandwich nanocomposite structure……….. 57
Fig 2.8 Optical microscope images of thickness in sandwich specimen in 100 magnification……… 57
Fig 2.9 Schematic of the nanocomposite sandwich structure………... 58
Fig 2.10 TEM images of 10 wt% silica/epoxy nanocomposites: (a) in 50000 magnification (b) in 100000 magnification……….. 58
Fig 2.11 TEM images of 10 wt% CTBN/epoxy nanocomposites: (a) in 5000 magnification (b) in 10000 magnification……… 59
Fig 2.12 TEM images of 30 wt% CTBN/epoxy nanocomposites: (a) in 6000 magnification (b) in 15000 magnification……… 59
Fig 2.13 TEM images of 10 wt%-10wt% silica/CTBN/epoxy nanocomposites: (a) in 20000 magnification (b) in 50000 magnification………. 60
Fig 2.14 TEM images of 10 wt% CSR/epoxy nanocomposites: (a) in 8000 magnification (b) in 20000 magnification……… 60
Fig 2.15 TEM images of 10 wt%-10wt% silica/CSR/epoxy nanocomposites: (a) in 20000 magnification (b) in 50000 magnification……….… 61 Fig 2.16 TEM images of 10 wt% organoclay/epoxy nanocomposites: (a) in 6000
magnification (b) in 20000 magnification……… 61 Fig 3.1 Experimental equipment for vibration test………... 62 Fig 3.2 Input (shaker) spectrum of epoxy resin at a time of vibration test…………... 62 Fig 3.3 Output (laser vibrometer) spectrum of epoxy resin at a time of vibration test 63 Fig 3.4 Input (shaker) spectrum of epoxy resin at an interval time of vibration test:
(a) before (b) after enhancement procedure………. 63 Fig 3.5 Output (laser vibrometer) spectrum of epoxy resin at an interval time of
vibration test: (a) before (b) after enhancement procedure……….. 64 Fig 3.6 Illustration of the half-power bandwidth method for measuring damping... 64 Fig 3.7 Integration result of output (laser vibrometer) spectrum of epoxy resin at a
time of vibration test……… 65 Fig 3.8 Applied stress and measured strain in a time history during the test………... 65 Fig 3.9 Boundary condition and dimension of the test specimen applied in the DMA
test……… 66 Fig 3.10 Apparatus feature of Perkin-Elmer Instruments dynamic mechanical
analyzer 8000 (DMA 8000)……….……… 66 Fig 4.1 Loss factor of the particulate nanocomposite vibrating in the first mode.…... 67 Fig 4.2 Loss factor of the particulate nanocomposite vibrating in the Second mode.. 67 Fig 4.3 Flexural modulus of the nanocomposite determined from the vibrating
results in the first mode………...……….……… 68 Fig 4.4 Flexural modulus of the nanocomposite determined from the vibrating
results in the second mode………... 68 Fig 4.5 Comparison results of the loss factor of different nanocomposites in the
DMA test with varying frequencies………. 69 Fig 4.6 DMA results of loss factor in the particulate nanocomposite at 150Hz……... 69
Fig 4.7 Loss factor of the sandwich nanocomposite structure vibrating in the first mode…... 70 Fig 4.8 Flexural modulus of sandwich nanocomposite structure calculated from the
vibrating results in the first mode…... 70 Fig 4.9 Schematic of the epoxy plate with the clamped-free boundary condition... 71 Fig 4.10 First two bending mode shapes of epoxy plate under clamped-free boundary
condition (a) First mode (b) Second mode... 72 Fig 4.11 Schematic of the epoxy rod with the fixed-fixed boundary condition, and
applied displacement boundary condition……… 73 Fig 4.12 Deformation of epoxy specimen under fixed-fixed boundary condition
in the DMA test... 73 Fig 4.13 Schematic of the sandwich structure with the clamped-free boundary
Chapter 1 Introduction
1.1 Research motivation
Composite materials combine the advantages of individual material, and replace the traditional metallic or ceramic material in many ways. Recently, some composite materials with high energy absorption ability have been used to improve and increase the shock resistance in engineering application, such as composite sandwich structure. In the electronic/chip packaging, the precision and performance of robot arm is quite important. Composite sandwich material used in the robot arm can not only increase the stiffness but also the damping property, and can finally promote the working efficiency of the robot arm and reduce production cost. Polymeric composites possessing the high damping properties of polymer matrices and the extraordinary characteristics of material heterogeneity demonstrate the distinctive capability of dissipating energy during vibrations. In the development of nanotechnology, the nanocomposite composes of nano-reinforcement and resin matrix which gradually replaces the micro-inclusion because the physical and chemical properties of the nanocomposites are better than that of the micro-reinforcement composites. This research aims at investigating the effect of damping characteristic of the nanocomposite materials when the nano-scale inclusion is added into the epoxy based matrix. The damping behaviors of particulate nanocomposites are needed to be further studied, especially the inorganic type particle nanocomposite, although the particulate nanocomposites have been studied for a decade. Therefore, this research investigates the damping responses on the particulate nanocomposites by using the forced vibration technique; dynamic mechanical analysis (DMA) test with varying frequency is adopted to validate these results. Moreover, the damping performances of the sandwich structure embedded with particulate nanocomposites as core material are also characterized by the vibration test.
1.2 Paper review
Nanosilica, which has more obvious promotion than microsilica, has been used extensively with polymer materials to modify processing and to improve mechanical properties in recent years [1-8]. In the damping performance through dynamic mechanical analysis (DMA), there are two opposite tendencies were observed when nanosilica was blended into polymer resin. On one hand, the damping increases with increasing silica filler loading [1-4]. On the other hand, the damping decreases with increasing filler proportions [5-8]. Moreover, in the reference [9-10], by introducing the alumina into nanocomposites, the improvement of damping property similar to those in the literature [1-4] was reported. In addition, in general, the Young’ modulus or storage modulus of these nanocomposites was increased with increasing stiffer filler containing [1-10].
The enhancement of damping quality of the inorganic particulate composites might be caused by the decrease of the cross-linking density of the material system [1,9], the variation of stress relaxation of the molecular chain [4,10] and the plasticizing effect [1,2]. The above mentioned mechanisms may cause the increase of chain mobility rose and furthermore improve the damping responses of the silica nanocomposite [1-4]. Chen et al. [1] added the hydroxyl functionality of the nanosilica particles (12 nm) into DGEBF resin to form silica/epoxy nanocomposites. Results indicate that Young’s modulus increased with increasing filler loadings of silica, the loss factor also increase with increasing filler loadings. Because the regions with very low cross-linking density are extensively created by the silica nanoparticles, the chain mobility and damping properties are enhanced at the same time. In addition, the plasticizing effect caused by the chemical reaction of epoxy with functional groups on nanosilica surface may lead to the softening of polymer chains as well as the improvement of damping properties. The plasticizing effect caused by the colloidal silica in the polymer matrix is also found by Zhang et al. [2]. They reported on epoxy nanocomposites containing various contents of nanosilica particles (0-14 vol.%) prepared in
situ by a special sol-gel process. Omrani and coworkers [9] prepared alumina/epoxy nanocomposite indicating that the enhancement of the damping was resulted from the decreasing of polymer cross-linking density caused by alumina particles (50 nm in diameter). Lu et al. [4] prepared PEO-grafted silica (10-20 nm)/epoxy nanocomposites by the sol-gel method. The PEO-grafted silica containing PEO flexible chain could effectively toughen the composite. In additions, the loss factor increases with increasing filler loadings of silica up to 2 wt%. Vassileva and Friedrich [10] conducted the DMA test and demonstrated that the epoxy based nanocomposites containing 40 nm diameter alumina nanoparticles exhibit better damping properties.
Although the damping properties of composites can be improved by the introduction of nanoparticles according to the forgoing observations, some experiment demonstrated the negative effect of nanoparticles on the damping behaviors of polymer. The possible explanations on this phenomenon could be the disrupted chain segments separated by silica particles as well as the decreasing mobility of the polymer chains. This situation occurs when nanoparticles is not well dispersed in the polymer (so called particle agglomeration) [5-8]. Goertzen et al. [5] added two kinds of hydroxyl functionality of the nanosilica particles (12 nm and 40 nm) into bisphenol E cyanate ester resin to form the silica/cyanate ester nanocomposites, and investigated the storage modulus and damping behavior. The results showed that the storage modulus increases with the increase of filler loading. In contrast to the storage modulus, the loss factor (tanδ) decrease with the increase of filler loadings. Similar results were also observed by Peng et al. [6] who focused on silica (14 nm) /polyvinylalcohol (PVA) nanocomposites. In their study, the nano-clusters, i.e. silica particles aggregation, with strong adsorptive power lead to the PVA interacting strongly with silica particles. The PVA molecular segments are restricted by silica particles, and thus, the mobility of the PVA molecular segments becomes worse. Zheng et al. [7] investigate several mechanical properties of nanosilica (20 nm)/epoxy composites with the incorporation of
GPDMS. Here, GPDMS is employed as a diluent to reduce the viscosity. The storage modulus increases when silica content increases up to 3 wt%, but the storage modulus declined at 5 wt% silica loading.
Besides, adding rubber particulate into polymer resin is a common way to improve damping performance of the materials [11-14]. The enhancement of the damping quality of rubber particulate composites can be attributed to the compatibility of the rubber-matrix interaction and the decrease of the cross-linking density, which may increase the chain mobility. Carboxyl terminated butadiene acrylonitrile copolymer (CTBN) is one of the liquid nitrile rubber which have been used widely [12-19] in past decades. Kishi et al. [12] investigate the damping responses on the steel laminates with a 60 wt% containing CTBN/epoxy nanocomposite constrained-layer. The damping of steel laminates improves obviously in the vibration test. Nigam et al. [13] also discussed the dynamic mechanical properties of CTBN/ECN (epoxy cresol novolac) composite. DMA results show that the addition of 10 wt% of CTBN results in the maximum loss factor, but the storage modulus of the composite reduces with the increase of CTBN loading. In order to overcome this significant reduction of storage modulus, some researchers [15-17] blended hybrid inclusion into polymer matrix. Hence, several mechanical properties are promoted at the same time, such as loss factor, stiffness, toughness, and so on. Fang et al. [15] added BT (bentonite, clay) into CTBN/CE composite. With 0.5 wt% BT, CTBN/CE composite exhibits the optimum behaviors of the storage modulus and the loss factor.
Sandwich composites embedded with a polymer core material [12, 20-22] have been employed in mechanical design to improve the vibration damping. Laminate structures interleaved with viscoelastic damping material were studied by several researchers [23, 24]. It can be found that the damping property of the composite laminate structure may be influenced by the laminate stacking sequences, interleaved location of damping layer, adhesion condition between laminate and damping layer, material properties of damping layer,
damping layer thickness, and so on [23, 24]. Kishi et al. [23] characterized the damping responses of carbon fiber-reinforced plastic (CFRP) laminates embedded with thermoplastic-elastomer damping layer. Several types of polymer damping films were used as the interleaving materials. DMA results show that PU and polyethylene-based ionomers polymer film have the better loss factor in room temperature than other elastomers. Therefore, in the vibration test, it is seen that unidirectional (UD) laminates embedded with PU damping layer has the best damping performance than that with other polymer damping layer. However, the stiffness of the composite structures decreases seriously. Hence, with the development of nanotechnology, the polymer core materials were modified by the nano-inclusions such as Carbon nanotubes (CNTs) [25], Nanoparticles or Organic clay. Yeh and Hsieh [25] investigated damping properties of sandwich beams with MWNT/polymer nanocomposites as core materials. They found that the damping property and natural frequency of composite sandwich structure are improved and increased with increasing CNTs nanocomposite core thickness. In addition, the damping responses of sandwich structures embedded with the particulate nanocomposite as a core material have seldom been studied so far.
1.3 Research approach
This research aims at investigating the effect of nano-inclusion on the damping responses of epoxy-based composite materials. When the nano-scale inclusion and the hybrid system such as silica, carboxyl terminated butadiene acrylonitrile copolymer (CTBN), core shell rubber (CSR), organoclay, silica-CTBN, silica-CSR, are blended into the thermosetting type epoxy matrix. Those particulate nanocomposites are then served as the core material in a sandwich nanocomposite structure. This sandwich structure consists of the particulate nanocomposite core and the face sheet of unidirectional graphite laminates. The detail fabrication processes of the nanocomposites and the sandwich structures will be illustrated in
Chapter 2. Transmission electron microscope (TEM) is then used to observe the morphology of the particulate nanocomposites, i.e. the distribution and dispersion of the inclusions in the nanocomposites, in Chapter 2 as well.
The damping behaviors of different kinds of particulate nanocomposites are characterized by the forced vibration test and the DMA test with varying frequencies. The damping performances of the different sandwich nanocomposite structures are also examined by the vibration test. The experimental setup and apparatus are introduced in Chapter 3. In the nanocomposites, the loss factors measured by the vibration test are compared with those in the DMA test. The results of the sandwich nanocomposite structures in terms of loss factor associated with different nanocomposites were determined in the vibration test. Moreover, a micromechanical model [26] is used to predict the dynamic mechanical properties of the silica/epoxy nanocomposites. In addition, the energy dissipated mechanism of the nanocomposites in the vibration test and in the DMA test, and the sandwich structure in the vibration test, are also analyzed by finite element method (FEM) analysis, respectively. Detail of procedures and results are presented in Chapter 4.
Chapter 2 Material Preparation
This research uses the common epoxy as the matrix material of the composites, and chooses silica, rubber, and organoclay particulates as the reinforcement materials. The influence on the damping properties of the nanocomposites are investigated when adding different kinds of the inclusions such as: nanosilica, rubber, organoclay, and hybrid materials into the matrix system. In addition, the impact on the damping behaviors of the sandwich nanocomposites structure are found when the above nanocomposites are used as different core materials of the sandwich nanocomposites structure.
2.1 Materials
Diglycidyl ether of bisphenol A (DGEBA) epoxy resin used in this research was a commercial product (C-1532, Procachen Corporation in Taiwan) and its epoxy equivalent weight (EEW) is 187. Then, the modify cycloaliphatic amine (H-100, Yun teh Industrial Co., Ltd) was used as received; its active hydrogen equivalent weight (AHEW) is 45. Nanosilica (SiO2) (Nanopox F400 Hanse Chemie, Germany) containing 40wt% epoxy functional silica in
a diglycidyl ether of bisphenol A (DGEBA) epoxy; its epoxy equivalent weight (EEW) is 295. Besides, silica in DGEBA was prepared by the sol-gel method, and silica particles were dispersed in the DGEBA uniformly. Moreover, the size of the nanosilica is near 20 nm. Carboxyl terminated butadiene acrylonitrile copolymer (CTBN) (1300X8, company HycarTM) and its epoxy equivalent weight (EEW) is 3550, and product specification of CTBN is shown in [27]. Core shell rubber (CSR) (EXL-2314, company Rohm Hass) particles have a rubber core and is covered with a glass shell; particle size of CSR is around 500 nm. Organoclay (Closite I.30E, Nanocor Inc.) is basically an octadecy-ammonium ion surface modified montmorillonite mineral designed to be easily dispersed into amine-cured epoxy resin and form nanocomposites as well.
setting, the nanocomposites could be manufactured from above DGEBA, reinforcement, and hardener materials. A more detail of stoichiometric calculation could be found in Appendix A.
CFA graphite/epoxy composites (CFA-05624E19, Ad group, Taiwan) used in sandwich specimen is a commercial prepreg material.
2.2 Sample preparation
2.2.1 Silica/epoxy nanocomposite
In this research, the weight ratio of silica in the nanocomposite is selected by 10wt%. Due to F400 is containing 40wt% epoxy functional silica in a DGEBA epoxy, F400 needed to be diluted with C1532 (DGEBA), and then, the quantity of silica contained in the DGEBA would become 10wt%. First, the mixture (F400 and C1532) was stirred by the mechanical stirrer (YEONG-SHIN Co., Ltd) at 200 rpm for 10 min at room temperature (Fig 2.1). In order to let silica disperse well in the DGEBA, the sonicator (Sonicator 3000, Misonix, Inc,) played an important role after the mechanical stirrer was finished (Fig 2.2). In this research, the sonicator was programmed to run ten consecutive cycles of 120 s of total sonication per cycle. Each cycle included 60 s of sonication pulse (90~120 W power output) followed by a pulse off period of 60 s. High temperature would generate in the mixture solution after using the sonicator. Therefore, in order to avoid changing of chemistry of the DGEBA system which was caused by high temperature, the beaker was cooled by ice-cubes around it. After sonication, DGEBA mixture solution was subsequently degassed for 20 minutes at room temperature in order to remove little bubbles which were caused by the sonication. Then, a stoichiometric amount of curing agent H-100 was added to DGEBA mixture solution at room temperature and mixed under mechanical stirring at 200 rpm for 10 min. After mechanical stirring, bubbles might be generated again; therefore, followed by degassing at room temperature for 30 minutes. After degasification, the solution was quickly poured into the
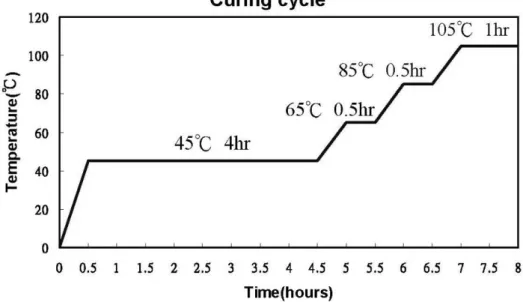
mold and then thermally cured in an oven. The curing cycle was shown in the Fig 2.3.
2.2.2 CTBN/epoxy nanocomposite
In this research, the weight ratio of CTBN in the CTBN/epoxy nanocomposite was selected by 10wt% and 30wt%. First, CTBN was added into C1532 and the mixture solution was stirred by the mechanical stirrer at 200 rpm for 10 minutes at room temperature. Then, the solution was equipped with the mechanical stirrer at 200 rpm and thermocouple with a temperature controller (preheated to 80℃) maintained at 80℃ for 6 hrs (Fig 2.4). After mechanical stirring, bubbles were generated; therefore, followed by degassing at 80℃ for 20 minutes in an oven (preheated to 80℃). After degasification, the beaker was placed into a cup of water to cool down the mixture solution to room temperature. Then, a stoichiometric amount of curing agent H-100 was added to the mixture solution at room temperature and mixed under mechanical stirring at 200 rpm for 10 minutes, followed by degassing at room temperature for 30 minutes. After degasification, the solution was quickly poured into the mold and then thermally cured in an oven. The curing cycle was shown in the Fig 2.3.
2.2.3 Silica/CTBN/epoxy nanocomposite
In this research, silica/CTBN/epoxy nanocomposite materials were fabricated; the weight ratio of silica and CTBN in the nanocomposite was selected by 10wt%, respectively. First, F400 was diluted with C1532, and then, the quantity of silica contained in the epoxy would finally become 10wt%. Then, the mixture solution was stirred by the mechanical stirrer at 200 rpm for 10 minutes at room temperature. After mechanical stirring, in order to let silica particles disperse well in the DGEBA, the sonicator (Sonicator 3000, Misonix, Inc) was programmed to run ten consecutive cycles of 120 s of total sonication per cycle. Each cycle included 60 s of sonication pulse (90~120 W power output) followed by a pulse off period of 60 s. After sonication, DGEBA mixture solution was subsequently degassed for 20 minutes
at room temperature in an oven for removing little bubbles which were caused by the sonication. Next, CTBN was added into above mixture solution; and the solution equipped with the mechanical stirrer at 200 rpm and thermocouple with a temperature controller (preheated to 80℃) maintained at 80℃ for 6 hrs. After mechanical stirring, the mixture solution was followed by degassing at 80℃ for 20 minutes in an oven (preheated to 80℃). After degasification, the beaker was placed into a cup of water to cool down the mixture solution to room temperature. Then, a stoichiometric amount of curing agent H-100 was added to DGEBA mixture solution at room temperature and mixed under mechanical stirring at 200 rpm for 10 minutes. After mechanical stirring, the solution was followed by degassing at room temperature for 30 minutes. Finally, the solution was quickly poured into the mold and then thermally cured in an oven. The curing cycle was shown in the Fig 2.3.
2.2.4 CSR/epoxy nanocomposite
In this research, the weight ratio of CSR in the nanocomposite is selected by 10wt%. First, CSR powder was added into C1532 and the mixture solution was stirred by the mechanical stirrer at 200 rpm for 10 minutes at room temperature. In order to let nano-particles disperse well in the DGEBA, the sonicator was programmed to run ten consecutive cycles of 240 s of total sonication per cycle. Each cycle included 60 s of sonication pulse (90~120 W power output) followed by a pulse off period of 60 s. After sonication, DGEBA mixture solution was subsequently degassed for 20 minutes at room temperature. Next, the solution was equipped with the mechanical stirrer at 200 rpm and thermocouple with a temperature controller (preheated to 80℃) maintained at 80℃ for 2 hrs. Then, the solution was degassed for at 100℃ for 2 hrs. After the solution was cool down to room temperature, a stoichiometric amount of curing agent H-100 was added to DGEBA mixture solution at room temperature and mixed under mechanical stirring at 200 rpm for 10 minutes. After mechanical stirring, the solution was followed by degassing at room
temperature for 30 minutes. Finally, the solution was quickly poured into the mold and then thermally cured in an oven. The curing cycle was shown in the Fig 2.3.
2.2.5 Silica/CSR/epoxy nanocomposite
In this research, the weight ratio of silica and CSR in the nanocomposite is selected by 10wt%, respectively. First, F400 was diluted with C1532 and then CSR powder was added into the mixture solution. The solution was stirred by the mechanical stirrer at 200 rpm for 10 minutes at room temperature. In order to let nano-particles disperse well in the DGEBA, the sonicator was programmed to run ten consecutive cycles of 240 s of total sonication per cycle. Each cycle included 60 s of sonication pulse (90~120 W power output) followed by a pulse off period of 60 s. After sonication, DGEBA mixture solution was subsequently degassed for 20 minutes at room temperature. Next, the solution was equipped with the mechanical stirrer at 200 rpm and thermocouple with a temperature controller (preheated to 80℃) maintained at 80℃ for 2 hrs. Then, the solution was degassed at 100℃ for 2 hrs. After the solution was cool down to room temperature, a stoichiometric amount of curing agent H-100 was added to DGEBA mixture solution at room temperature and mixed under mechanical stirring at 200 rpm for 10 minutes. After mechanical stirring, the solution was followed by degassing at room temperature for 30 minutes. Finally, the solution was quickly poured into the mold and then thermally cured in an oven. The curing cycle was shown in the Fig 2.3.
2.2.6 Organoclay/epoxy nanocomposite
In this research, the weight ratio of organoclay in the nanocomposite is selected by 10wt%. First, organoclay powder was added into C1532 and the mixture solution was stirred by the mechanical stirrer at 150 rpm for 10 minutes at room temperature. Then, the solution was equipped with the mechanical stirrer at 800 rpm and thermocouple with a
temperature controller (preheated to 80℃) maintained at 80℃ for 4 hrs. In order to let the layer structure of clay platelet completely separate to each other and disperse well in the DGEBA, the sonicator was programmed to run ten consecutive cycles of 1 hr of total sonication per cycle. Each cycle included 60 s of sonication pulse (90~120 W power output) followed by a pulse off period of 60 s. Next, DGEBA mixture solution was subsequently degassed for 20 minutes at room temperature. After the solution was cool down to room temperature, a stoichiometric amount of curing agent H-100 was added to DGEBA mixture solution at room temperature and mixed under mechanical stirring at 200 rpm for 10 minutes. After mechanical stirring, the solution was followed by degassing at room temperature for 30 minutes. Finally, the solution was quickly poured into the mold and then thermally cured in an oven. The curing cycle was shown in the Fig 2.3.
After the remove of above nanocomposite plate from the mold, the dimension of the original nanocomposite plate is, 240 mm in length, 80 mm in width and 3.5 mm in thickness. Subsequently this specimen was cut by diamond saws with appropriate dimension. The corresponding width, length, and thickness of the vibration test specimen are 15, 235, and 3 mm, respectively. Moreover, at least three specimens were prepared for each particulate nanocomposite. The corresponding width, length, and thickness of the DMA test specimen are 5, 40, and 3 mm, respectively; one or two specimens were prepared for each particulate nanocomposite.
2.2.7 Nanocomposite sandwich structures
The sandwich nanocomposite structures were fabricated in this research. There were
eight kinds of sandwich nanocomposite structures which were interleaved in different core materials. This sandwich specimen consists of CFA graphite/epoxy laminates and nanocomposites. The stacking sequence of sandwich specimen is [03/d/03], where d is the
sequence of specimen is also presented in Fig 2.5. The upper and lower surfaces of the particulate nanocomposite were adhered to the [03] laminates which consisted of the
CFA-05624E19 unidirectional prepreg tapes. Accordingly, the sandwich nanocomposite laminates plate was produced in a hot press machine (Fig 2.6) with the following layup: vacuum bag, backing tray, cotton patch (five pieces), released fabric, sandwich nanocomposite laminates, released fabric, cotton patch (three pieces), cellophane, and backing tray. The stacking sequence of those materials is setup in Fig 2.7. Those materials were cured at the suggested temperature profile: at 100 ℃ for 40 minutes and at 150 ℃ for 50 minutes under an applied pressure of 13.6 kg/cm2, i.e. 16 Psi, with vacuum conditions. The vacuum is essential for forming nanocomposites since it can facilitate the removal of tiny bubbles trapped in the nanocomposites during the process.
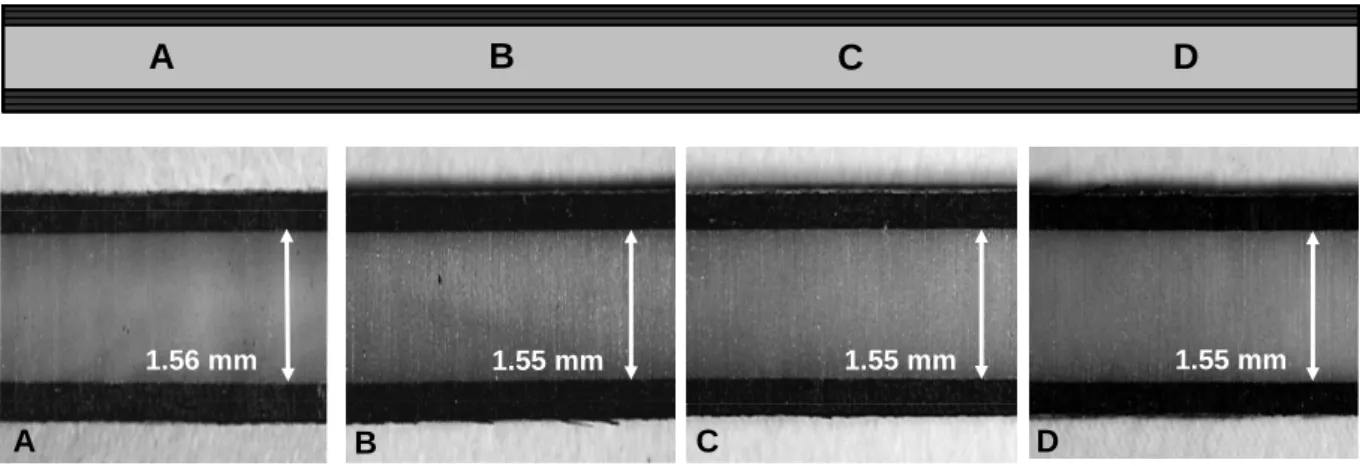
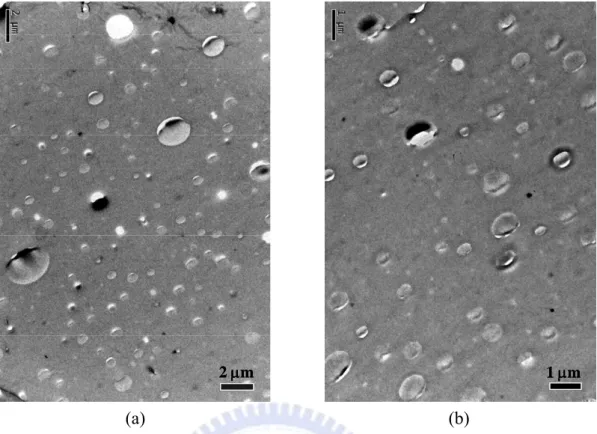
After the remove of above sandwich structure from the hot press machine, the specimen was cut by diamond saws with appropriate dimension. The corresponding width, length, and thickness of the test specimen are 10, 185, and 2.3 mm, respectively. At least three specimens were prepared for each sandwich specimen. Furthermore, the uniformity of thickness in sandwich specimen could be found in Fig 2.8 by using an optical microscope. In Fig 2.8, the specimen was separated by four parts in the length direction; each part had an image in 100 magnification photograph. It can be shown that the uniformity of core material is quite well. From observing Fig 2.8, the core thickness is around 1.55 mm; each face sheet thickness is around 0.375 mm. In addition, a schematic of the dimensions in sandwich nanocomposite structure is shown in Fig 2.9.
2.3 Material characterization
In order to understand micro-structure of the nanocomposites further, TEM (transmission electron microscope) analysis was selected to investigate the dispersing situation of inclusions in matrix (epoxy). Samples (particulate nanocomposite) for TEM was cut into an 80 nm slice
by Reichert-Jung Ultracut E microtome, and such thin slice was put into TEM (JEOL JEM-1400, NCHU) operating at accelerating voltage 120 KV for developing analysis.
Fig 2.10 [28] shows TEM images of a cured silica/epoxy nanocomposite at 10 wt% loading. Silica is well scattered and dispersed uniformly in the matrix. Also, the diameter of silica is around 20 nm in 100,000 magnification photograph, and the silica doesn’t show any aggregation.
Fig 2.11 shows TEM images of a cured CTBN/epoxy nanocomposite at 10 wt% loading. CTBN is well scattered and uniformly in the matrix, and doesn’t show any aggregation. The magnification in Fig 2.11 is 8000 and 15000, respectively; the diameter of CTBN is around 600 nm. Fig 2.12 shows TEM images of a cured CTBN/epoxy nanocomposite at 30 wt% loading. CTBN is well scattered in the matrix, but could be found having partial aggregation. The magnification in Fig 2.12 is 6000 and 15000, respectively.
Fig 2.13 shows TEM images of a cured silica/CTBN/epoxy nanocomposite at 10 wt% loading of each inclusion. Silica and CTBN are well scattered in the matrix, and doesn’t show any aggregation. The magnification in Fig 2.13 is 20000 and 50000, respectively.
Fig 2.14 shows TEM images of a cured CSR/epoxy nanocomposite at 10 wt% loading. CSR is dispersed uniformly in the matrix, and doesn’t show any aggregation. The magnification in Fig 2.14 is 8000 and 15000, respectively.
Fig 2.15 [29] shows TEM images of a cured silica/CSR/epoxy nanocomposite at 10 wt% loading of each inclusion. Silica and CSR are well scattered in the matrix, and doesn’t show any aggregation. The magnification in Fig 2.15 is 20000 and 50000, respectively.
Fig 2.16 shows TEM images of a cured organoclay/epoxy nanocomposite at 2.5 wt% loading. It can be found that clay platelet is dispersed uniformly in the matrix, and doesn’t show any aggregation. The magnification in Fig 2.16 is 6000 and 20000, respectively.
Chapter 3 Experiment
This research investigates the damping responses and dynamic mechanical properties of the particulate nanocomposites using vibration test; dynamic mechanical analysis (DMA) test is assisted in validating those results. Furthermore, the damping responses and dynamic mechanical properties of the sandwich nanocomposite structure are also characterized by vibration test.
3.1 Damping characterization of particulate nanocomposites
3.1.1 Apparatus for vibration test
In this research, forced vibration technique was applied to measure the natural frequency and the damping behaviors of the nanocomposite plates. The principal components of the apparatus consisted of the test specimen (pure nanocomposite and sandwich nanocomposite structure), shaker (Vibration Exciter Type 4809, B&K, Inc), power supply for vibrometer, power amplifier (LV 5507, AE Techron, Inc) accompany with shaker, FFT analyzer (OM25 OMETRON FFT Analyzer), and laser vibrometer (VP2108, OMETRON [30]). A schematic of the vibration apparatus is shown in Fig 3.1. The specimen was supported horizontally as a cantilever beam in the clamped block which was adhered to the shaker. The FFT analyzer generated input signals to excite the shaker, and these signals were considered as the input signal to the system. Subsequently, the vibratory response was detected by a non-contacting laser vibrometer which measured the velocity response of the specimen. Besides, the laser vibrometer was connected with the FFT analyzer in the same way, transferring signals from the laser vibrometer to a FFT analyzer. The corresponding software in a computer (4000 series, OMETRON) was used to read and analyze the digital data from the FFT. During the experiments, in order to have the high resolution in the frequency domain, the maximum value of resolution, i.e. 1600 was assigned. In this research, the first and second natural frequencies of nanocomposites are around 25 Hz and 155 Hz respectively. Thus, the
frequency domain bandwidth was adjusted to be 100 Hz for the first mode vibration and 200 Hz for the second mode vibration. In addition, from the relation , the total time required for one test can be determined. For example, in the first mode vibration,
Hz, and thus, the total time period for one test is 16 seconds. Therefore, the typical input (shaker) and output (laser vibrometer) spectrum curve via FFT are shown in Figs 3.2 and 3.3 respectively. Besides, the noise effects on the spectrums were eliminated and minimized through signal enhancement procedures [31] to attain the smooth curves. Figs 3.4 and 3.5 are the examples of the input and output spectrums before and after the signal enhancement procedures. Figs 3.4 (b) and 3.5 (b) show the noise effects can be reduced efficiently through those signal average concepts.
f T = /1 Δ 0625 . 0 1600 / 100 = = Δf
3.1.2 Determination of vibration damping
After signal processing, the half-power bandwidth method [32] was then used to determine the damping ratio in frequency spectrum. As mention in the above section, the first two modal loss factors were characterized in the vibration test. The data in frequency domain was accurate enough when the resolution in frequency domain was adjusted to the optimum value. Next, the typical half power bandwidth method was applied to the frequency response function (FRF) curve to evaluate the damping ratio or loss factor which could be illustrated in Fig 3.6 and presented in following equation [33]
n f f E E Δ = = = = = π ψ ζ δ η 2 2 tan ' " (3.1)
where η is the loss factor of material, tanδ is the loss tangent of material, "
E is the loss
modulus of material, '
E is the storage modulus of material, ζ is the damping ration, ψ is
in Fig 3.6, and is the corresponding natural frequency. The FRF is defined as the ratio of the output signal (displacement, velocity, or acceleration) to the input signal (force), and
the related units are:
n f N m , N s m , and N s m 2
. Moreover, the corresponding physical meanings are receptance, mobility, and accelerance [34]. In this research, output responses detected by the laser vibrometer was velocity type, and thus the corresponding FRF was the mobility curve. However, the typical loss factor was determined from the receptance curve. Hence, in order to verify the computation results of damping responses between the mobility and receptance, the mobility curve was integrated a time with frequency. First, the receptance FRF and mobility FRF are defined as following equations [34]
) ( ) ( ) ( ω ω ω F x H = (3.2) ) ( ) ( ) ( ω ω ω F v Y = (3.3)
where x(ω) is the output spectrum of displacement , v(ω) is the output spectrum of velocity,
F(ω) is the input spectrum of the force, Y(ω) is the mobility FRF, and H(ω) is the receptance
FRF. Therefore, receptance FRF could be obtained as
) ( 1 ) ( ω ω ω Y i H = (3.4)
After every Y(ω) data in Fig 3.3 is divided by its frequency [34], H(ω) can be determined from Y(ω), which is shown in Fig 3.7. In addition, it is shown in Fig 3.2, that the spectrum of input (shaker) in the frequency domain basically is a constant. Therefore, the denominator of the mobility FRF was constant. For the convenience, only the output (laser vibrometer) data were adopted to determine the damping ratio in the half power bandwidth
method. Then, comparison of damping obtained from H(ω) and Y(ω) in Table 3.1 which indicates the differences of loss factor in mobility curve and receptance curves are not significant. Hence, the mobility FRF curve can be employed to measure the loss factor.
3.1.3 Determination of flexural modulus
After vibration test, the flexural modulus of nanocomposite could be determined by solving the Bernoulli-Euler equation with a cantilever beam boundary conditions. The detail derivation of the Bernoulli-Euler equation is not presented at this point but can be found elsewhere in the literature [32]. The frequency equation was then obtained as:
2 / 1 2 2 ) ( 2 ) ( A EI L L k f n n = π ρ (3.3)
where is the nth natural frequency of test specimen through vibration test, I the is moment of inertia of cross section about centroidal axis of the test specimen, A is the cross-sectional area of the test specimen, ρ is the mass density of the test specimen, L is the free length of the test specimen, the values for the first two modes are
n f 875 . 1 1L= k and , and E is
the flexural modulus of nanocomposite specimen. Therefore, the flexural modulus of nanocomposite could be finally obtained via Eq. (3.3).
694 . 4
2L=
k
3.1.4 Dynamic mechanical analysis
Dynamic mechanical analysis (DMA) is one of the common methods for characterizing the mechanical properties of composite materials such as: storage modulus, loss modulus, loss factor (tanδ), and glass transition temperature; the above properties are measured by a dynamic mechanical analyzer. Menard [35] gave a statement of DMA: DMA can be simply described as applying an oscillating force to a sample and analyzing the material’s response to
that force. From this, one calculates properties like the tendency to flow (called viscosity) from the phase lag and the stiffness (modulus) from the sample recovery. These properties are often described as the ability to lose energy as heat (damping) and the ability to recover from deformation (elasticity). Thus, Fig 3.8 [35] shows how a DMA work. The DMA supplied an oscillatory force, causing a sinusoidal stress to the sample, which generates a sinusoidal strain as well. By measuring both the amplitude of the deformation at the peak of the sine wave and the phase lag between the stress and strain sine waves, those quantities like the modulus, the viscosity, and the damping could be calculated. The above explanation was just an introduction of DMA, and thus, more information of DMA could be found in the literature [35].
In this research, the dynamic mechanical analysis (DMA) tests were conducted to determine the dynamic moduli: Storage modulus (
E
'
) and loss factor (tanδ) of each materialsystem (neat epoxy, silica/epoxy nanocomposite, CTBN/epoxy nanocomposite, silica/CTBN/epoxy nanocomposite, CSR/epoxy nanocomposite, silica/CSR/epoxy nanocomposite, and organoclay/epoxy nanocomposite). Analytical & Bio Science Instruments co., ltd. were commissioned to test above samples for current research by using a Perkin-Elmer Instruments dynamic mechanical analyzer 8000 (DMA 8000) at room temperature with varying frequency from 1 Hz to 200 Hz at 10 points (0.1, 1, 10, 50, 75, 100, 125, 150, 175, and 200 Hz) under duel cantilever mode with the specimen dimensions as the following: 40 mm in free length, 5 mm in width, and 3 mm in thickness (Fig 3.9). In addition, DMA 8000 used in this research was supplied by Perkin-Elmer Instruments and was shown in Fig 3.10.
3.2 Damping characterization of nanocomposite sandwich structures
In this section, forced vibration technique was also applied to measure the natural frequency and the damping behaviors of the sandwich nanocomposite structure with different
core materials. The testing apparatus is the same as in section 3.1.1, which is shown in Fig 3.1. Then, in the real time analysis of the FFT software, there are 4096 data in time domain at a time of the analysis which is the same as in section 3.1.1; the resolution in the frequency domain was 1601 as well. In this section, only the first mode result was characterized in the vibration test. The first natural frequency of sandwich nanocomposite is around 150 Hz; for the specimen dimensions: 145 mm in free length, 10 mm in width, and 2.3 mm in thickness. The size of free length may be adjusted slightly in the test for the same reason as mentioned in section 3.1.1. Hence, the size of frequency domain is 200 Hz for measuring the most accurate first mode result of the test. Therefore, the time period is 8 seconds at a time of the test from the relation between time period and frequency sampling rate mentioned above. After the vibration test, the loss factor of test sandwich specimen was determined by Eq. (3.1). Assuming that the criteria for the use of effective modulus theory have been met [33], this equation can be used for unidirectional sandwich nanocomposite structure without coupling if the modulus E in Eq. (3.1) is replaced by the effective flexural modulus, here. Thus, the effective flexural modulus of sandwich specimen could be determined by Eq. (3.3).
f
Chapter 4 Analysis and Discussion
4.1 Experimental results
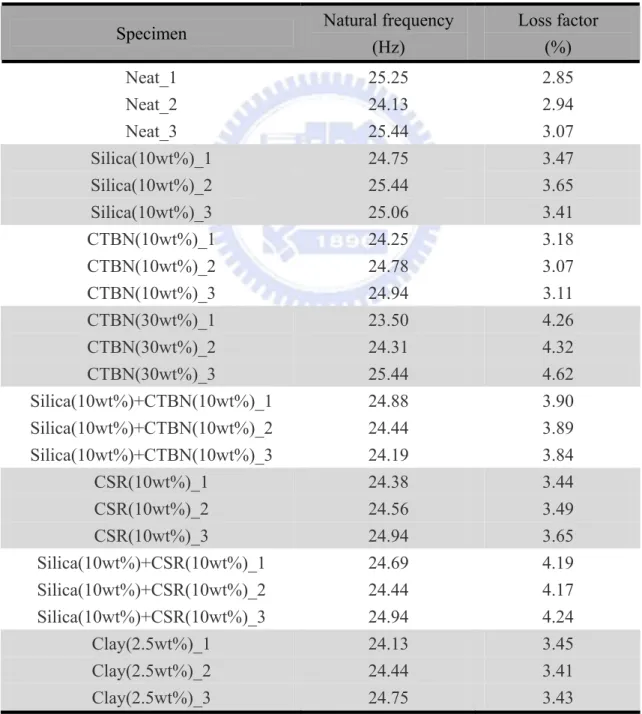
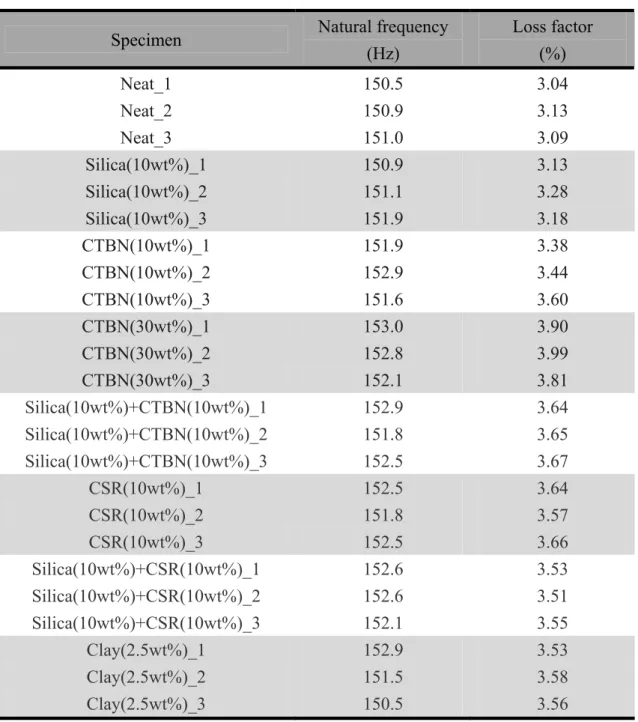
4.1.1 Vibration test results of particulate nanocomposites
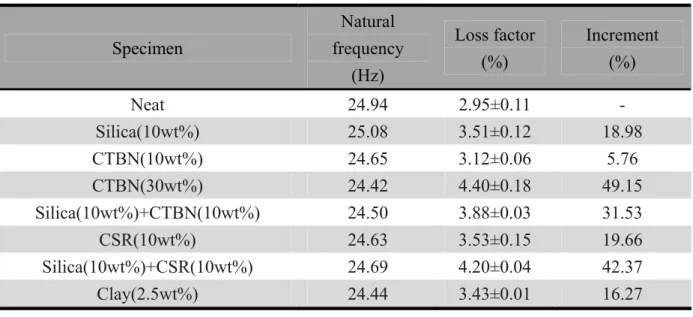
Tables 4.1 and 4.2 present all test data of nanocomposites with different inclusion vibrating in the first mode and in the second mode, respectively. The averaged values as well as the corresponding increment in terms of natural frequency and loss factor in the first mode and in the second mode are shown in Tables 4.3 and 4.4 respectively. For simplicity, the values presented in Tables 3 and 4 are illustrated in Figs 4.1 and 4.2. It is indicated that the nanocomposites exhibit higher damping response than the pure epoxy resin in the first and second vibrating mode. In addition, the loss factor of 30 wt% CTBN nanocomposites is the highest among the tested samples with around 49.15% increment in the first mode and 32.88% increment in the second mode with respective to the pure epoxy samples. Theses results coincided with the previous findings [11-14] that the damping properties can be enhanced by adding soft rubber inclusions into polymer resins. However, the deficiency of inclusion of rubber particle into epoxy resin is the significant reduction of the stiffness. Based on the current results, it is interesting to mention that the damping quality of nanocomposite can be improved by the silica nanoparticles (18.19% increment in the first mode and 10.96% in the second mode respectively). If we can combine the advantage of silica nanoparticles and rubber particles to form a hybrid nanocomposite, it is possible to have a new nanocomposite with improved damping property and high stiffness. Thus, the silica-CSR hybrid nanocomposite and the silica-CTBN hybrid nanocomposite was prepared and tested in the vibration tests. It was found from Figs 4.1 and 4.2 that both material systems still demonstrate superior damping responses as compared to other cases. Thus, the contribution of silica nanoparticles and rubber particle can be added together such that the hybrid nanocomposites can have better damping performance.
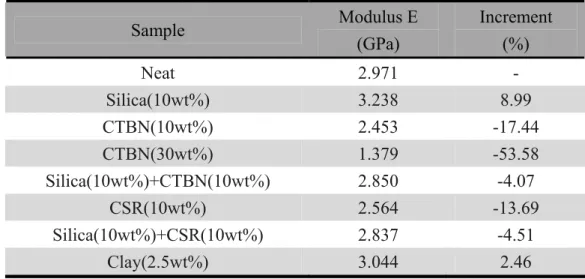
stiffness of the nanocomposites, the flexural modulus of the nanocomposite were determined from the natural frequency measured in the vibration test. The flexural modulus determined from the first mode and the second mode experimental data were shown in Tables 4.5 and 4.6 respectively. The associated results are plotted in Figs 4.3 and 4.4 respectively. It demonstrates that the flexural modulus increases with adding silica nanoparticles and clay platelet into the epoxy matrix. Moreover, the decrease of the flexural modulus occurs after soft rubber particles are blended into the epoxy matrix, especially for 30 wt% CTBN nanocomposite. The decrement of flexural modulus in 30 wt% CTBN nanocomposite is up to 53%. By adding silica nanoparticles together with soft rubber particles into nanocomposite, the stiffness of nanocomposite is close to that in pure epoxy resin. As a result, the hybrid nanocomposite systems can demonstrate excellent damping properties without loosing its flexural stiffness.
4.1.2 DMA test results of particulate nanocomposites
DMA tests on particulate nanocomposites with varying frequencies are presented in Fig 4.11. Each curve plotted in Fig 4.5 was obtained from a curve fitting procedure in terms of 10 data points (0.1, 1, 10, 50, 75, 100, 125, 150, 175, and 200 Hz). The purpose of DMA test is to validate damping properties of the nanocomposites measured in the vibration tests. In order to compare the loss factors obtained from the DMA tests with those in the vibration tests, the data points corresponding to the frequency of 25 Hz were selected from Fig 4.11 to represent the loss factor of the samples determined in DMA tests and the results are illustrated in Table 4.7. It is found that the loss factors determined from the vibration tests have a good agreement with those in DMA tests. Subsequently, the loss factor measured from the DMA tests at 150 Hz was presented in Table 4.8 and the associated results were plotted in Fig 4.6. Comparison of Figs 4.2 with 4.6 indicates that the loss factors obtained from DMA tests and vibration tests are close to each other. As a result, after the confirmation of DMA tests, the
current vibration technique can be used effective to determine the damping properties of nanocomposites.
4.1.3 Vibration test results of sandwich nanocomposite structure
In addition to the damping properties of nanocomposites, the damping responses of sandwich structures embedded with the nanocomposites as core material were also investigated by means of the vibration tests. The natural frequency and loss factor of the sandwich structure embedded with different nanocomposites are illustrated in Table 4.9. The averaged values and the associated increment with respective to the base materials were also presented in Tables 4.10 and plotted in Fig 4.7. It demonstrates that the damping property of sandwich structure with particulate nanocomposite core is better than that with the pure epoxy core at frequencies of 150-160 Hz. It is found that the loss factor of sandwich structure with 30 wt% CTBN nanocomposite embedded still has the best damping properties. Furthermore, sandwich structure embedded with silica-CTBN hybrid inclusions nanocomposite also show good damping property with 18.12% increment. Therefore, based on the above observation, it was found that the damping property of stiffer structure can be promoted with the particulate nanocomposite as core material interleaved.
Subsequently, in order to understand the flexural stiffness of sandwich structure embedded with a nanocomposite core material, the effective flexural modulus determined from the first mode experimental data are illustrated in Table 4.11. It can be seen that the variations of effective flexural modulus of different sandwich structures are not significant. Even though the sandwich structure is interleaved with 30 wt% CTBN/epoxy nanocomposite, the variation of the effective flexural modulus is just less than 5% compared to that with the pure epoxy. However, this is not a surprising result, since the stiffness of the sandwich structure is governed by the graphite/epoxy face sheet. Therefore, the variation of the stiffness in the nanocomposite core basically has no apparent influence on the entire effective
flexural modulus. As a result, the sandwich structure with 30 wt% CTBN/epoxy nanocomposite interleaved can indicate excellent damping properties than other cases.
4.2 Micromechanical model
In order to understand the effect of the ingredients on the dynamic properties of nanocomposites, a micromechanical model [26] in conjunction with the viscoelastic correspondence principle [37] was employed in the following analysis. This research basically follows the procedure given in [26, 36]. It is noted, the inclusion in the analysis is the spherical shape rather than the oblate-spheroids present in the literature [26].
The volume fraction of the matrix and spherical inclusion are and , and thus the average strain (
m
c cp
ε ), the average stress (σ ), and the complex constitutive matrix ( ) can be expressed as follow * C p p m m c c ε ε ε = + (4.1) p p m m c c σ σ σ = + (4.2) ε σ * C = (4.3)
where εm is the average strain of matrix, ε p is the average strain of spherical inclusion, m
σ is the average stress of matrix, σ p is the average stress of spherical inclusion, and
, in which and are the composite storage and loss constitutive matrix. It was assumed that silica was randomly and uniformly distributed and perfectly bonded to the surrounding matrix. With these assumptions, the composite complex modulus is given as [26] " ' * iC C C = + C' C"
1 * * * * * =( + )( + )− p p p m p p p m mC c C A c I c C A c C (4.4)
where and are the complex constitutive matrix of spherical inclusions and epoxy matrix, respectively, I is the identity tensor, and is the complex dilute strain concentration tensor of the inclusions. Thus, the complex in Eq. (4.4) can be divided into two parts, i.e., real part and imaginary part. The real part is so called the storage modulus and the imaginary part indicates loss modulus. In addition, the complex dilute strain-concentration tensor in Eq. (4.4) is expressed as [26]
* m C C*p * p A * C 1 * * 1 * * * =[ + ( )− ( − )]− m p m Esh p I S C C C A (4.5)
where * is the complex Eshelby tensor the explicit terms of which [38] are shown as
Esh S * * ijkl Esh S S = (4.6) ) 1 ( 15 5 7 * * * 3333 * 2222 * 1111 m m v S S S − − = = = ν (4.7) 1 15 1 5 * * * 2211 * 3322 * 1133 * 3311 * 2233 * 1122 − − = = = = = = m m v S S S S S S ν (4.8) ) 1 ( 15 5 4 * * * 3131 * 2323 * 1212 m m v S S S − − = = = ν (4.9)
where is the complex Poisson’s ratio of the matrix. The loss factor (tanδ) could be defined as the ratio of the loss modulus to the storage modulus. In addition, the source code of the micromechanical model is shown in Appendix B.
*
m
v
The storage and loss moduli of epoxy were calculated based on the natural frequency and loss factor listed in Table 4.4 and the complex Poisson’s ratio was found in the reference [26], while the material properties of silica nanoparticles were obtained from reference [28]. It is noted that the silica nanoparticles was assumed to be inclusion without any damping characteristic. Nanocomposites with 10 wt% and 20 wt% silica nanoparticles loading were selected to as examples in the micromechanical model. Table 4.13 shows the calculated results of storage modulus and loss factor of 10 wt% and 20 wt% silica nanocomposites. The results indicate that the storage modulus increased with increasing filler loadings of silica. However, the loss factor is slightly decreased with the introduction of silica nanoparticles, which is not consistent with the experiment results. The possible reason for the discrepancy could be due to the micro-morphology change of the polymer chain caused by the presence of the silica nanoparticles. In addition, the local stress concentration may induce the interfacial debonding taking place and the contact friction during the vibration may be the other mechanism to dissipate the energy. Apparently, the conventional simply micromechanical model may not be able to include all the mechanism and lose the capability in describing the damping behavior of nanocomposites. An analytical model that can account for the polymer morphology effect as well as the condition of the interface is necessary in order to comprehensively predict the damping responses of the nanocomposites. The continuum mechanics concept in conjunction with the molecular simulation, so called multi-scale simulation, may be an effective manner to achieve the above goal.
4.3 Finite element analysis
In light of the forgoing, the nanocomposite beam and sandwich structure was tested in forced vibration for the measurement of the corresponding damping properties. In fact, during the vibration test, the nanocomposites beams basically is subjected to tension and compression loading (extension mode), however, the nanocomposite core within a sandwich
structure may be under combined extension and shear modes depending on the relative thickness of the core material. The energy dissipation capacity for these two modes may not be the same. In order to understand the influence of the vibration modes (i.e., extension mode and shear mode) on the damping properties of nanocomposites, the tested samples were modeled using FEM analysis. The dissipated energy due to shear deformation as well as the dissipated energy in extension mode
zx
E
Δ
xx
E
Δ was evaluated from FEM analysis and then, the ratio of the two modes was calculated accordingly. Moreover, the finite element method (FEM) static analysis was also employed to simulate the vibration of the nanocomposite in the DMA test. Here, the first bending mode is taken as an example to demonstrate the procedure, how to determine those ratio from FEM analysis. The nodal displacements of the nanocomposite associated with the vibrating in the first mode were evaluated after the modal analysis was conducted. In this research, the FEM analysis was conducted using a commercial code, ANSYS 10.0 with SOLID45 element.
4.3.1 FEM modal analysis of the nanocomposite
Fig 4.9 illustrated the mesh plot of nanocomposite plate with the clamped-free boundary condition, and the associated mode shapes were presented in Fig 4.10. In this study, the pure epoxy was selected as an analysis example; the corresponding material properties are listed respectively in Table 4.14, which were found in reference [28, 39]. The dimensions of the epoxy plate are 180 mm in free length, 15 mm in width, and 3 mm in thickness which are the same as those used in the vibration test. After conducting the modal analysis, the nodal displacements of the nanocomposite associated with the first vibration mode were evaluated. Those nodal displacements of the nanocomposite were then regarded as a boundary condition of the nanocomposite in a FEM static analysis. Thus, the corresponding strain energy (due to shear deformation), and (due to extension deformation) of the nanocomposite was calculated as
zx
E
xx
∑
∑
= = = = m k k zx k zx m k k zx zx U E 1 1 ) ( 2 1σ ε (4.10)∑
∑
= = = = m k k xx k xx m k k xx xx U E 1 1 ) ( 2 1σ ε (4.11)where indicates the shear strain energy in the kth element, indicates the
normal strain energy in the kth element, and indicates the shear stress and shear strain in the kth element, and and indicates the normal stress and normal
strain in the kth element. Moreover, the corresponding dissipated energy and
) (k zx U Ezx k zx σ k xx ε ) (k xx U E Δ xx E εzxk k xx σ zx ΔExx,
of the nanocomposite were computed as the following
zx shear zx E E =ψ Δ (4.12) xx xx E E =ψ Δ (4.13)
where ψ is the specific damping capacity of the nanocomposite in extension, and ψshear is the specific damping capacity of the nanocomposite in shear deformation. All the values can be found in [39].
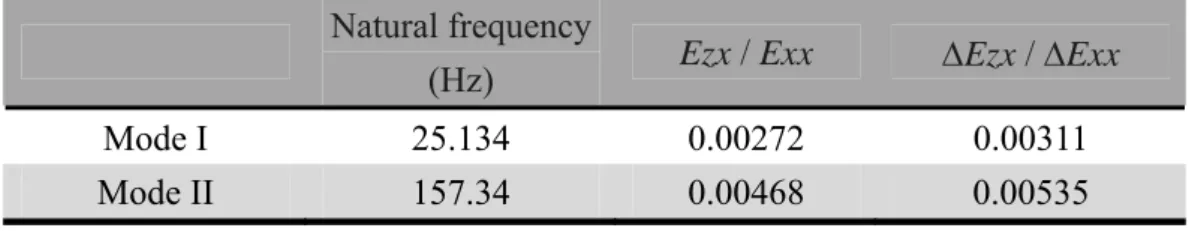
For the first two bending modes, the ratio of strain energy ratio, i.e. and dissipated energy ratio were listed in Table 4.15. It can be seen that dissipated energy ratio are much less than 1, and thus the energy dissipation mechanism of the epoxy plate in the vibration motion is dominated by the extension mode.
xx zx E E / , xx zx E E Δ Δ /
4.3.2 Simulation of the nanocomposite in the DMA test by FEM analysis
In the same manner, the dissipated energy ratio ΔEzx/ΔExx in the DMA test was
fixed-fixed boundary condition under a sinusoidal oscillation in the middle section was considered in the FEM model. A mesh diagram of the nanocomposite rod with applied displacement boundary condition 0.05 mm is illustrated in Fig 4.11. The material properties for the DMA simulation were also found in Table 4.14, and the dimensions of the epoxy rod are 40 mm in length, 5 mm in width, and 3 mm in thickness which is the same as the test specimen employed in the DMA test.
Fig 4.12 presented deformation shape of the epoxy rod under both end fixed boundary condition through the FEM static analysis. The ratio of the energy dissipation is shown in Table 4.16. It can be seen that, the energy dissipation mechanism of the epoxy rod in the DMA simulation is still dominated by the extension mode.
4.3.3 FEM modal analysis of the sandwich structure
A schematic of the sandwich structure with the cantilever-type boundary condition was
shown in Fig 4.13. The stacking sequence of the sandwich structure is [03/d/03], where d is
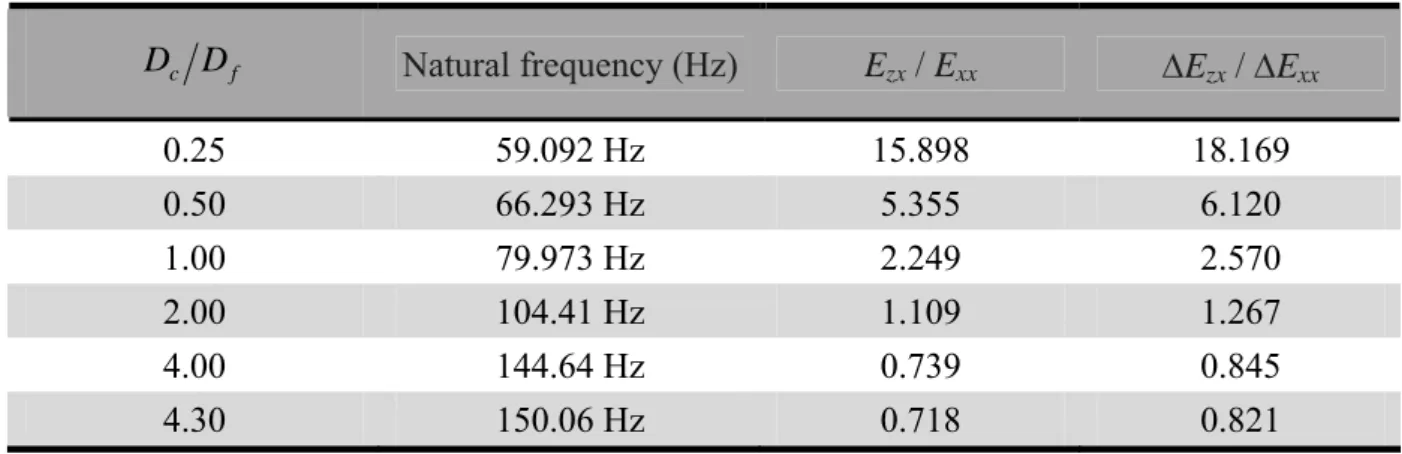
the epoxy core, and the material properties of the sandwich structure were shown respectively in Tables 4.14 and 4.17, which were found in the reference [28, 39-40]. The dimensions of the sandwich laminates are 145 mm in length, 10 mm in width. The thickness of the unidirectional composite face sheet is 0.36 mm. It is known that the energy dissipated mechanisms of the core material were affected by the core thickness; therefore, the influence of the core thickness on the dominant damping mode of the core materials was examined by adjusting core thicknesses, i.e. 0.09, 0.18, 0.36, 0.72, 1.44, and 1.55 mm. For the sake of simplicity, the thickness of the core is defined as Dc and the thickness of the face sheet is
denoted as Df. Thus, the ratio of the core thickness to face sheet thickness is expressed as
f c
D
D .