Design and control of homogeneous and
heterogeneous reactive distillation for ethyl acetate
process
Hao-Yeh Lee
a, Hsiao-Ping Huang
a*, and I-Lung Chien
baDepartment of Chemical Engineering, National Taiwan University, Taipei 106, Taiwan.
bDepartment of Chemical Engineering, National Taiwan University of Science and
Technology, Taipei 106, Taiwan.
Abstract
This paper compares conceptual design and control of two reactive distillation (RD) processes for the production of ethyl acetate (EtAc) using homogeneous and heterogeneous catalysts. The homogeneous catalytic RD process has higher capital cost but less energy cost and less concern about the catalyst installation and frequent replacement. The heterogeneous catalytic process has faster reactions in both forward and reverse directions than those of the homogeneous one. Thus, it needs less reactive hold-up and less number of trays to achieve the product specifications. The column composition profiles are with quite different form for these two cases. As for the control of these two catalytic RD processes, they also have quite different dynamic behaviours. From our study, heterogeneous catalytic process has faster closed-loop response and lower steady-state offset in final product purity in the face of throughput and feed composition disturbances than the homogeneous ones.
Keywords: Reactive Distillation, Heterogeneous Catalyst, Homogeneous Catalyst,
TAC
1. Introduction
Esters are of great importance to chemical process industries. Among them, EtAc is an important organic solvent widely used in the production of varnishes, ink, synthetic resins, and adhesive agents. This ester is typically produced from the reaction of acetic acid(HAc) and ethanol(EtOH). In literature, Keyes[1] first reported the study of an ethyl acetate process using a reactive distillation column in combination with a pre-esterification reactor, two recovery columns, and a decanter. Later, the progresses on the steady-state simulation for the RD column were studied by Chang and Seader[2] using homotopy-continuation method, and by Simandl and Svrcek[3] using inside-outside method, and by Alejski and Duprat[4] formulating dynamic mathematical model with experimental validation. Bock et al.[5] then presented an uncatalyzed RD column
with excess EtOH and a pressurized recovery column. Vora and Daoutidis[6] studied the operation and control of a single RD column, but the top product is not pure enough. The resulting designs from the above both works aforementioned are not economical, because the outlet streams are out of specifications and need to treat further. Tang et al.[7] studied the process which contains sulfuric acid as catalyst using an RD column
with an overhead decanter and a stripping column. Highly pure EtAc product was obtained and all the outlet streams meet product and environmental specifications. Tang
et. al. [8] provides generalization for the study of design of reactive distillation with
____________________
*Corresponding author. H. P. Huang, Tel: 886-2-2363-8999; Fax: 886-2-2362-3935., E-mail: [email protected]
W. Marquardt, C. Pantelides (Editors)
acetic acid as one feed. In that paper for EtAc process, Purolite CT179 as heterogeneous catalyst was used. The objective of this paper is to compare the process design and control dynamics of these two kinds of reaction distillation design with homogenous catalyst in [7] and heterogeneous catalyst in [8].
2. Phase equilibria and reaction kinetics
To account for non-ideal vapor-liquid equilibrium and possible vapor-liquid-liquid equilibrium for this quaternary system, the NRTL[8] model is used for activity coefficients. Because the processes are to be operated under atmospheric pressure, the vapor phase non-ideality considered is the dimerization of acetic acid as described by the Hayden-O’Conell[9] second virial coefficient model. The NRTL coefficients are given by Tang et al.[7]
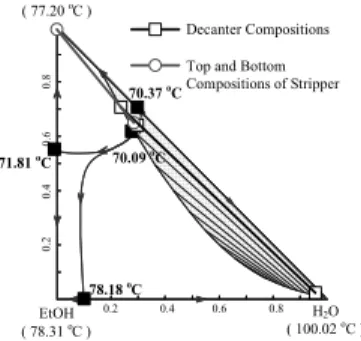
For the EtAc quaternary system, the models predict three minimum boiling binary azeotrpes and one minimum boiling ternary azeotrope. With the data computed for azeotropic systems encountered in this esterification process, the residual curve map (RCM) diagrams of EtAc-EtOH-H2O is plotted and given in Fig.1. In this diagram,
significant liquid-liquid (LL) envelope is observed. The ternary minimum boiling azeotrope lies closely on the edge of LL envelope. In this system, the tie lines slop toward pure water node, consequently, relatively pure water can be recovered from the LL separation in this esterification process.
0. 2 0. 4 0. 6 0. 8 0.2 0.4 0.6 0.8 H2O ( 100.02oC ) EtOH ( 78.31oC ) EtAc ( 77.20 oC ) 70.09oC 70.37 oC 71.81oC 78.18oC Decanter Compositions Top and Bottom Compositions of Stripper
Fig. 1. RCM diagram for EtOH-EtAc-H2O system
Table 1 Kinetic equations for homogeneous and heterogeneous catalyst EtAc systems.
System
(Catalyst) Kinetic model (T=363K) k1 (T=363K) Keq
(i) EtAc (sulfuric acid)
r = k1CHAcCEtOH – (k1/Kc)CEtAcCH2O
k1 =1000×(4.195Ck + 0.08815) exp(– 6500.1/T ) Kc = 7.558 – 0.012T 1.1568×10⁻⁵ [kmol/m3·s] 3.2 (ii) EtAc (Purolite CT179) Pseudo-homogeneous model
(
2)
1.5 1 1cat HAc EtOH EtAc H O
r m k x x= −k x x− k1 = 4.24×10³exp(– 48300/RT ) k-1 = 4.55×10⁵exp(– 66200/RT ) 4.78×10⁻⁴ [kmol/(kgcat·s)] 3.50 *R=8.314[kJ/kmol/K], T[K], r[kmol/s], m
cat[kgcat], Ci[kmol/m3], xi[mole fraction],
Ck=[vol%]. (i) Alejski and Duprat[4], (ii) Hangx et al.[11]
The chemical reaction kinetic model with sulfuric acid as homogeneous catalyst is adopted from the paper[4]. The sulfuric acid concentration is assumed to be 0.4 vol%. Since this catalyst concentration is quite low, it can be neglected in the vapor-liquid equilibrium calculation. The solid catalyst in use is the acidic ion-exchange resin
Purolite CT179 in the pseudo-homogeneous model for EtAc. The reaction rates are expressed in Table 1. Notice that, in the heterogeneous catalyst system, the kinetics is catalyst weight-based. In applying the reaction kinetics to a reactive distillation, it is assumed that the solid catalyst occupies 50% of the tray holdup volume and a catalyst density of 770 kg/m3 is used to convert the volume into catalyst weight (m
cat).
3. Steady state design and discussion
In a previous study[7][8], It was found that, in this type of process, the reactive section should be extended to the column base of the RD column and, therefore, a much larger holdup is expected in the bottom of the RD column. In this work, the column base holdup is taken to be 10 times of the tray holdup.
Based on the similar process flow sheet, the optimal steady-state design is proceeded by systematic procedures. In this study, the feed composition of EtOH is 0.87 mole fraction slightly less than their azeotrope compositions. The feed of acetic acid is 0.95 mole fraction in this system. The specifications include: 50 kmol/hr of EtAc product (99 mole%) in the bottom of the stripper accompanied by less than 0.01 mole% HAc impurity. In the search for the optimal designs for these two cases, all the simulations are carried out using ASPEN PLUS with the RADFRAC module provided with FORTRAN subroutines for the reaction rates. For a system with a given production rate with product specifications, the design steps are:
(1) Set the reactants feed ratio to 1 initially (i.e., FR = FHAc /FEtOH= 1).
(2) Fix the number of reactive trays (Nrxn).
(3) Place the heavy reactant feed (NFHAc) on the top of the reactive zone and introduce the light
reactant feed (NFEtOH) on the lowest tray of the reactive zone.
(4) Guess the tray numbers in the rectifying section (NR) and the stripping section (NS).
(5) Change the organic reflux flow (R) and stripper reboiler duty (QR, S) until the product specifications
are met.
(6) Go back to (4) and change NR and NS until the total annual cost (TAC) is minimized.
(7) Go back to (3) and find the feed locations (NFHAc & NFEtOH) until the TAC is minimized.
(8) Go back to (2) and vary Nrxn until the TAC is minimized.
(9) Go back to (1) and change the feed ratio (FR) until the TAC is minimized.
The TAC of the following is used to evaluate for the optimal design.
TAC = operating cost+(capital cost/payback year) (1)
Where, the operating cost includes the costs of steam, cooling water, and catalyst, and the capital cost covers the cost of the column, trays, and heat exchangers. The results of the two catalyst systems are given in Table 2. The developed process flow sheets are given in Fig. 2(a) and Fig. 2(b) as well.
Stripper Decanter RD Column HAc Feed 50.8 kmol/hr 95.0 mol% Organic Reflux 315.57 kmol/hr 12 1 Aqueous Product 60.44 kmol/hr HAc = 1.0072e-03 mol
EtOH = 2.17 mol% EtAc = 1.50 mol% Water = 96.33 mol% 55 10 EtOH feed 57.472 kmol/hr 87.0 mol%
Feed to Stripper 230.59 kmol/hr HAc = 2.16e-03 mol%
EtOH = 5.67 mol% EtAc = 71.52 mol% Water = 22.82 mol% Product 47.83 kmol/hr HAc = 0.01 mol% EtOH = 0.90 mol% EtAc =99.00 mol% Water = 0.09 mol% 1 Cooling Water -786 kW -4084.51 kW Condenser -1743.08 kW Condenser Steam Heat duty = 4300.77 KW Steam Heat duty = 2058.66 KW 37 Bottom recycle 1 mol/s HAc = 85.5 mol% EtOH = 3.2 mol% EtAc = 3.6 mol% Water = 7.7 mol% 9 54 Stripper Decanter RD Column HAc Feed 50.8 kmol/hr 95.0 mol% Organic Reflux 390.87 kmol/hr 10 19 1 9 Aqueous Product 60.45 kmol/hr HAc =1.05e-03 mol%
EtOH = 2.18 mol% EtAc = 1.50 mol% Water = 96.32 mol% 20 10 EtOH feed 57.472 kmol/hr 87.0 mol%
Feed to Stripper 221.54 kmol/hr HAc = 2.25e-03 mol%
EtOH = 5.68 mol% EtAc = 71.48 mol% Water = 22.84 mol%
Product 41.61 kmol/hr HAc = 1.00e-2 mol% EtOH = 9.12e-1 mol% EtAc = 99.00 mol% Water = 7.88e-2 mol% 1 Cooling Water Duty = -881.45 KW Condenser Duty= -4789.92 KW Condenser Duty = -1668.73 KW Steam Heat duty = 5113.40 KW Steam Heat duty = 1979.01 KW
Fig. 2. The process flow sheet of EtAc process (a) homogeneous, and (b) heterogeneous systems
Comparisons of the results with these two EtAc systems, the configuration of process flow sheet is basically the same except for the homogeneous case needs a recycle stream to circulate the sulfuric acid in the RD column. From Table 2, the homogeneous and heterogeneous systems have almost the same stages of rectifying section and stripper. However, homogeneous system has larger capital cost in the reactive zone because of larger residence time is needed due to lower reaction rate. Although with larger capital cost in homogeneous system, the energy cost of this case is 11% less than the heterogeneous one. Another point is that only very few sulfuric acid is needed, thus the catalyst cost can be neglected in the homogeneous system. As the result in Table 2, the final TAC of homogeneous system is a little less than heterogeneous one.
Table 2. The design results of EtAc process with homogeneous and heterogeneous catalysts
System Homogeneous Heterogeneous
Column configuration RD Stripper RD Stripper
Total No. of trays including the reboiler 55 10 20 10
No. of trays in reactive section (Nrxn) 44 11
No. of trays in rectifying Section (NR) 11 9
Column diameter (m) 3 1.313 2.04 1.37
Weir height (m) 0.1524 0.0508 0.1016 0.0508
Decanter temperature (°C) 40 40
Total capital cost ($1000) 829.25 700.3
Catalyst cost($1000/year) 0 71.24
Energy cost($1000/year) 519 584.87
TAC ($1000/year) (50 kmol/hr) 1348.25 1356.41
Fig. 3 displays the compositions profiles of these two systems. The column composition profiles are with quite different form in the reactive zone, even though they have the same compositions in the top and bottom streams of the RD column. These two different reaction kinetics lead the composition from opposite way to approach EtOH/EtAc/H2O ternary azeotrope. Different reaction kinetics have significantly effect
on the design of EtAc process under the same thermodynamic properties.
0.0 0.2 0.4 0.6 0.8 1.0 0.0 0.2 0.4 0.6 0.8 1.0
Liquid Composition Profile
RD Column
Stripper
Vapor Composition Profile
RD Column Stripper XB XA H2O (100.02 o C) HAc (118.01 oC) EtOH (78.31 oC) EtAc (77.20 o C) 70.09 oC 70.37 o C 71.81 oC 78.18 o C 0.0 0.2 0.4 0.6 0.8 1.0 0.0 0.2 0.4 0.6 0.8 1.0
Liquid Composition Profile
RD Column
Stripper
Vapor Composition Profile
RD Column Stripper XB XA H2O (100.02 oC) HAc (118.01 oC) EtOH (78.31 oC) EtAc (77.20 oC) 70.09 oC 70.37 oC 71.81 oC 78.18 oC
Fig. 3. Composition profiles in the EtAc process (a) homogeneous, and (b) heterogeneous systems
4. Dynamic control
The non-square relative gain (NRG) of Chang and Yu[12] is used to find the temperature control trays. The NRG (ΛN) is defined as:
ΛN= K
p⊗ (K p+)T (2)
where Kp is the steady-state gain matrix, ⊗ denotes the element-by-element multiplication, the superscript + is the pseudo-inverse, and the superscript T means the
transpose. In this work, open-loop tests use FR and QR, S as the manipulating variables to find the steady state gains. The largest row sum of the NRG is selected as the temperature control trays. Fig. 4 shows the row sums for these two systems, thus, the controlled variables for homogeneous system are TRDC,4 and TSTR,7; and for
heterogeneous system are TRDC,5 and TSTR,7. The control parings of these two systems
are straightforward to use FR to control TRDC and QR, S to control TSTR.
1 5 9 13 17 2125 29 33 37 41 45 49 53 57 61 65 -0.2 0.0 0.2 0.4 0.6 0.8 1.0 -0.002 0.000 0.002 0.004 0.006 0.008 0.010 RD co lu m n R S (i) Stage [-] Stripper RD 2 6 10 Stri pp er R S (i )
-0.21 3 5 7 9 11 13 15 17 19 21 23 25 27 29 0.0 0.2 0.4 0.6 0.8 1.0 -0.0002 0.0000 0.0002 0.0004 0.0006 0.0008 0.0010 RD co lu mn RS (i) Stage [-] Stripper RD 1 3 5 7 9 St rip pe r RS (i)
Fig. 4. NRG and selected temperature control trays (a) homogeneous (b) heterogeneous systems
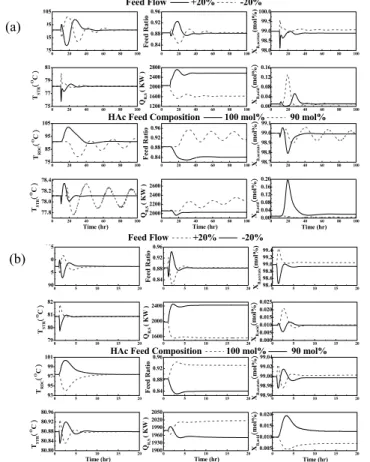
0 20 40 60 80 100 75 85 95 105 0 20 40 60 80 100 0.84 0.88 0.92 0.96 0 20 40 60 80 100 98.0 98.5 99.0 99.5 100.0 0 20 40 60 80 100 75 77 79 81 0 20 40 60 80 100 75 85 95 105 TST R ( OC ) 0 20 40 60 80 100 1200 1600 2000 2400 2800 F eed Rat io 0 20 40 60 80 100 0.00 0.04 0.08 0.12 0.16 XB,ac et at e ( mo l% ) XB,ac et at e (m ol % ) XB,a ci d ( mo l% ) QR, S ( KW ) TRD C ( OC ) TRD C ( OC ) TSTR ( OC ) 0 20 40 60 80 100 0.84 0.88 0.92 0.96 Feed Rati o 0 20 40 60 80 100 98.7 98.8 98.9 99.0 99.1 0 20 40 60 80 100 77.8 78.0 78.2 78.4 0 20 40 60 80 100 2000 2200 2400 2600 QR, S ( KW ) 0 20 40 60 80 100 0.00 0.04 0.08 0.12 0.16 0.20 Time (hr) Time (hr) Time (hr) Feed Flow +20% -20%
HAc Feed Composition 100 mol% 90 mol%
XB,ac id ( mol % ) 0 5 10 15 20 90 95 100 105 0 5 10 15 20 0.84 0.88 0.92 0.96 0 5 10 15 20 98.4 98.6 98.8 99.0 99.2 99.4 0 5 10 15 20 79 80 81 82 0 5 10 15 20 93 95 97 99 101 TSTR ( OC ) 0 5 10 15 20 1600 2000 2400 Fe ed R at io 0 5 10 15 20 0.000 0.005 0.010 0.015 0.020 0.025 XB, acet at e ( mo l% ) XB,acet at e (m ol % ) XB,ac id ( mo l% ) QR, S ( KW ) TRDC ( OC ) TRDC ( OC ) TST R ( OC ) 0 5 10 15 20 0.84 0.88 0.92 0.96 Fee d Ra ti o 0 5 10 15 20 98.96 98.98 99.00 99.02 99.04 0 5 10 15 20 80.80 80.84 80.88 80.92 80.96 0 5 10 15 20 1900 1930 1960 1990 2020 2050 QR, S ( KW ) 0 5 10 15 20 0.005 0.010 0.015 0.020 Time (hr) Time (hr) Time (hr) Feed Flow +20% -20%
HAc Feed Composition 100 mol% 90 mol%
XB, ac id ( mo l% )
Fig. 5. Temperature control responses for disturbances rejection (a) homogeneous (b) heterogeneous systems
(a)
(b)
In the dynamic simulation, ±20% throughput changes and ±5 mol% HAc feed composition disturbances are used to evaluate the control performance for these two systems. Fig. 5 shows that the closed-loop responses of these two systems under simple PI temperature control. For the homogeneous system, slower responses and much more oscillatory responses are found in Fig. 5(a). Especially for the negative disturbances which need more than 100 hours to settle and exhibit larger overshoot in the HAc impurity. Also note that the closed-loop behavior of the homogeneous system is quite nonlinear for the temperature control loops.
For the heterogeneous system, faster responses and much symmetrical responses can be obtained as shown in Fig. 5(b). The product composition settles in less than 10 hours and much smaller offsets in the EtAc composition can be achieved. From the steady-state design, the TAC of homogeneous system is a little cheaper than heterogeneous system. However from the dynamic responses, heterogeneous system exhibits less overshoot and faster as well as more symmetrical temperature control performance for disturbances rejection than homogeneous system.
5. Conclusion
In this study, it is found that the two RD processes have similar flow-sheet configurations. Each includes an RD column, a decanter, and a stripper. Due to the use of sulfuric acid as catalyst with slower reaction rate, the homogeneous catalytic RD process has higher capital cost but less energy cost and less concern about the catalyst installation and frequent replacement. Due to the use of Purolite CT179, the heterogeneous catalytic process has faster reaction rates in both forward and reverse directions than those of the homogeneous one. Thus, it needs less reactive hold-up and less number of trays to achieve the product specifications. As for the control, heterogeneous catalytic process has faster response and lower steady-state offset than the homogeneous ones. Because of faster reaction rate for the heterogeneous system implies less hold-up and thus faster process dynamics. As a result, better control performance can be obtained for the heterogeneous EtAc RD process.
Acknowledgment
This work is supported by the Ministry of Economic Affair under grant 94-EC-17-A-09-S1-019.
References
[1] D. B. Keyes, Ind. Eng. Chem. 24, (1932) 1096-1103.
[2] Y. A. Chang and J. D. Seader, Comput. Chem. Eng., 12, (1988) 1243-1255. [3] J. Simandl and W. Y. Svrcek, Comput. Chem. Eng., 15, (1991) 337-348. [4] K. Alejski, and F. Duprat, Chem. Eng. Sci. 51 (1996) 4237-4252.
[5] H. Bock, M. Jimoh, and G. Wozny, Chem. Eng. Technol. 20 (1997) 182-191. [6] N. Vora and P. Daoutidis; Ind. Eng. Chem. Res., 40, (2001) 833-849.
[7] Y. T. Tang, H. P. Huang, and I-L. Chien., J. Chem. Eng. Japan 36, (2003) 1352.
[8] Y.T. Tang, Y.W. Chen, S.B. Hung, H.P. Huang, M.J. Lee and C.C. Yu., AIChE J. 51, (2005) 1683-1699.
[9] H. Renon, and J. M. Prausnitz. AIChE J. 14, (1968) 135.
[10] J. G. Hayden, and J. P. O'Connell, Ind. Eng. Chem. Process Des. Dev. 14 (1975) 209-216. [11] G. Hangx, G. Kwant, H. Maessen, P. Markusse and I. Urseanu. Technical Report to the
European Commission (2001), (http://www.cpi.umist.ac.uk/intint/NonConf_Doc.asp) [12] J. W. Chang, and C. C. Yu,. Chem. Eng. Sci., 45, (1990) 1309.