國 立 交 通 大 學
多 媒 體 工 程 研 究 所
碩 士 論 文
利用環場攝影機於車內做基於擴增實境技術的室外園
區導覽
In-car Tour Guidance in Outdoor Park Areas Based on
Augmented Reality Techniques Using an Omni-camera
研 究 生:衛彥成
指導教授:蔡文祥 教授
利用環場攝影機於車內做基於擴增實境技術的室外園區導覽
In-car Tour Guidance in Outdoor Park Areas Based on Augmented
Reality Techniques Using an Omni-camera
研 究 生:衛彥成 Student:Yen-Cheng Wei
指導教授:蔡文祥 Advisor:Wen-Hsiang Tsai
國 立 交 通 大 學
多 媒 體 工 程 研 究 所
碩 士 論 文
A ThesisSubmitted to Institute of Multimedia Engineering College of Computer Science
National Chiao Tung University in partial Fulfillment of the Requirements
for the Degree of Master
in
Computer Science
June 2013
Hsinchu, Taiwan, Republic of China
In-car Tour Guidance in Outdoor Park Areas Based
on Augmented Reality Techniques Using an
Omni-camera
Student: Yen-Cheng Wei
Advisor: Wen-Hsiang Tsai
Institute of Multimedia Engineering,
College of Computer Science
National Chiao Tung University
ABSTRACT
In this study, an augmented-reality based tour guidance system for use in park areas using a vehicle and computer vision techniques has been proposed. With the proposed system, a user in the vehicle driven in a park area can get from the system tour guidance information about the names of nearby buildings along the path. The building names are augmented on the passenger-view image which is displayed on the mobile device held by the user in the vehicle.
To implement the proposed system with the augmented reality function, firstly an environment map is generated in the learning phase, which includes the information about the path of the tour, the along-path line features which can be detected for vehicle localization, and the building names. All the data are learned either manually or semi-automatic, and saved into the database for use in the navigation phase.
Secondly, a method for detecting along-path vertical-line features which appear in the omni-image is used to localize the vehicle. The method detects edges in the input omni-image, and analyzes them to detect continuous or broken vertical lines
with widths.
Next, a method for vehicle localization is proposed, which analyzes the detected line features and computes the vehicle position by a modified longest common subsequence algorithm. Meanwhile, motion vectors are used to estimate the vehicle speed for locating the vehicle when there is no detectable feature around the vehicle.
Finally, a method is proposed for generating a passenger-view image by transforming the omni-image acquired from the omni-camera onto the user’s mobile-device screen. And with the passenger-view image as a base, a method has been designed to augment the building name on the image for display according to the computed position of the building yielded by the vehicle localization process.
Good experimental results are also presented to show the feasibility of the proposed methods for real applications.
利用環場攝影機於車內做基於擴增實境技術的室外園
區導覽
研究生: 衛彥成
指導教授:蔡文祥 博士
國立交通大學多媒體工程研究所
摘要
本 研究利用車輛 與電腦視覺技 術,建立一 個基於擴增實境 (augmented reality; AR)技術的室外園區導覽系統。利用此系統,使用者開車在園區時可以 接收到導覽資訊,例如路徑上車輛周圍之建築物名稱。此導覽資訊出現在車內使 用者的手持裝置上影像的建築物上。 為實現此一擴增實境導覽系統,本研究首先在學習階段建立環境地圖,地圖 中包含導覽的路徑、周圍欲偵測之垂直線特徵、附近建築物所在位置及其名稱等 資料。所有資料經過手動或半自動的學習之後,會儲存至一資料庫以供導航階段 使用。 接下來,本研究提出一個利用環場影像偵測路徑上車輛周圍的垂直特徵物進 行車輛定位的方法,該系統利用環場攝影機取得之影像來分析垂直線,垂直線即 使不連續或是有寬度仍然能夠偵測出來。 此外,本研究利用最長共同子序列的演算法分析偵測到的直線,並計算出車 輛的位置,來對車輛進行定位。若無法用特徵物做定位,則利用動態向量(motion vector)來預估車輛速度,藉以計算車輛所到達位置。 最後,本研究利用環場攝影機所取得的影像經過轉換後,產生出模擬副駕駛 看出車外的影像,並且將此影像顯示在手持裝置上。同時,以此影像為基底,並 利用車輛定位的結果,將建築物在影像上的位置計算出來,藉以疊加此建築物的 名稱在該影像上。ACKNOWLEDGEMENTS
The author is in hearty appreciation of the continuous guidance, discussions, and support from his advisor, Dr. Wen-Hsiang Tsai, not only in the development of this thesis, but also in every aspect of his personal growth.
Appreciation is also given to the colleagues of the Computer Vision Laboratory in the Institute of Computer Science and Engineering at National Chiao Tung University for their suggestions and help during his thesis study.
Finally, the author also extends his profound thanks to his dear mom and dad for their lasting love, care, and encouragement.
CONTENTS
ABSTRACT (in English) ... i
ABSTRACT (in Chinese) ... iii
ACKNOWLEDGEMENTS ... v
CONTENTS ... vi
LIST OF FIGURES... x
LIST OF TABLES ... xvi
Chapter 1 Introduction ... 1
1.1 Background and Motivation ... 1
1.2 Survey of Related Studies ... 4
1.3 Overview of Proposed Methods ... 5
1.3.1 Terminologies ... 5
1.3.2 Brief Descriptions of Proposed System ... 5
1.4 Contributions ... 8
1.5 Thesis Organization ... 9
Chapter 2 System Design and Processes ... 10
2.1 Ideas of Proposed Method ... 10
2.2 System of Configuration ... 12 2.2.1 Hardware Configuration ... 13 2.2.2 Software Configuration... 15 2.2.3 Network Configuration ... 16 2.3 Network System ... 17 2.3.1 Server-side System ... 17 2.3.2 Client-side System ... 18
2.3.3 Cooperation between Client and Server Sides ... 18
2.4 System Processes ... 20
2.4.2 Navigation Process ... 21
Chapter 3 Learning of Environments ... 23
3.1 Ideas of Proposed Environment Learning Techniques ... 23
3.2 Coordinate Systems Used in This Study ... 24
3.3 Construction of Environment Map ... 25
3.3.1 Information Included in Environment Map ... 26
3.3.2 Creation of Database for Environment Map ... 27
3.4 Learning of Environment Features ... 28
3.4.1 Learning of Navigation Paths... 28
3.4.2 Learning of Vertical Lines in Environments ... 30
3.4.3 Learning of Building Information ... 34
3.5 Experimental Results ... 35
Chapter 4 Automatic Detection of Vertical Lines in Environments with an Omni-camera... 37
4.1 Introduction ... 37
4.2 Idea of Analysis of Vertical Lines in Omni-images ... 38
4.3 Detection of Vertical Lines in Environments... 44
4.3.1 Initial Detection by Canny Edge Detector ... 44
4.3.2 Detection of Lines with Widths ... 45
4.3.3 Detection of Broken Lines ... 47
4.4 Algorithm for Vertical Line Detectin ... 49
4.5 Experimental Results ... 51
Chapter 5 Vehicle Localization for Tour Guidance in Outdoor Park Areas by Computer Vision Techniques ... 54
5.1 Introduction ... 54
5.2.1 Computation of Motion Vectors ... 55
5.2.2 Vehicle Speed Estimation Using Motion Vectors... 57
5.3 Vehicle Localization by Single Line Features ... 58
5.3.1 Idea of Vehicle Localization by Line Features ... 59
5.3.2 Algorithm for Vehicle Localization by Single Line Features ... 60
5.4 Vehicle Localization by Multiple Line Features ... 61
5.4.1 Review of Longest Common Subsequence (LCS) Algorithm .... 61
5.4.2 Vehicle Localization using Multiple Features by LCS Algorithm 63 5.5 Knowledge-based Analysis of Tours ... 64
5.5.1 Uses of Knowledge about Environments... 64
5.5.2 Algorithm for Vehicle Localization in Tours ... 66
5.6 Experimental Results ... 67
Chapter 6 Proposed Augmented Reality-Based Tour Guidance Using an Omni-camera... 70
6.1 Ideas of Proposed Techniques... 70
6.2 Construction of Images from Front Passenger’s View ... 71
6.2.1 Construction of Image-to-space Mapping Table ... 71
6.2.2 Review of Adopted Method for Perspective-view Image Generation ... 79
6.2.3 Review of Generation of Perspective-mapping Table ... 82
6.2.4 Generation of Passenger-view Image ... 84
6.3 Augmenting Names of Buildings on Passenger-view Images ... 88
6.3.1 Calculating Positions of Buildings in Passenger-view Images ... 89
6.3.2 Algorithm of Augmenting Names of Buildings on Images ... 90
6.4.1 Ideas of Tour Guidance in Park Areas ... 93
6.4.2 Algorithm for Tour Guidance in Park Areas ... 93
6.5 Experimental Results ... 95
Chapter 7 Experimental Results and Discussions ... 97
7.1 Experimental Results ... 97
7.2 Discussions ...101
Chapter 8 Conclusions and Suggestions for Future Works ...103
8.1 Conclusions ...103
LIST OF FIGURES
Figure 1.1 Proposed AR-based tour guidance system. (a) Image of the used vehicle. (b) Illustration of proposed AR-based guidance system working on a
moving vehicle. ... 3
Figure 1.2 A flowchart of proposed learning process. ... 7
Figure 1.3 A flowchart of proposed navigation process. ... 8
Figure 2.1The video surveillance vehicle used in this study with an omni-camera affixed on the car roof. (a) A front view of the vehicle. (b) A side view of the vehicle. ... 10
Figure 2.2 Positions of the omni-imaging device affixed to the video surveillance vehicle roof and the corresponding FOV. (a) The device is affixed at the rear-middle of the car roof. (b) The device is affixed at the right-front of the car roof. ... 11
Figure 2.3 Structure of the proposed surveillance system. ... 13
Figure 2.4 The component of the camera device and entire device. (a) AISYS ALTAIR U500C cameras. (b) JHF8M-5MP lens. (c) Entire camera device. ... 15
Figure 2.5 The architecture of the local network used in this study. ... 16
Figure 2.6 Cooperation between client and server sides. ... 19
Figure 2.7 Flowchart of learning process. ... 21
Figure 2.8 Flowchart of proposed tour guidance system. ... 22
Figure 3.1 The three coordinate systems used in the proposed system. (a) The global coordinate system. (b) The camera coordinate system. (c) The image coordinate system. ... 25
Figure 3.2 User interface for real-world map construction by use of OpenStreetMap.
... 26
Figure 3.3 The real-world map we use in the proposed system. ... 27
Figure 3.4 The vehicle on a path while detecting a feature. (a) An illustration of the vehicle driving on the path. (b) An omni-image with a detected feature a light pole. ... 30
Figure 3.5 Illustrations of multiple feature detection. (a) Illustration of detected feature on the map. (b) The angle of features detected. (c) Illustration of calculating the angle of θf. ... 32
Figure 3.6 Learning of buildings. (a) An illustration of learning the building. (b)The result of learning the building in the map. ... 34
Figure 3.7 The environment map we use in the proposed system. ... 36
Figure 3.8 The environment map with the path. ... 36
Figure 3.9 The environment map with the path and features. ... 36
Figure 4.1 Camera and image coordinate systems. ... 40
Figure 4.2 Illustration of a space line projected on to the image plane. ... 41
Figure 4.3 An illustration of detection of lines with widths in the image. The black boxes are line points; the yellow area is the region we define as a line; and the red line specifies the direction of this line. ... 46
Figure 4.4 An illustration of a line detection. The black painted box is line points. The red painted box is the scan point Ps. The green painted box is the neighbor points Pn. ... 47
Figure 4.5 An illustration of a broken line detection. (a) A broken line with a 80% density. (b) Two lines whose overall density is 80%. ... 48 Figure 4.6 An illustration of vertical lines in an omni-image. The area of red points are the center of the omni-image, and each green line corresponds to a
vertical line in the real-world space. ... 50 Figure 4.7 Illustrations of the phenonmenon that a vertical line become a radial line in the omni-image. (a) Scene 1. (b) Scene 2. ... 52 Figure 4.8 Results of Canny edge detection. (A) Result of Figure 4.7(a). (B) Result of Figure 4.7(b). ... 52 Figure 4.9 Results of vertical line detection. (a) Result obtained from Figure 4.8(a). (b) Result obtained from Figure 4.8(b). ... 53 Figure 5.1 An illustration of searching for the best-match macroblock... 55 Figure 5.2 An illustration of cutting a part of the omni-image for motion vector computation. The area enclosed by the red line is the part we cut. ... 57 Figure 5.3 An illustration of locating the vehicle. (a) An omni-image with a detected line feature. (b) An illustration of locating the vehicle on the map. ... 59 Figure 5.4 An Illustration Of Omni-Image. (A) The Omni-Image Which Divided Two Parts. (B) Two parts of image and the purple line is direction of system to detect the line features. ... 65 Figure 5.5 Detected motion vectors in an omni-image. (a) The original image. (b) The detected motion vectors. ... 68 Figure 5.6 The localization of vehicle by using single feature. (a) The omni-image acquired from the camera. (b) A binary omni-image, in which the red line is the detected line feature. (c) The map showing the position of vehicle where the red point is the position of the vehicle and the blue points are the positions of features. ... 68 Figure 5.7 Vehicle localization by using multiple features. (a) The omni-image acquired from the camera. (b) A binary omni-image, in which the red lines indicate detected line features. (c) The map showing the position of vehicle, where the red point is the position of the vehicle and the blue
points are the positions of the detected features. ... 69
Figure 6.1 The space points and their corresponding image points. ... 72
Figure 6.2 Finding out the focal point Om. ... 73
Figure 6.3 The interface for acquiring the data of the world space points. ... 74
Figure 6.4 Nonlinear property of an omni-camera with mirror surface shape. ... 75
Figure 6.5 Mapping between pano-mapping table and omni-image. ... 77
Figure 6.6 Creation of pano-mapping table... 78
Figure 6.7 A Top-view configuration for generating a perspective-view image. ... 79
Figure 6.8 A lateral-view configuration for generating a perspective-view image. .. 82
Figure 6.9 Illustration of construction of a perspective-mapping table. (a) A Top-view configuration for generating a perspective-mapping table. (b) A lateral-view configuration for generating a perspective-view image. ... 84
Figure 6.10 An illustration of viewpoint in the vehicle. (a) Top-view of the vehicle where the blue star is the viewpoint and the red line is the region of the view. (b) Side-view of the vehicle where again the blue star is the viewpoint and the red line is the region of view. ... 85
Figure 6.11 An illustration of viewpoints through the windshield. (a) The left side angles, where the yellow line is a horizontal line with an angle of zero, and the red line is the boundary of the viewpoint. (b) The right side angles. (c) The upside angles, where the yellow line is a vertical line with an angle of zero, and the red line is the boundary of the viewpoint. (d) The downside angles. (e) all view of the viewpoint. ... 86 Figure 6.12 An illustration of shifting the viewpoint. (A) Top-view of shifting the viewpoint where the blue star is the viewpoint we set and the green star is the viewpoint of camera. (B) Side-view of shifting the viewpoint where the blue star is the viewpoint we set and the green star is the viewpoint of
camera... 87 Figure 6.13 Illustration of construction of passenger-view images. (a) A Top-view configuration for generating a passenger-view image. (b) A lateral-view configuration for generating a passenger-view image. ... 89 Figure 6.14 An illustration for calculating the angle of the direction to the building.90 Figure 6.15 An illustration for calculating the position of the building. ... 90 Figure 6.16 An illustration of calculating the building position. ... 91 Figure 6.17 An illustration of the view of the image. (a) The entire building can be seen in the image. (b) Only part of the building can be seen in the image. ... 91 Figure 6.18 (a)The omni-image acquired from the omni-camera. (b)The passenger-view image transformed from (a). (c)The omni-image acquired from the omni-camera. (d)The passenger-view image transformed from (c) ... 95 Figure 6.19 Two passenger-view images with the building names augmented. ... 96 Figure 7.1 The environment map we use in the proposed system. ... 97 Figure 7.2 An experimental result of the learning stage. (a) An image of the vehicle driven on the path and detecting the line feature. (b) An omni-image acquired from the omni-camera. (c) A line feature detected by the system. ... 98 Figure 7.3 An experimental result of detecting the line features and locating the vehicle. (a) An omni-image acquired from the omni-camera. (b) Another omni-image acquired from the omni-camera. (c) A line feature detected by the system. (d) Another line feature detected by the system. (e) The location of the vehicle computed by the system and indicated by the red point. (f) Another location of the vehicle computed by the system and
indicated by the red point. ... 99 Figure 7.4 AR-based navigation. (a) An image of the vehicle on the path. (b) An omni-image acquired with the omni-camera. (c) The passenger-view image with an augmented building name. (d) Another image of the vehicle on the path. (e) Another omni-image acquired with the omni-camra. (f) Another passenger-view image augmented with the building name. ...100
LIST OF TABLES
Table 2.1 Specifications of the laptop computers and the pad used in this study... 14 Table 2.2 Specification of the CMOS cameras used in the imaging device 15 Table 2.3 Specification of the lens used in the imaging device ... 15 Table 6.1 Example of pano-mapping table of size M×N ... 73
Chapter 1
Introduction
1.1 Background and Motivation
With the advance of technology, video cameras are widely used in many applications
that bring convenience in our daily life. For instance, a vehicle equipped with on-top
video cameras can help a driver to monitor surrounding environments and to be aware of
dangerous situations so that car accidents could be avoided. Furthermore, if people drive
cars which are equipped with video cameras working like digital event recorders, then
when car accidents occur, they can clarify the responsibility by checking the recorded
video.
Most researches of vision-based techniques are based on the use of traditional
projective video cameras, but the limited field of view (FOV) of this type of camera
causes some problems. For example, if we want to see all the views surrounding the car,
we need more than four projective cameras in general. This needs more cost and
superfluous computation time. Thus, we choose to use an omni-camera to be our imaging
equipment in this study.
Moreover, we can use this camera system to develop interesting and useful
applications by combining real-world images captured from the cameras and augmenting
them with guidance information created by computers for the purpose of tour guidance in
outdoor environments. In other words, the real-world environment can be augmented by
computer-generated information (labels, texts, objects, etc.) to enhance the perception of
In more detail, the AR technique can help implementing a car navigation system
which provides the driver with information of roads and surrounding buildings by
projecting the names on the windshield or on a display device such as an iPAD [1] in an
AR way. There exist products of head-up displays (HUDs) on the windshield, which can
show information like the vehicle speed and the engine speed. With the HUD, the driver
can easily catch the information from the HUD device instead of looking down at the
dashboard, allowing he/she to focus on driving without being disturbed. Sometimes, the
latter action of looking down is the reason of a car accident. In addition, although AR
techniques based on the Global Positioning System (GPS) are getting popular nowadays,
sometimes they are difficult to utilize for the purpose of car positioning because of their
imprecision in positioning with errors ranging from 3 to 15 meters. Also, the GPS does not work in tunnels or inside buildings.
Therefore, we propose in this study to integrate the uses of omni-cameras and AR
techniques with a vehicle to implement a more accurate and effective non-GPS guidance system for driving tours in park areas. Furthermore, instead of using the HUD device for displaying the augmented image, Chen and Tsai [1] showed the augmented image on an iPAD and projected the image onto the car windshield for the driver to inspect during driving without looking down. In this study, we, however, assume that the AR-based guidance information is to be inspected by a passenger sitting in the car, so we display the guidance information on the screen of an iPAD held by the passenger all the time during the driving guidance session. Moreover, in order to get the information of an environment map, we use computer vision techniques to obtain the positions of nearby buildings via analysis of the features in the omni-images acquired by the omni-camera.
In summary, the research goal in this study is to develop a tour guidance system for use by passengers in cars. To accomplish this goal, we use a vehicle equipped
with an omni-camera on the vehicle top as an experimental platform. Also, we use an iPAD as a display device for showing the augmented image. The iPAD is held by a passenger sitting in the car.
An image of the used vehicle is shown in Fig. 1.1(a) and an illustration of the proposed system is shown in Fig. 1.1(b). Listed below are more detailed descriptions of the desired capabilities of the proposed AR-based park-area guidance system.
Building 2 Building 1 Car Building1 / building2 Feature Omni-camera
Figure 1.1 Proposed AR-based tour guidance system. (a) Image of the used vehicle. (b) Illustration of proposed AR-based guidance system working on a moving vehicle.
1. The system can learn the environment map automatically.
2. The system can detect vertical line features in the environment automatically and measure their positions. It then marks the relative locations of the vehicle with respect to the line features on the environment map.
3. The system is capable of computing the accurate vehicle position so that relevant augmented information can be computed accordingly and displayed on the iPAD at correct locations.
4. The image appearing on the iPAD shows in an AR way as a combination of the real-world image and the nearby building names for tour guidance.
1.2 Survey of Related Studies
In this section, we give a survey of related studies, such as video surveillance, design of omni-cameras for uses on vehicles, vehicle navigation, AR techniques, etc. In recent years, video surveillance for various applications has been studied more intensively. For instance, Trivedi et al. [2] proposed methods to enhance driving safety by video surveillance systems using omni-cameras. In addition, Jeng and Tsai [3, 4] proposed a method based on the concept of pano-mapping table to calibrate omni-cameras without knowing the extrinsic parameters of the omni-cameras. Moreover, a new type of omni-vision system designed by combining two projective cameras and two mirrors attached back to back was proposed in Kuo and Tsai [5].
Furthermore, a lot of methods for vehicle navigation by using landmarks have been proposed. Betke and Gurvits [6] proposed a localization method to identify surrounding landmarks and find their locations in an environment map. For detection of landmarks in omni-images, Ho and Chen [7] proposed an algorithm to detect ellipses, and Wu and Tsai [8] proposed a method which uses the features of lines to localize the vehicle.
In a similar work, Grosch [9] proposed a method for vehicle navigation in the indoor environment by using panoramic images. Moreover, more and more outdoor environment applications using AR techniques have been proposed. Lee et al. [10] proposed a method using omni-camera to conduct object tracking in outdoor environments, simulating the user’s view with AR techniques. Reitmayr and Drummond [11] proposed a model-based tracking system for augmented reality in urban environments by using handheld devices. Furthermore, Sandor et al. [12] proposed a method that uses AR techniques for delivering information to a driver by a head-up display device.
1.3 Overview of Proposed Methods
1.3.1 Terminologies
The definitions of some related terms used in this study are described as follows. 1. Omni-camera: an omni-camera has a mirror with a hyperboloidal or other
geometric shape in front of a conventional projective camera, which projects a 360-degree surrounding scene onto the camera’s imaging plane to form an omni-image by the mirror surface reflection function.
2. Omni-image: the image captured with an omni-camera device.
3. Video surveillance vehicle: a car with an omni-camera equipped on the top of the car.
4. Environment map: a real-world map constructed by “OpenStreetMap” (an open source for the Internet) and including features learned by our system.
5. Features of vertical lines: features in the real world which has vertical-line shapes such as light poles on street sidewalks, edge lines on building walls, etc. 6. Perspective-view image: an image originally acquired with the omni-camera and
later perspectively-transformed into another image as it is seen by the human eye.
1.3.2 Brief Descriptions of Proposed System
There are four goals in the proposed system as described in the following.
1. The system is able to learn the environment objects automatically such as defined features, navigation paths, and building information on the map.
2. The system is able to detect vertical lines in outdoor environments.
vehicle.
4. The system is able to generate the passenger-view image for viewing on an iPAD and augment nearby building names on it.
In order to achieve the above goals, the system operations can be divided into two phases: the learning process and the navigation process. The following are the major steps of the learning process.
1. Construct a real-world map by the open source “OpenStreetMap” available on the Internet.
2. Select a path on the map, and specify manually as nodes the positions of landmarks (such as street light poles or wall edges on buildings), whose features are usable for vehicle localization, along the path on the map.
3. Set up the omni-camera on the top of video surveillance vehicle on the front-right corner, drive the vehicle to follow every node along the path, acquire an image of the node environment, “learn” (1) the features of the corresponding landmark in the acquired image and (2) the buildings which are located around the vehicle, and record the data into a database.
4. Calculate the corresponding relation of the path and the features automatically. A brief illustration of the above learning process is shown in Fig. 1.2. And the following are the major steps of the proposed navigation process.
1. Set up the t omni-camera on the top of video surveillance vehicle on the front-right corner.
2. Load environment map information learned in advance and the mapping table for the omni-image into the system.
3. Detect vertical line features in the surround of the video surveillance vehicle using the omni-camera.
environment map.
5. Calculate the position of the nearby building on the map by using the computed location of the vehicle.
6. Generate the passenger-view by transforming the omni-images acquired by the omni-camera.
7. Augment the building name on the passenger-view image.
8. Repeat the above steps until the vehicle reaches a pre-selected destination. A brief illustration of the above navigation process is shown in Fig. 1.3.
Process of Learning Stage
Start of Learning Process
Calculation the Corresponding Relation Detection of the feature
Learn the Features of Building Learn the Features of
Landmark
Record the Data into a Database Select a Path on the Map Construct the Real-world Map
Process of Navigation Stage
Start of Tour Guidance
Display Resulting Image Detection of features Generation of Passenger-view Image Calculation Position of the vehicle Calculation Position of the Building
Augment the Building name on Image
Figure 1.3 A flowchart of proposed navigation process.
1.4 Contributions
The following is a list of the major contributions made in this study. 1. A method is proposed to learn the environment map automatically.
2. A method for detecting features of vertical lines in outdoor environments using omni-camera is proposed.
3. A method for computing the position of the vehicle on a pre-selected path by detecting one or more vertical–line features in the real world is proposed.
4. A method for generating the passenger-view image by transforming the acquired omni-image and calculating the boundary position of the passenger’s view is proposed.
5. A method for computing the positions of buildings on the passenger-view image, and augmenting the names of the buildings on it is proposed.
6. A tour guidance system for use on a vehicle in a park area by using AR techniques and an omni-camera is proposed.
1.5 Thesis Organization
The remainder of this thesis is organized as follows. In Chapter 2, the configuration of the proposed system and the system processes are introduced in detail. In Chapter 3, the proposed method for constructing the environment map and learning of the environment is described. In Chapter 4, the proposed method for detecting vertical–line features in the outdoor environment with an omni-camera is presented. In Chapter 5, the proposed method for vehicle localization in tours in outdoor park environments by using computer vision techniques is described. In Chapter 6, the proposed method for AR-based tour guidance is presented. In Chapter 7, experimental results and discussions are included. Finally, conclusions and some suggestions for future works are given in Chapter 8.
Chapter 2
System Design and Processes
2.1 Ideas of Proposed Method
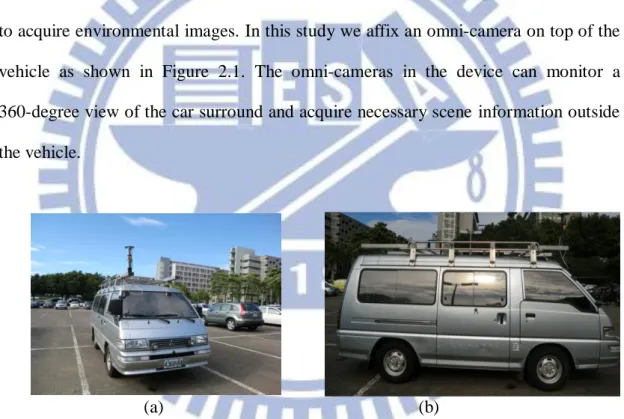
In order to monitor the surrounding environment of the video surveillance vehicle, we choose the use of omni-cameras instead of traditional projective cameras to acquire environmental images. In this study we affix an omni-camera on top of the vehicle as shown in Figure 2.1. The omni-cameras in the device can monitor a 360-degree view of the car surround and acquire necessary scene information outside the vehicle.
(a) (b)
Figure 2.1 The video surveillance vehicle used in this study with an omni-camera affixed on the car roof. (a) A front view of the vehicle. (b) A side view of the vehicle.
The video surveillance vehicle has high mobility so that we can move the system to everywhere. But we have to determine the best locations on top of the vehicle where the omni-imaging device should be affixed in order to enhance the imaging effect. As illustrated in Figures 2.2(a) and 2.2(b), if we affix the device at the front middle of the top of the vehicle, a half of the omni-image acquired with the
device will be occupied by the vehicle body. On the contrary, if we affix it at the right-front position on the top of the vehicle, only a quarter of the omni-image is occupied by the vehicle body instead. Therefore, in this study we decide to affix an omni-imaging device at the right-front of the top of the vehicle.
(a) (b)
Figure 2.2 Positions of the omni-imaging device affixed to the video surveillance vehicle roof and the corresponding FOV. (a) The device is affixed at the rear-middle of the car roof. (b) The device is affixed at the right-front of the car roof.
Furthermore, we choose the upper omni-camera in the omni-imaging device for capturing features at larger heights such as those of buildings and light poles. In more detail, it is noted at first that each omni-camera captures a view of a hemisphere shape, so we can use this wide view to detect the vertical lines in the environment. In addition, a characteristic of the vertical line in the real world, when projected into the omni-image, is that the line appearing in the omni-image will go through the center of the omni-image. Therefore, we may consider vertical lines in the real world as good features and detect them in omni-images utilizing this characteristic.
Next, we localize the vehicle using combinations of line features. For example, at some positions along navigation paths, the omni-camera may detect the feature lines of buildings and light poles in the meantime. In such cases, we regard the
combination of the two types of features as a new type of feature learned by the system.
Moreover, we generate perspective-view images, transform them into passenger-view images seen on the mobile device held by the passenger, and augment tour-guidance information on it. Even if the back-seat passenger in the vehicle can watch the front passenger’s view image on his/her own mobile device for tour guidance.
Finally, we implement the system by using a 4G/LTE network for data transmission. By using such a high-speed network, we can send the data to the server to achieve faster computations and send the results to the mobile device held by the passenger. Every passenger in the vehicle can view the tour guidance via the system. Furthermore, because we display the result on the web, even people not in the vehicle can also enjoy this AR-based tour guidance.
2.2 System of Configuration
In this section, we introduce the configuration of the proposed system in more detail. The hardware of the system includes: 1) a video surveillance vehicle, 2) an omni-camera, and 3) a laptop computer, 4) a server computer, and 5) a pad. The software includes: 1) a program used to integrate the components of the proposed system, 2) the drivers of the omni-cameras, and 3) the program for image acquisition developed by AYSIS VISION Company which is a provider of CCD cameras. The omni-camera is controlled by the laptop computer, and the pad receives information from theservercomputer which is kept at a cloud site.
2.2.1 Hardware Configuration
The surveillance vehicle, named Delica, is made by Mitsubishi Co. It is a vehicle with size 469cm×169cm×196cm with a working table and a power supply. System operators may sit inside the surveillance vehicle to operate the laptop computer and monitor the entire surrounding environment. Moreover, a steel frame is affixed to the top of the vehicle, on which the omni-imaging device is affixed. And extension USB cords and a cross-over cable crossing the video surveillance vehicle were added to facilitate transmitting images captured with the omni-imaging device. The entire video surveillance system is shown in Fig. 2.3.
4G/LET Network Server Computer Laptops surveillance vehicle Camera System Affixed on Pad
In order to control the entire guidance system, we use a laptop computer, a server computer, and a pad as control units, with the laptops handling the omni-imaging device. The laptop is produced by TOSHIBA Computer, Inc. The pad, named Eee Pad Slate B121, is produced by ASUS Computer, Inc. Detailed specifications of these devices are listed in Table 2.1.
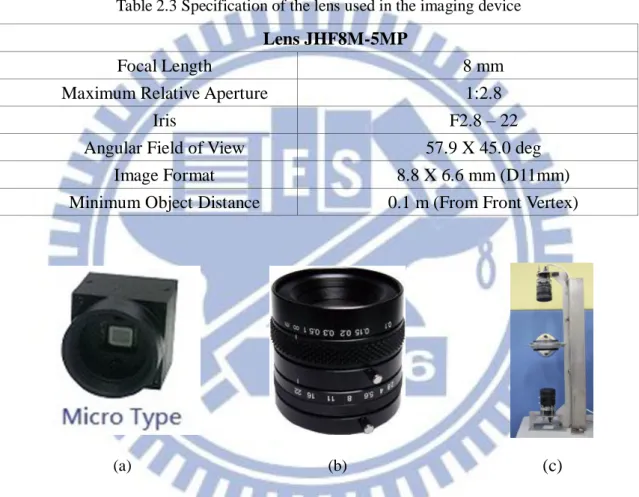
The omni-imaging device used in this study consists of two omni-cameras combined coaxially in the longitudinal direction, connected back to back, and tightened by a specially-designed steel holder. Each camera includes a lens of model JHF8M-5MP which is shown in Fig. 2.4(a), and a CMOS sensor of model AISYS ALTAIR U500C which is shown in Fig. 2.4(b). The JHF8M-5MP model is a mega-pixel lens with the parameters of 2/3", 8mm, and F2.8-22. The specification of the CMOS camera sensor is shown in Table 2.2 and the specification of the lens are shown in Table 2.3. The entire omni-imaging device shown in Fig. 2.4(c) is formed with a pair of AISYS ALTAIR U500C cameras and is affixed on the top of the steel holder.
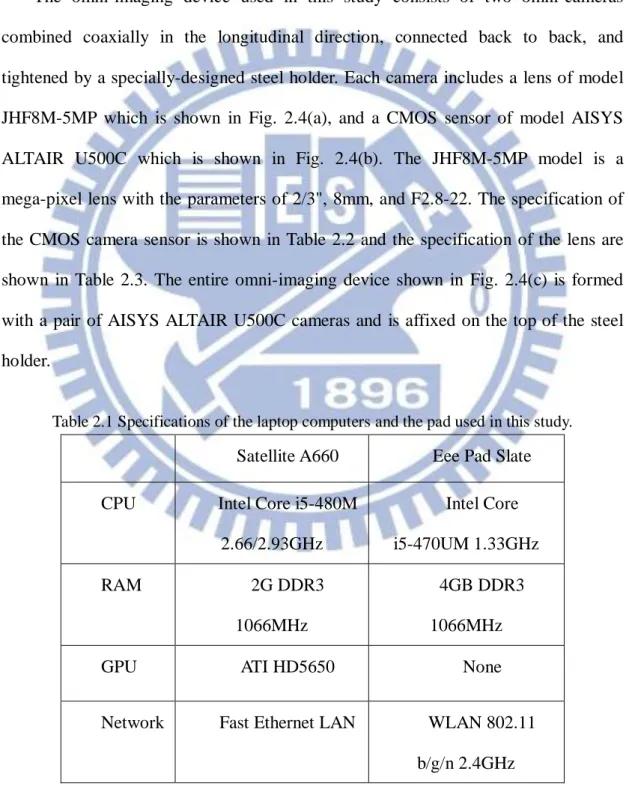
Table 2.1 Specifications of the laptop computers and the pad used in this study.
Satellite A660 Eee Pad Slate CPU Intel Core i5-480M
2.66/2.93GHz Intel Core i5-470UM 1.33GHz RAM 2G DDR3 1066MHz 4GB DDR3 1066MHz
GPU ATI HD5650 None
Network Fast Ethernet LAN WLAN 802.11 b/g/n 2.4GHz
Table 2.2 Specification of the CMOS cameras used in the imaging device AISYS ALTAIR U500Color Camera 5.0M
Sensor type CMOS
Sensor size 1/2.5" (5.70 x 4.28 mm)
Pixel size 2.2 x 2.2 μm
Frame per second
3~7 FPS
Transfer Type USB 2.0(480 million bytes per second)
Table 2.3 Specification of the lens used in the imaging device
(a) (b) (c)
Figure 2.4 The component of the camera device and entire device. (a) AISYS ALTAIR U500C cameras. (b) JHF8M-5MP lens. (c) Entire camera device.
2.2.2 Software Configuration
We use a Visual Studio 2010 (VS 2010) as the development platform to build our guidance system. The VS 2010 is a program development tool for the operating system of Windows. The programming language we use is C++. It is a widely used language. The laptop and the pad run under the operating system of Windows 7.
Lens JHF8M-5MP
Focal Length 8 mm
Maximum Relative Aperture 1:2.8
Iris F2.8 – 22
Angular Field of View 57.9 X 45.0 deg
Image Format 8.8 X 6.6 mm (D11mm)
In order to use the camera devices, we have to install the drivers of the ALTAIR U500C cameras into the laptop. The camera company also provides corresponding software development kits (SDKs). In addition, we can get the source codes and so we can understand the purpose of the call functions in the program. Accordingly, we can adjust the parameters of each camera, such as the value of exposure or the global color gain, through the SDK. Moreover, the camera company not only provides the VS 2010 but also the BCB, VB.NET, or C#.NET to the programmers.
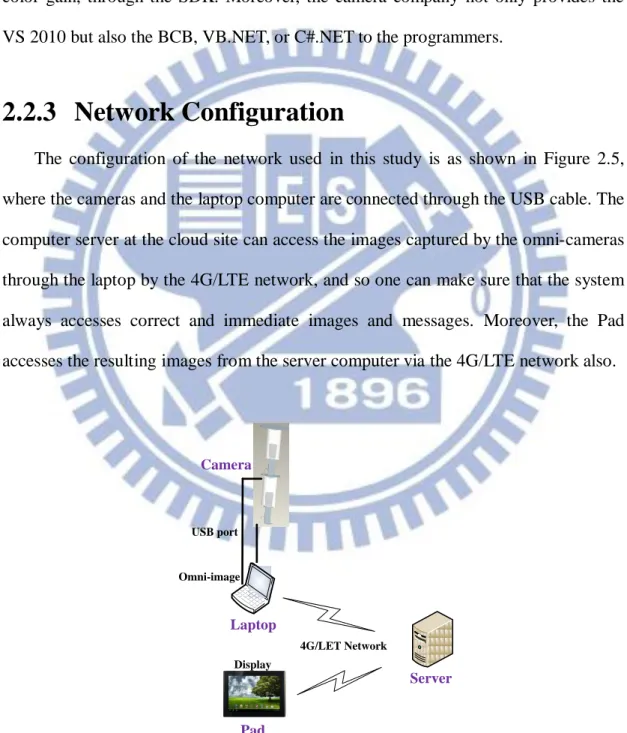
2.2.3 Network Configuration
The configuration of the network used in this study is as shown in Figure 2.5, where the cameras and the laptop computer are connected through the USB cable. The computer server at the cloud site can access the images captured by the omni-cameras through the laptop by the 4G/LTE network, and so one can make sure that the system always accesses correct and immediate images and messages. Moreover, the Pad accesses the resulting images from the server computer via the 4G/LTE network also.
Display USB port Laptop 4G/LET Network Pad Omni-image Server Camera
2.3 Network System
In this section, we describe in detail the design of the proposed network system used in this study. In Section 2.3.1, the server-side system used for conducting complicated works with long computing time in the server computer at the cloud site is described. In Section 2.3.2, we describe the client-side which includes two functions: 1) displaying the result on the pad device, and 2) sending the omni-image data to the servers. Finally, in Section 2.3.3, we will introduce the cooperative operations between the client and the server sides.
2.3.1 Server-side System
The server-side system runs on a virtual machine (VM) of the cloud server. It is connected to the laptop computer to send image data to the server, and the pad device receives the result from the server. Moreover, it has heavy computation loads while carrying out the programs implementing the proposed vision-based techniques, so we use a more powerful cloud server to implement it.
The system in the server computer gets images from the cameras on top of the vehicle. Then, it detects the line features in the images. Because the computational work is heavy, we divide the work into four parts to run them on the multi-CPU server. Next, we use the detected line features and the learned data to locate the vehicle position.
In more detail, the database of the learned information is saved in the cloud server that has lots of storage. Furthermore, the system uses the information of the location of the vehicle and the learned data to calculate the positions of the buildings in the generated perspective image, and augments the building names on it for the passenger to inspect. Finally we put the resulting image on the web site as well so that
all the users, not just the passengers inside the car, can get tour guidance by connecting to the web site.
2.3.2 Client-side System
The client-side system involves two components, namely, the laptop computer and the pad device. The laptop computer acquires the images by connecting to the omni-imaging device via the USB cable. Moreover, it transforms the omni-image into the passenger-image. Consequently, the client-side system of the laptop sends two images, which are the passenger-image and the omni-image, to the server after their resolutions are reduced to one sixteenth. Reduction of the omni-image resolution to be one sixteenth will not make the vehicle localization result wrong in most cases, but will advantageously decrease lots of data and increase the entire processing speed of the system. After all, we propose the methods that reduce the huge data into two parts; and in the meantime, the system can run continually with high vehicle localization precisions.
Finally, the pad device displays the processed images by connecting to the server and receiving processed images from it. As mentioned previously, the server system sends the processed images for AR-based guidance via the Internet, so the user can just visit the web site by using the pad device without running other applications.
2.3.3 Cooperation between Client and Server Sides
The details of the functions of the server and client side systems are described in Sections 2.3.1 and 2.3.2, respectively.Here we describe the cooperation between them in more detail. An illustration of the cooperation between the two systems is shown in Figure 2.6.
After the client-side of the laptop computer acquires an omni-image, the system transforms the omni-image into a passenger-image firstly. Then, it sends the two images, which are the passenger-image and a reduced version of the original omni-image, to the server.
After the server gets the data, it starts to analyze the data. First, the system detects the vertical line features in the reduced omni-image, and matches them with the learned feature data to localize the vehicle. Next, the system calculates the positions of the building and augment its name on the passenger-view image. Finally, the system sends the AR result to the client-side device via the web site. That is, the client-side uses the pad device to displays the AR result by visiting the web site so that any user in the vehicle can enjoy the guidance by using this system.
Server Web Site Client Pad Device Result Image Detection of Vertical
Line Omni-camera Image Laptop Computer
passenger-view Image Omni-Camera Vehicle Localization Augmenting Information on Passenger-view image Result Image
2.4 System Processes
2.4.1 Learning Process
The first part of our guidance system is the learning process. It plays an important role in our system. At the beginning, we need a real-world environment map. Therefore, we choose the open-source map on the Internet to construct the first part of the environment map. Next, we choose a path on the environment map and define it. Then, we save the result in into the database.
Next, we equip the omni-camera on the top of the vehicle and drive it on the path we choose. When travelling on the path, the learning system detects vertical lines “seen” in the images acquired with the omni-camera in the meantime. The operator can see the vertical lines detected by system on the laptop computer, and then he/she makes the vehicle stop and starts to “learn” the features. The learned information includes two types: are building and light pole. The system saves information, such as the type of each feature (building or light pole), the position of the feature in the map, the angle of the feature, etc., as the learning result into the database. The detail of the feature information will be discussed in Chapter 3. After traveling the path, the system analyzes the information automatically. In this process, the system works like simulating the traveling once again, and saves the analyzed data in the form of tables which may be looked up in the navigation process to speed up the guidance system. In more detail, the system can use the tables to match the detected features while running the navigation system rather than to analyze it again and again. A flowchart of the above learning process is shown in Fig. 2.7.
Start of Learning Map Sequential omni-images Detecting the Vertical Line
Computing the Position of the Features
Integrating the Information of Landmarks and Buildings
to LocaL Map
Getting the Distance of Features
Learning All Features in Path
Analysis Learning Data
Yes No
Ending of Learning Process Construct the Real
World Map
Choose the Path of Environment Map Drive the Vehicle on the Path
Figure 2.7 Flowchart of learning process.
2.4.2 Navigation Process
The second part of the proposed guidance system is the navigation process. In Section 2.4.1, we mentioned how we learn about environment through the learning process. Accordingly, we can estimate the position of the vehicle on the environment
map and implement our tour guidance system in the navigation process. First of all, we use the captured omni-image to detect the vertical line-shaped objects in the environment. This process will be introduced elaborately in Chapter 4. Then, by using the learning information and the detected features, the system can localize the current position of the vehicle in the environment map. The detailed process will be introduced in Chapter 5. Next, the system can calculate the position of the building and augment the building information on the passenger-view image. The detailed process will be introduced in Chapter 6. The entire navigation process is shown as a flowchart in Figure 2.8.
Start of Touring Guidance
Sequential omni-images
Display Result Image Detection of Feature Localization of Vehicle Analyzing of Current Map Computing Position of the Buildings Augment Information on the Image Learning Data Learning Data
Chapter 3
Learning of Environments
3.1 Ideas of Proposed Environment
Learning Techniques
In this chapter, we describe the details of the method we propose to generate the environment map for use in the proposed AR-based tour guidance system. In order to complete the system, we must construct the environment map for use in the navigation phase, which includes the information about the path of the tour, the line feature detected for vehicle localization, and the building information.
The first part of environment learning is the construction of a real-world map. We choose the “OpenStreetMap” to construct our environment map. The OpenStreetMap is an open data commons where peoples can modify the map free on the internet like Wikipedia. We use the real-world map acquired from there as the base of the environment map for this study, and define features of the environment for my system. In more detail, each feature we define will be marked with an icon on the map. The selected path is also marked on the map. In addition, the system can also show the vehicle position on the map during the tour so that the user can see the map clearly.
Next, we learn the line-shaped features for vehicle localization. In order to make our system more accurate, we have to get more information about the features. In addition, we not only learn the position of each feature on the map but also learn the information of the feature about how the camera on the vehicle can “see” It. The detail will be described in Section 3.3.
Furthermore, we learn the building information for the system to show in the AR image. The building information includes the building name, the building area in the map, the area where the camera can see, and so on.
Finally, we merge all the data of the environment as the environment map that the system can use for navigation in the tour. The detail of environment learning will be described in the following.
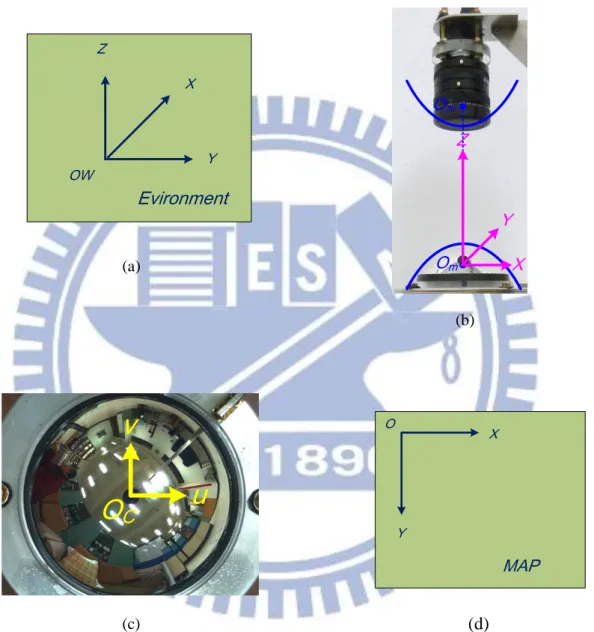
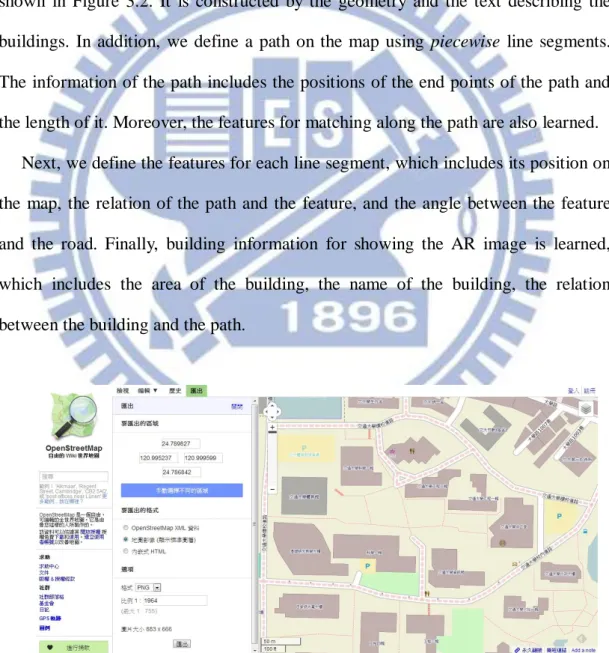
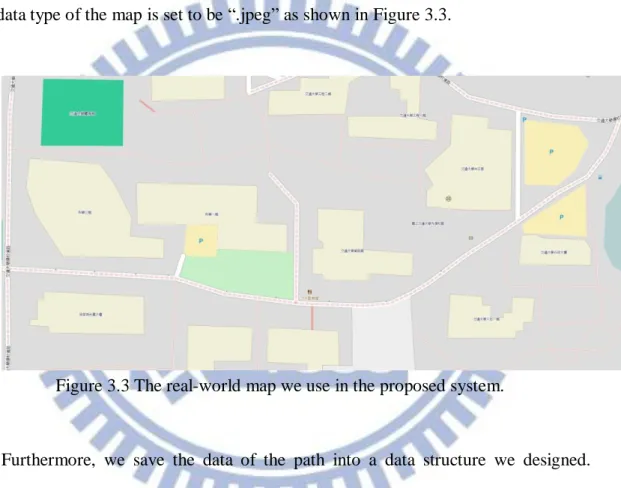
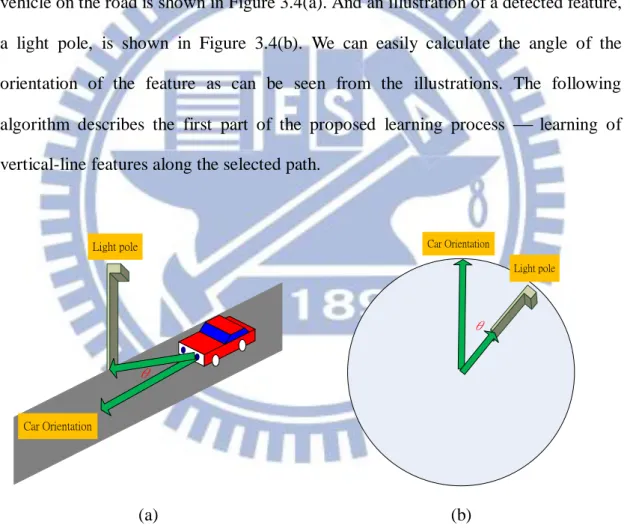
3.2 Coordinate Systems Used in This
Study
In this section, we will introduce the coordinate systems used in this study, which describe the relations between the used devices and the environment map. The following are the four coordinate systems used in this study.
(1) World coordinate system (WCS): denoted as (x, y, z) as shown in Figure 3.1(a). The origin OW of the WCS, a pre-defined point on the ground, is
regarded as the starting position of the path traversed by the vehicle during the learning and navigation processes.
(2) Camera coordinate system (CCS): denoted as (X, Y, Z) as shown in Figure 3.1(b). The origin Om of the CCS, a focal point of the hyperboloidal-shaped
mirror, lies on the X-Y plane which is coincident with the image plane. The
Z-axis coincides with the optical center of the lens of the upper CMOS
camera in the omni-imaging device.
(3) Image coordinate system (ICS): denoted as (u, v) as shown in Figure 3.1(c). The u-v plane of this system coincides with the image plane with the origin OC located at the center of the image plane.
3.1(d). The MCS is used to represent the environment map. The Mx-My plane coincides with the image plane of the floor. The origin is at the left-top position of the image plane.
Z Y X OW Evironment (a) X Y Z Om Om (b)
v
u
O
C (c) Y X O MAP (d)Figure 3.1 The three coordinate systems used in the proposed system. (a) The global coordinate system. (b) The camera coordinate system. (c) The image coordinate system.
3.3 Construction of Environment Map
In this section, we will introduce the method we propose to construct theenvironment map. The environment map is like a database, which contains the information that we use in the navigation process.
3.3.1 Information Included in Environment Map
The information put in the environment map includes the real-world map, the navigation path, the vertical lines in environment, the building information. The real-world map is constructed by the use of the “OpenStreetMap” in a website, as shown in Figure 3.2. It is constructed by the geometry and the text describing the buildings. In addition, we define a path on the map using piecewise line segments. The information of the path includes the positions of the end points of the path and the length of it. Moreover, the features for matching along the path are also learned.
Next, we define the features for each line segment, which includes its position on the map, the relation of the path and the feature, and the angle between the feature and the road. Finally, building information for showing the AR image is learned, which includes the area of the building, the name of the building, the relation between the building and the path.
3.3.2 Creation of Database for Environment Map
In order to create a database for use by the system in the navigation process, we have to save the data orderly. First, we construct a 2-dimension (2D) environment map by the “OpenStreetMap” and choose a part of the area on the map which is big enough to include the park environment. Next, we set an appropriate scale and a data type for the map. In this study, the scale of the map is 1 centimeter to 10 meters, and the data type of the map is set to be “.jpeg” as shown in Figure 3.3.
Figure 3.3 The real-world map we use in the proposed system.
Furthermore, we save the data of the path into a data structure we designed. Specifically, we divide the path into some line segments, each being represented by two points. Moreover, the length of any line segment is also calculated and saved in the database. The length distp of each line segment p with end points at coordinates (x1, y1) and (x2, y2) is calculated by the following equation:
2 2 1 2 2 1 ) ( ) (x x y y distp . (3.1)
In addition, the orientation p of the line segment p is also calculated and saved, which is calculated by the following equation:
) ( tan 2 1 2 1 1 y y x x p . (3.2)
where the orientation θp means the angle between the line segment and the horizontal direction in the map.
The subsequent major task is to save the information about the features which match with the path. In more detail, we save the number of features matched and the tag of each feature we defined.
Also, the system has to “learn” as well the vertical lines for vehicle localization. For this, it saves the position of each vertical line found in the environment as a point in the map. Also, while the vehicle is moving on the path, only on a part of the path can be “seen” by the cameras on the vehicle; therefore, for each detected vertical line, we save the orientations in which the first time and the last time the system in the vehicle can detect the vertical line. In other words, we learn the range of the views in degrees in which the vertical line can be seen.
Finally, the system learns the building for showing the AR image. For this, the information of the building we save into the system includes the geometry of the building drawn by lines, the building name, and the tag of the building we defined.
3.4 Learning of Environment Features
In this section, we introduce the proposed methods to learn the information about the environment. The learning process is a necessary step for the system to get ready to run.3.4.1 Learning of Navigation Paths
A path for car driving in the real world is not just a straight line, but in the study, we use piecewise line segments to describe a path. Furthermore, the system “sees”
each line segment as a unit which includes a lot of information about it. The detail of learning a navigation path is described in the following algorithm.
Algorithm 3.1 Learning of a navigation path. Input: A real world map.
Output: An environment map with line segments drawn on it as a selected path and
the information of the path in a type of data structure.
Steps:
Step 1. Choose a line segment which can be used to compose a desired path by defining the start point and the end point on the map for the line segment. Step 2. Calculate the length of the line segment by using Equation (3.1) and save it
into the data structure of the path.
Step 3. Calculate the angle of the line segment by using Equation (3.2) and save it into the data structure of the path.
Step 4. Add all the features that the vehicle driving on the line segment of the path can “see,” and save the number of the features also, into the data structure of the path.
Step 5. Repeat Steps 1 to 4 until all the line segments of the desired path are chosen.
Step 6. Draw all the line segments as a path on the map.
It noted that the action of adding the features in Step 4 will be described in more detail in Section 3.4.2. After learning the path, the system can use the path data together with other learned data to navigate in the environment.
3.4.2 Learning of Vertical Lines in Environments
The learning of vertical lines includes two parts. The first part is to learn a line feature at a time. The second is for the system to learn multiple line features simultaneously.
It is noted that learning the path should be conducted before learning the vertical line features. Furthermore, the most important step in our system is to calculate the angle of the feature orientation on the map. In more detail, an illustration showing the vehicle on the road is shown in Figure 3.4(a). And an illustration of a detected feature, a light pole, is shown in Figure 3.4(b). We can easily calculate the angle of the orientation of the feature as can be seen from the illustrations. The following algorithm describes the first part of the proposed learning process learning of vertical-line features along the selected path.
θ Light pole Car Orientation (a) θ Light pole Car Orientation (b)
Figure 3.4 The vehicle on a path while detecting a feature. (a) An illustration of the vehicle driving on the path. (b) An omni-image with a detected feature a light pole.
Algorithm 3.2 Learning of vertical line features.
with the omni-imaging device on the vehicle.
Output: An environment map with the along-path features drawn on it and the
information of the features in a type of data structure.
Steps:
Step 1. Drive the vehicle along each line segment li along the path and detect the
vertical lines in image I1 using the feature detection method described in
Chapter 4.
Step 2. While the vertical lines are being detected, stop the vehicle and do the following steps.
2.1 Measure the position of the feature on the map using the scale of the map and save it into the environment map by associating the feature with the corresponding line segment li of the path.
2.2 Compute the orientation by which the system detects the feature for the first time, call it the first-angle of the feature, and save it into the environment map.
2.3 Drive the vehicle forward until the feature can no longer be detected by the system.
2.4 Compute the orientation by which the system detects the feature for the last time, call it the last-angle of the feature, and save it into the environment map.
Step 3. Repeat Steps 1 and 2 until the vehicle arrives at the end point of the path. Step 4. Draw all the features on the map.
Next, learning multiple features simultaneously is different from learning one at a time. The learning of multiple features conducted in this study is a new method. For vehicle localization using multiple line features, we propose to use the longest
common subsequence (LCS) algorithm in this study, which is based on the dynamic programming technique. It enables the vehicle to drive on the path by using the data learned from Algorithm 3.2 and the path information.
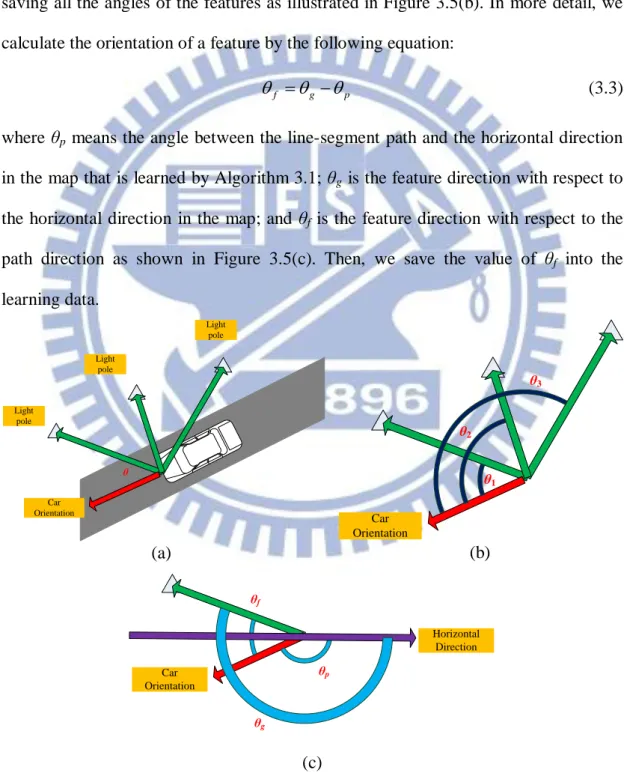
In some cases, the vehicle on the path may detect many features at a time like the case illustrated in Figure 3.5(a). And the system has to learn these multiple features by saving all the angles of the features as illustrated in Figure 3.5(b). In more detail, we calculate the orientation of a feature by the following equation:
p g
f
(3.3)
where θp means the angle between the line-segment path and the horizontal direction in the map that is learned by Algorithm 3.1; θg is the feature direction with respect to the horizontal direction in the map; and θf is the feature direction with respect to the path direction as shown in Figure 3.5(c). Then, we save the value of θf into the learning data. θ Light pole Car Orientation Light pole Light pole (a) θ1 Car Orientation θ2 θ3 (b) θg Car Orientation θf θp Horizontal Direction (c)
on the map. (b) Detected angle of features. (c) Illustration of calculating the angle of θf. We use the detected line features to localize the vehicle by matching the angles of the features using the LCS algorithm to. The details are described in Chapter 5. In the following, the algorithm for learning multiple line feature data to localize the vehicle is described.
Algorithm 3.3 Learning of multiple line features.
Input: A real-world map with the path and feature information. Output:A table T of the multiple line feature data.
Steps:
Step 1. Start with the first line segment l of the pre-selected path in the map. Step 2. Start with the first point/pixel of line segment l.
Step 3. Calculate the angle between l and each feature which matches l by do the following steps.
3.1 Choose the feature associated with l whose data are learned from Algorithm 3.2.
3.2 Calculate the feature angle by using Equations 3.2 and 3.3 which setting the point/pixel of the vehicle and the point/pixel of the feature as two end points.
3.3 Save the result into table T.
3.4 Repeat Steps 3.1 to 3.3 until all the features matching l are learned. Step 4. Move to the next point/pixel along the line segment.
Step 5. Repeat Steps 3 and 4 until the end point/pixel of the current segment is reached.
3.4.3 Learning of Building Information
Since the system must show the building information in the AR image, an algorithm for learning the building is necessary and is derived in the following. An illustration of the algorithm is shown in Figure 3.6(a). The learning of the building corner is shown in Figure 3.6(b). In more detail, we learn the edge line of the building by connecting two corners. And it noted that the edge line we learn is the side which the vehicle can “see”. In other worlds, there is no need to learn the side which can’t be seen when driving on the path. Then, the system can calculate the position of the building while driving on the path by the result of learning the edge line segments. The details of showing the AR image will be described in Chapter 6.
Car Orientation Building (a) Car Orientation Building Corner Building Corner Building Corner (b)
Figure 3.6 Learning of buildings. (a) An illustration of learning the building. (b)The result of learning the building in the map.
Algorithm 3.4 Learning of building information.
Input: A real-world map image with the path information. Output:A table of the data of learned buildings.
Step 1. Drive the vehicle on the path and detect the building(s) in the acquired image.
Step 2. If a building is detected, stop the vehicle and do the following steps.
2.1 Save the position of the building corner Pi on the map by measuring it and using the scale of the map to calculate the position of Pi on the map.
2.2 Repeat Step 2.1 until all building corners Pi are learned. 2.3 Define a line by connecting every two corners Pi. 2.4 Save the building name in the data structure.
Step 3. Repeat Steps 1 and 2 until the vehicle arrived at the end point of the path.
3.5 Experimental Results
The map of our experimental environment is shown in Figure 3.7. It is the final result of learning all features and the path. In more detail, we will present the results of applying the proposed algorithm in this chapter step by step. First, in the part of learning the navigation path, we defined a path in the environment as shown in Figure 3.8. After learning the path, we have a lot of information about it. Next, in the part of learning vertical line features, we define points of features in the environment as shown in Figure 3.9. Furthermore, the different colors of the features represent different kinds of them, such as light pole and edge line on building walls, etc. After the learning processes are completed, the system can use the resulting information to locate the vehicle. Finally, in the part of learning building information, we show the result in Figure 3.7. All the learned data are saved in the system in many data structures we defined. Before the system starts to run, the data will be loaded into the
system.
Figure 3.7 The environment map we use in the proposed system.
Figure 3.8 The environment map with the path.