Original Article
High prevalence of hyperuricemia in elderly Taiwanese
Meei-Shyuan Lee
DrPH,1Shih-Chieh Lin
MPH,1Hsing-Yi Chang
PhD,2Li-Ching Lyu
PhD,3Keh-Sung Tsai
MD4and Wen-Harn Pan
PhD51School of Public Health, National Defense Medical Center, Taipei, Taiwan, ROC 2Division of Health Policy Research, National Health Research Institutes, Taiwan, ROC
3Department of Human Development and Family Studies, National Taiwan Normal University, Taipei,
Taiwan, ROC
4Department of Laboratory Medicine, National Taiwan University Hospital, Taipei, Taiwan, ROC
5Institute of Biomedical Sciences, Academia Sinica, Institute of Microbiology and Biochemistry, National
Taiwan University, Taipei, Taiwan, ROC
Serum urate status, the prevalence of hyperuricemia and their relationship to the metabolic syndrome in elderly Taiwanese were described using data from the Elderly Nutrition and Health Survey in Taiwan (1999-2000), in which a stratified multi-stage clustered sampling scheme was applied. Complete data from biochemical assays and anthropometric measures for 1225 males and 1167 females were included in the analysis. The mean urate level and 95% confidence interval was 411 (398, 424) µM for males and 357 (347, 367) µM for females. Males had significantly higher serum urate levels than females across all age groups (P <0.05). No significant difference in mean serum urate was found among the four age groups of males. On the other hand, females of 75-79 years had significantly higher serum urate levels (376 µM) than that of the 65-69 and ≥ 80 age groups. The overall prevalence of hyperuricemia (≥ 416.7 µM (7.0 mg/dL) in the elderly was 36% (46% for males and 26% for females). Among the participants, 4.2% of males and 1.1% of females were taking medication to lower uric acid. The elderly (males 455 µM; females 416 µM) of the Mountain areas, mainly indigenes, had the highest mean serum urate overall, however, the highest prevalence of hyperuricemia in males was found in the PengHu islands (62%) and that for females in the Mountain areas (51%). The odds ratio (OR) for hyperuricemia was 2.84 for males in the PengHu islands and 4.33 for females in Mountain areas, compared with their counterparts in the third stratum in the northern areas. Adjusting for obesity, alcohol and other related covariates did not alter the relative rank of the ORs in the various strata. Elderly males (22%) had a significantly lower rate of metabolic syndrome (MS) than females (39%) (P <0.05). For both genders, those with MS had a significantly higher mean serum urate (males 436 µM vs. 405 µM; females 389 µM vs. 338 µM) and prevalence of hyperuricemia (males 56% vs. 43%; females 38% vs. 19%) (P <0.05). The population attributable risk for MS from hyperuricemia was 18.8% in men and 15.5% in women. In conclusion, the mean serum urate and prevalence of hyperuricemia in the elderly in Taiwan were higher than those found in other populations and was significantly associated with MS. Gene-environmental interaction may play a key role since great geo-graphical variation exists within various Han Chinese groups in Taiwan and between Han Chinese and Taiwanese indigenes.
Key Words: serum urate, hyperuricemia, metabolic syndrome (MS), elderly, indigenous, mountainous, Taiwan, Elderly Nutrition and Health Survey in Taiwan (1999-2000)
Introduction
The incidence of gout has been increasing in middle-aged and older people globally during the last two decades and
has been related to modernization.1-6 Hyperuricemia is
considered to be the most significant risk factor for gout,7,8
and may play a role in the development of many
degenera-tive diseases.9-17 The Kuopio Ischaemic Heart Disease Risk
Factor Study,16 the NHANES I Epidemiologic Follow-up
Study,18,19 and the SHEP study9 demonstrated that serum
urate was an independent predictor of cardiovascular events or mortality in middle-aged men and older persons. The ARIC study, however, did not reach the same
con-clusion.20 Therefore, the issue of hyperuricemia as a CVD
risk factor is still under debate. Metabolic syndrome (MS), a cluster of coronary heart disease risk factors, has been associated with total mortality, and cardiovascular
mor-bidity and mortality among Westerners21-23 and has been a
topic of much interest in Asia in recent years.24,25 In
Tai-wan, it has been observed that both the gender and age spe-cific serum urate levels and prevalence of hyperuricemia
are unusually high in both the general26-29 and indigenous
populations30,31, compared to other ethnic groups and world
regions.2,14,15,32,33 It is unclear whether hyperuricemia
in-creases with aging as does MS. Because previous studies
have mostly focused on the middle-aged population14,16,19,34
or have been limited to a single location,10,17,27,29,30,35
Correspondence address:. Dr. Meei-Shyuan Lee, School of
Public Health, National Defense Medical Center, 161 Minchuan East Road, Sec. 6, Taipei, Taiwan 114, ROC
Tel/Fax: 886-2-87910704; Email: [email protected] Accepted 30 June 2005
we decided to appraise this issue in a representative elder-ly population of an affluent society. We presented the status of serum urate and prevalence of hyperuricemia and their relationship to MS in the Taiwanese elderly based on comprehensive national survey data.
Subjects and methods
Study participants
Data for this paper were obtained from the Elderly Nutri-tion and Health Survey in Taiwan (1999-2000) (Elderly NAHSIT) that was performed between 1999 and 2000. The Elderly NAHSIT was a national survey aimed at studying the nutrition and health status of free-living people aged 65 and older in Taiwan. We divided 359 townships (or districts) in Taiwan into 13 strata according to the dietary patterns of the residents, urbanization index, and the geographic characteristics of the selected areas. These 13 strata included Hakka areas, Mountain areas, Eastern areas, PengHu islands, and 9 strata from the northern, central and southern areas (3 strata each defined by the degree of urbanization, decreasing from the first to the third stratum). A total of 39 townships (3 from each strata) and 78 villages (or Lis, the smallest administrative unit) (2 from each township) were selected using pro-bability proportional to population size (PPS) methodo-logy. We randomly selected 26 elderly people from each village stratified by gender and age. Therefore, theo-retically, there were 52 participants in every township, 156 participants in every stratum, and 2,028 participants nation-wide. However, in actuality a total of 1225 males and 1167 females underwent the physical examination and had available serum urate data or complete que-stionnaire data making them eligible for inclusion in the present analysis. More details about the study design and
sam-pling methodology are provided by Pan et al.36
Data collection
The survey incorporated face-to-face interviews. Data collected included gender; age; residential location; life-style related variables: smoking, alcohol consumption, and physical activity; medical history; and the use of medications. Detailed physical examination included anthropometric measurements and the collection of fasting blood samples. The blood specimens were centri-fuged immediately after collection. The serum specimens were aliquoted, frozen in a liquid nitrogen tank, and then delivered to the Academia Sinica where they were stored at -70°C. The frozen serum samples were analyzed in the clinical laboratory of the National Taiwan University Hospital within one month of collection (using the Hita-chi 747, Japan). The coefficient of variation was derived from duplication of 5% of the blood samples and was 7.2% for serum urate measurement.
Definition of variables
Because there is no universally accepted definition for hyperuricemia, for the purpose of comparison we used two criteria: (1) serum urate ≥ 416.7 µM (7.0 mg/dL) for
both genders8,26,27 and (2) serum urate ≥ 458.0µM (7.7
mg/dL) for males and ≥ 392.9µM (6.6 mg/dL) for
fe-males.26,27 Current use of urate lowering medication was
defined as those who reported having taken such medi-cation within one month prior to the interview. The defi-nition of metabolic syndrome was that defined by the National Cholesterol Education Program – Adult
Treat-ment Panel (NCEP-ATP III)37-39 with modified central
obesity criteria.24,25 Participants needed to fit 3 or more
of the following criteria: (1) waist circumference > 90 cm for men and >80 cm for women; (2) serum triglyceride ≥1.69 mM (150 mg/dL) or on lipid lowering medication; (3) HDL<1.03 mM (40 mg/dL) in men and <1.29 mM (50 mg/dL) in women; (4) SBP/DBP ≥130/85 mm-Hg or on anti-hypertension treatment; (5) fasting blood glucose ≥ 6.1 mM (110 mg/dL) or on treatment for diabetes melli-tus. Body mass index (BMI) was used as a measure of
general obesity and was calculated as weight (kg)/height2
(m2). The waist to hip ratio (WHR) was used as the
indi-cator of central obesity. Both BMI and WHR were sig-nificant risk factors for hyperuricemia in this population and were adjusted for in the multivariable analyses. Moreover, the impact of monthly variation in serum urate levels was found to be substantial in this population. Though appraising the causes for this variation was not the purpose of the present study, monthly effect was adjusted for in regression analysis.
Statistical analysis
All data were weighted to represent the population in Taiwan. The population size of each gender/age group in each stratum was obtained from the national household registry system. The sampling weights were calculated by dividing the population by its corresponding sampling weights to represent the people of his or her own gender/ age group in the stratum. All the analyses were carried
out using SAS version 8.0140 statistical software and
SUDDAN version 8.041 was used to account for the
sampling design. We used either the t-test or one-way ANOVA to compare mean serum urate levels between or within groups accordingly. The chi-square test was used to test the association between hyperuricemia and MS. Logistic regression analyses were used to examine the effect of location on hyperuricemia with and without adjusting for other related factors. Statistical significance was defined as P <0.05.
Results
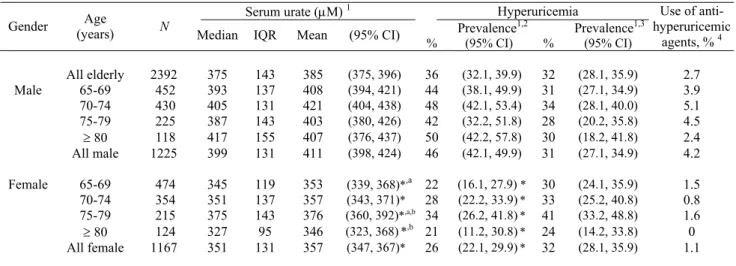
The overall, gender-specific and gender-age specific distributions of serum urate levels and prevalence of hyperuricemia for Taiwanese people 65 years and older are shown in Table 1. The mean serum urate concen-tration was calculated from all blood samples excluding 80 samples of individuals taking medication to lower serum urate (5.5% of males and 1.1% of females) and 68 blood samples with a hemolyzed index greater than 1 (3.3% of males and 2.4% of females). The average serum urate level and corresponding 95% confidence interval (95% CI) was 411 (398, 424) µM for males and 357 (347,
367) µM for females. In all age groups, males had
sig-nificantly higher serum urate levels than females. No apparent pattern of variation in uric acid levels was found among the four age groups in males. The highest uric acid value (421µM) occurred in the 70-74 year group, and
in the other three age groups the urate levels ranged from
403 µM to 408 µM. For females, however, the mean
value increased from 353 µM (65-69 years) to the peak of 376 µM (75-79 years) then decreased to 346 µM for the oldest group. The mean serum urate in 75-79 year old females was significantly higher than that in the youngest and the oldest age groups. Since the distribution of serum urate was skewed to the right, the corresponding median and interquartile ranges for various gender/age groups were also provided for reference.
When the criteria for hyperuricemia was set at ≥416.7 µM (7.0 mg/dL), the prevalence of hyperuricemia in elderly Taiwanese was 36% (males: 46%; females: 26%). The prevalence of hyperuricemia among the various age groups ranged from 42% (75-79 years) to 50% (80 years or older) in males, and ranged from 21% (80 years or older) to 34% (75-79 years) in females. Similarly, in re-gards to the serum urate level, males had significantly higher rates of hyperuricemia than females across all age groups. There was no difference in prevalence among different age groups in both genders. When the second criteria (serum urate ≥ 458.0 µM [7.7 mg/dL] for males and ≥ 392.9 µM [6.6 mg/dL] for females) were adopted, the prevalence of hyperuricemia in males decreased from 46% to 31%. In contrast, the prevalence of hyperuricemia in females increased form 26% to 32%. Using these cri-teria there was no gender differences in the prevalence of hyperuricemia. A total of 2.7% (4.2% of males and 1.1% of females) of participants reported having taken anti- hyperuricemic agents in the one month prior to the inter-view.
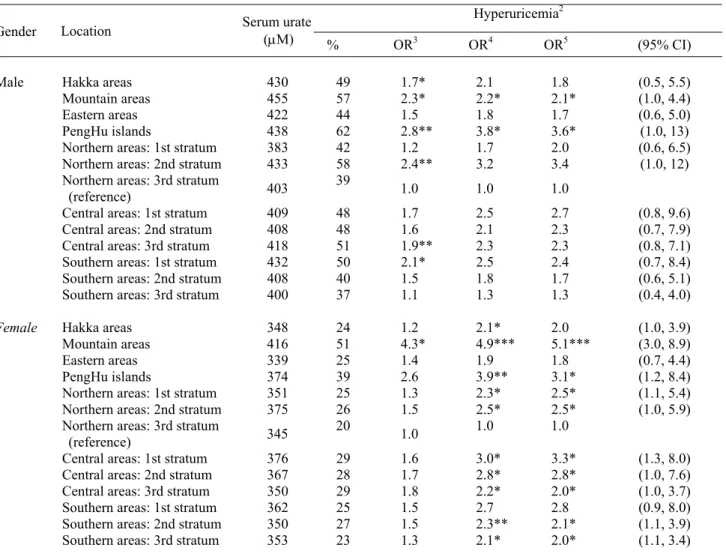
Table 2 presents the mean serum urate levels and the prevalence of hyperuricemia in elderly Taiwanese by gender and geographic location, using criteria of ≥416.7 µM (7.0 mg/dL). The mean serum urate level of parti-cipants from the Mountain areas was 455µM in males and
416 µM in females, which was 11% and 17% higher than the national average, respectively. In males, the preva-lence of hyperuricemia exceeded 50% in the four strata of the PengHu islands (62%), the second stratum in the northern areas (58%), the Mountain areas (57%) and the second stratum in the central areas (51%). The location-specific prevalence rates of hyperuricemia were much lower in females than males. The only location where the prevalence of hyperuricemia in women exceeded 50% (i.e 51%) was in the Mountain areas. The next highest pre-valence of hyperuricemia in women was in the PengHu islands with a prevalence of 39%. The prevalence of hyperuricemia in the elderly from the third stratum in the northern areas and the third stratum in the southern areas was relatively lower than the other strata.
Table 2 also presents the risk of hyperuricemia in rela-tion to stratum for elderly Taiwanese. The third stratum in the northern areas was designated as the reference stra-tum because of the relatively low prevalence of hyperuri-cemia for both genders. In males, there was a signi-ficantly higher risk of hyperuricemia in six strata com-pared to the reference stratum according to univariate analysis. The highest risk was in the PengHu islands (odds ratio (OR): 2.8). After adjusting for age, monthly variation, body mass index and waist to hip ratio in the multivariable model, the risk was even higher (OR: 3.6; 95% CI: 1.0-13) in males from the PengHu islands and remained significant when compared to the reference group. The second highest risk of hyperuricemia occurred in males from the Mountain areas and this was also a statistically significant effect when compared to the re-ference group. Elderly women from Mountain areas had a significantly highest risk of hyperuricemia (OR: 5.1; 95% CI: 3.0-8.9) than those from the reference stratum after controlling for related factors. Including alcohol in the model did not substantially change the magnitude of these effects in either gender (data not shown).
Table 1. Serum urate distribution and prevalence of hyperuricemia in elderly Taiwanese by gender and age groups.
(All values are weighted to reflect their representation in the population)
Serum urate (µM) 1 Hyperuricemia
Prevalence1,2 Prevalence1,3
Gender (years) Age N
Median IQR Mean (95% CI) % (95% CI) % (95% CI)
Use of anti- hyperuricemic agents, % 4 All elderly 2392 375 143 385 (375, 396) 36 (32.1, 39.9) 32 (28.1, 35.9) 2.7 65-69 452 393 137 408 (394, 421) 44 (38.1, 49.9) 31 (27.1, 34.9) 3.9 70-74 430 405 131 421 (404, 438) 48 (42.1, 53.4) 34 (28.1, 40.0) 5.1 75-79 225 387 143 403 (380, 426) 42 (32.2, 51.8) 28 (20.2, 35.8) 4.5 ≥ 80 118 417 155 407 (376, 437) 50 (42.2, 57.8) 30 (18.2, 41.8) 2.4 Male All male 1225 399 131 411 (398, 424) 46 (42.1, 49.9) 31 (27.1, 34.9) 4.2 65-69 474 345 119 353 (339, 368)*,a 22 (16.1, 27.9) * 30 (24.1, 35.9) 1.5 70-74 354 351 137 357 (343, 371)* 28 (22.2, 33.9)* 33 (25.2, 40.8) 0.8 75-79 215 375 143 376 (360, 392)*,a,b 34 (26.2, 41.8)* 41 (33.2, 48.8) 1.6 ≥ 80 124 327 95 346 (323, 368)*,b 21 (11.2, 30.8)* 24 (14.2, 33.8) 0 Female All female 1167 351 131 357 (347, 367)* 26 (22.1, 29.9)* 32 (28.1, 35.9) 1.1
1 Those who took antihyperuricemic agents were not included in the calculations. Eligible subjects were 1118 males and 1126 females.
2 Defined as serum urate ≥ 416.7 µM (7.0 mg/dL); 3 Defined as serum urate ≥ 458.0 µM (7.7 mg/dL) for males and ≥ 392.9 µM (6.6 mg/dL) for
females; 4 Percentage of subjects using antihyperuricemic agents within one month prior to interview; * Significantly different from males of the
same age group, P <0.05; Values with common superscript letters (a, b, c) are significantly different at P <0.05 between age groups in females. IOR: interquartile range; SE: standard error; CI: confidence interval.
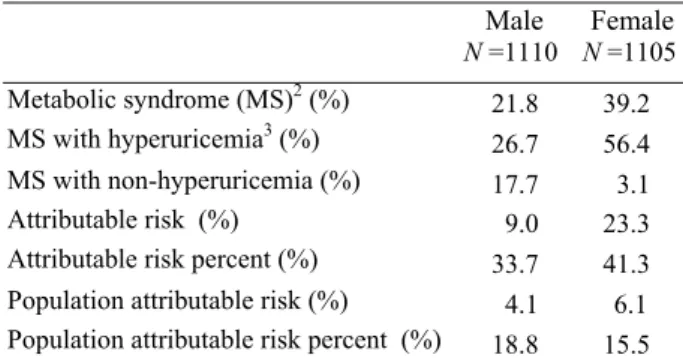
The prevalence of MS in the study population was 21.8% in males and 39.2% in females based on the mo-dified NCEP-ATP III definition. The mean serum urate levels for those with and without MS were 436µM and 405µM in males and 389µM and 338µM in females, re-spectively. The difference in serum urate between those with and without MS was significant in both genders. The prevalence of individual criteria for MS in order were: raised triglyceride (men 20.9%, women 31.4%), de-creased HDL (men 20.1%, women 38.1%), raised blood glucose (men 29.3%, women 32.8%), abdominal obesity (men 29.3%, 55.8%) and raised blood pressure (men 56.0%, women 61.1%) (data not shown). For all of these five measures, the prevalence of abnormal results were higher in females than in males. The biggest difference in these abnormalities was found in abdominal obesity, where the prevalence in females was nearly double that of males. Similarly, a significantly higher prevalence of hy-peruricemia was found in elderly men with MS compared to men without MS (56% vs. 43%). The difference in pre-valence of hyperuricemia between women with and with-out MS was also pronounced as the prevalence of hyper-uricemia in women with MS was double the rate in non-MS women (38% vs. 19%) (P<0.01) (Fig. 1). In addition,
we calculated the gender-specific attributable risk mea-sures of hyperuricemia in relation to MS. From our cal-culations of those elderly Taiwanese with MS, an esti-mated 18.8% of men and 15.5% of women would not have MS if hyperuricemia was eliminated (Table 3).
Discussion
This paper describes the distribution of serum urate and the prevalence of hyperuricemia in the Taiwanese popu-lation aged 65 years and older. The average serum urate level was 411 µM (6.9 mg/dL) for males and 357 µM (6.0 mg/dL) for females. Females were found to have lower
uric acid levels than males across all age groups.26,32,42
Epidemiologic studies have suggested that age-related increases in serum urate in women are due to
meno-pause.43 This hypothesis has been further confirmed by
the reduction of serum urate after using hormone
replace-ment therapy in postmenopausal women.44 Among the
Taiwanese elderly however, the difference in serum uric acid levels between genders decreased along with aging, 33% in the 19-44 year age group and 22% in the 45-64 year age group, compared to 9.3% (data from the Nutri-tion and Health Survey in Taiwan 1993-1996; NAHSIT
Table 2. Gender-specific risk of hyperuricemia in the Taiwanese elderly in relation to location effects1
Hyperuricemia2
Gender Location Serum urate (µM)
% OR3 OR4 OR5 (95% CI) Hakka areas 430 49 1.7* 2.1 1.8 (0.5, 5.5) Mountain areas 455 57 2.3* 2.2* 2.1* (1.0, 4.4) Eastern areas 422 44 1.5 1.8 1.7 (0.6, 5.0) PengHu islands 438 62 2.8** 3.8* 3.6* (1.0, 13) Male
Northern areas: 1st stratum 383 42 1.2 1.7 2.0 (0.6, 6.5)
Northern areas: 2nd stratum 433 58 2.4** 3.2 3.4 (1.0, 12)
Northern areas: 3rd stratum
(reference) 403
39 1.0 1.0 1.0
Central areas: 1st stratum 409 48 1.7 2.5 2.7 (0.8, 9.6)
Central areas: 2nd stratum 408 48 1.6 2.1 2.3 (0.7, 7.9)
Central areas: 3rd stratum 418 51 1.9** 2.3 2.3 (0.8, 7.1)
Southern areas: 1st stratum 432 50 2.1* 2.5 2.4 (0.7, 8.4)
Southern areas: 2nd stratum 408 40 1.5 1.8 1.7 (0.6, 5.1)
Southern areas: 3rd stratum 400 37 1.1 1.3 1.3 (0.4, 4.0)
Hakka areas 348 24 1.2 2.1* 2.0 (1.0, 3.9)
Mountain areas 416 51 4.3* 4.9*** 5.1*** (3.0, 8.9)
Eastern areas 339 25 1.4 1.9 1.8 (0.7, 4.4)
PengHu islands 374 39 2.6 3.9** 3.1* (1.2, 8.4)
Female
Northern areas: 1st stratum 351 25 1.3 2.3* 2.5* (1.1, 5.4)
Northern areas: 2nd stratum 375 26 1.5 2.5* 2.5* (1.0, 5.9)
Northern areas: 3rd stratum
(reference) 345 20 1.0 1.0 1.0
Central areas: 1st stratum 376 29 1.6 3.0* 3.3* (1.3, 8.0)
Central areas: 2nd stratum 367 28 1.7 2.8* 2.8* (1.0, 7.6)
Central areas: 3rd stratum 350 29 1.8 2.2* 2.0* (1.0, 3.7)
Southern areas: 1st stratum 362 25 1.5 2.7 2.8 (0.9, 8.0)
Southern areas: 2nd stratum 350 27 1.5 2.3** 2.1* (1.1, 3.9)
Southern areas: 3rd stratum 353 23 1.3 2.1* 2.0* (1.1, 3.4)
1 Eligible subjects were those who had blood samples and completed anthropometric measures but did not take uric acid medications (1213
males and 1170 females); 2Defined as serum urate ≥ 416.7 µM (7.0 mg/dL); 3Results of univariate logistic regression analysis; 4Adjusted for
age (65-69, 70-74, 75-79, ≥80, in year) and monthly variation; 5Adjusted for age (65-69, 70-74, 75-79, ≥80, in year), monthly variation, BMI
1993-1996)26 and 15% (present survey) in the elderly
po-pulation.
The criteria for hyperuricemia is based on the
solu-bility of sodium urate in body fluids.8 Because there has
been no international agreement on the definition of hy-peruricemia to date, we have used a variety of definitions for comparison purposes. In general, males had a higher rate of hyperuricemia than females no matter which defi-nition was adopted. For elderly Taiwanese, the preva-lence of hyperuricemia was 36% based on a definition of serum urate ≥416.7µM (7.0mg/dl). This means that more than one third of the elderly were hyperuricemic, which is
quite high compared to global figures.45 When the
cut-offs were dropped to ≥416.4 µM (7.0mg/dl) for males and ≥356.9µM (6.0 mg/dl) for females, which is a definition
commonly used in epidemiologic studies,14,15,31,33 almost
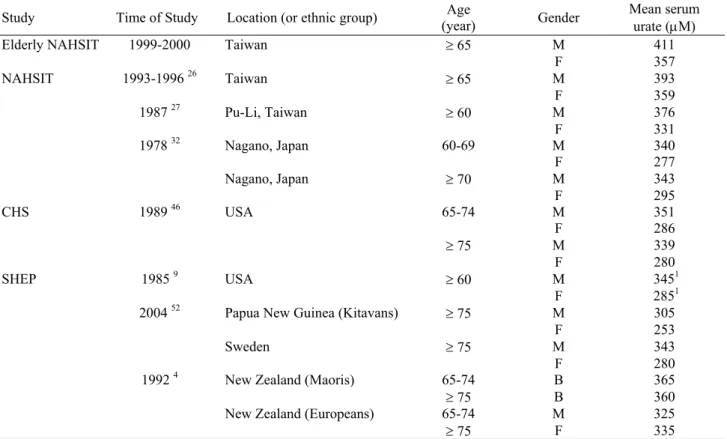
half of our participants were classified as hyperuricemic. The serum urate levels and prevalence of hyperuri-cemia found in the present survey were higher than those reported in the previous national nutrition survey, other local studies in Taiwan and studies in other countries (Table 4). For example, compared to the elderly in the
NAHSIT 1993-1996,26 the mean serum urate increased
4.6%, from 393µM to 411µM in males. In particular,
3 2 5 3 5 5 3 8 5 4 1 5 4 4 5 4 7 5 M S N o n -M S M ale S er um u rate ( uM ) M S N o n -M S Fem ale 1 0 2 5 4 0 5 5 7 0 M S N o n -M S M ale H ype ru ri ce m ia ( % ) M S N o n -M S Fem ale
A
B
Table 3. Gender-specific attributable risks measures of
hyperuricemia in relation to metabolic syndrome in the
Taiwanese elderly1 Male N =1110 Female N =1105 Metabolic syndrome (MS)2 (%) 21.8 39.2 MS with hyperuricemia3 (%) 26.7 56.4 MS with non-hyperuricemia (%) 17.7 3.1 Attributable risk (%) 9.0 23.3
Attributable risk percent (%) 33.7 41.3 Population attributable risk (%) 4.1 6.1 Population attributable risk percent (%) 18.8 15.5
1Those who had serum urate data and completed metabolic syndrome
measures but did not take antihyperuricemic agents were eligible for the analysis. All values were weighted to reflect their representation in the population. 2Defined by a modified ATP III clinical
definition. It requires the presence of 3 or more of the following: (1) waist circumference >90 cm for men and >80 cm for women; (2) serum triglyceride ≥1.69 mM (150 mg/dL) or on lipid lowering medication; (3) HDL <1.03 mM (40 mg/dL) in men and <1.29 mM (50 mg/dL) in women; (4) SBP/DBP ≥130/85 mmHg or on hypertension treatment; (5) fasting blood glucose ≥6.1 mM (110 mg/dL) or on treatment for diabetes mellitus. 3Defined as serum
urate ≥ 416.7 µM (7.0 mg/dL).
Figure 1. Gender and metabolic syndrome (MS) status specific (A) mean serum urate (µM) and (B) prevalence of hyperuricemia in the Taiwanese elderly. Hyperuricemia was defined as serum urate ≥416.7 µM (7.0 mg/dL). The corresponding 95% confidence intervals are also shown. All values are weighted to reflect their representation in the population. MS was defined by the presence of 3 or more of the following: (1) waist circumference >90 cm for men and > 80 cm for women; (2) serum triglyceride ≥1.69 mM (150 mg/dL) or on lipid lowering medication; (3) HDL <1.03 mM (40 mg/dL) in men and <1.29 mM (50 mg/dL) in women; (4) SBP/DBP ≥ 130/85 mmHg or on anti-hypertension treatment; (5) fasting blood glucose ≥6.1 mM (110 mg/dL) or on treatment for diabetes mellitus. The gender specific differences between MS groups were significant (P<0.01) by the t-test and chi-square test.
when 458.0 µM (7.7mg/dL) was used as the cut point, the prevalence of hyperuricemia in elderly men rose from 19% to 31%. Similarly, when 416.7µM (7.0 mg/dL) was used as the cut point the prevalence rose from 36.8% to 46%. Urate levels in other countries showed a median serum urate of 345 µM for men and 285 µM for women
aged 60 and older in the SHEP study 9 and a mean value
of 351 µM for men and 286 µM for women aged 65-74
among CHS participants.46 It is unclear whether this rise
is an inevitable change over time due to modernization. Some may argue that this is a self-selective effect, as people who are more unwell would be more willing to attend screening, and as a result would raise the values. However, this does not seem to be a major issue in this population for serum urate, as only a few people reported having a history of gout and only 2.7% of participants reported taking medicines to treat hyperuricemia. In addition, respondents and non-respondents did not differ
significantly in their education levels and occupation.36
As per other published data from Taiwan, the present study found an apparent geographic difference in serum urate status. Regardless of the criteria used, the pre-valence of hyperuricemia was highest in the elderly from the Mountain areas and the PengHu islands in both genders. The prevalence of gout in Taiwanese indigenes was as high as 16.2% for males and 4.8% for females
compared to only 0.3% among non-indigenes.31 This has
been attributed in the past to heavier drinking among aboriginal people. Serum urate level is not the most
reli-able or solitary criteria for the diagnosis of gout,7,8 the
prevalence of hyperuricemia is affected by a variety of factors according to the literature including alcohol con-sumption. However, in the current analysis we found
that the higher prevalence of hyperuricemia in the elderly of the Mountain areas who were predominantly of abo-riginal origin (77%), was not due to obesity or alcohol consumption, in contrast to what has been reported for
other age groups.26,30,47 In this population, 57% of males
and 94% of females were non-drinkers, and only 13.9% of males and 0.9% of females reported having ≥1 drink per week. The mean BMI in different areas ranged from 22.1 to 23.9 in men and 23.0 to 25.2 in women (data not shown). Cheng et al., has reported a significant linkage
for gout in chromosome 4q25 in Taiwanese indigenes48
suggesting that genetic factors may contribute to the pre-valence of hyperuricemia. Obesity and alcohol consump-tion also cannot explain the higher level of urate in the elderly of the PengHu islands where fish consumption is extremely high. Choi et al., found that higher intake of meat and seafood was related to higher serum urate in
NHANES III subjects.49 Further study is required to
eva-luate the effect of diet on uric acid metabolism.
Serum urate and hyperuricemia have been found to be associated with various CVD risk factors in different
population or age groups.9-15 MS, a cluster of CVD risk
factors, has been associated with total mortality, and car-diovascular morbidity and mortality in Western
coun-tries.21-23 To evaluate the relationship between serum
urate and these metabolic disorders collectively, we chose to use MS defined by ATP III as a surrogate measure. For elderly Taiwanese, both serum urate level and the prevalence of hyperuricemia were significantly higher in MS subjects than non-MS subjects. As hyperuricemia is not a commonly used criterion for MS, the significant association between hyperuricemia and MS indicate the possibility that both share common risk factor(s).
Table 4. Serum urate level in elderly people from different countries
Study Time of Study Location (or ethnic group) (year) Age Gender Mean serum urate (µM)
Elderly NAHSIT 1999-2000 Taiwan ≥ 65 M 411
F 357 NAHSIT 1993-1996 26 Taiwan ≥ 65 M 393 F 359 1987 27 Pu-Li, Taiwan ≥ 60 M 376 F 331 1978 32 Nagano, Japan 60-69 M 340 F 277 Nagano, Japan ≥ 70 M 343 F 295 CHS 1989 46 USA 65-74 M 351 F 286 ≥ 75 M 339 F 280 SHEP 1985 9 USA ≥ 60 M 3451 F 2851
2004 52 Papua New Guinea (Kitavans) ≥ 75 M 305
F 253
Sweden ≥ 75 M 343
F 280
1992 4 New Zealand (Maoris) 65-74 B 365
≥ 75 B 360
New Zealand (Europeans) 65-74 M 325
≥ 75 F 335
Theoretically, from the population attributable risk per-cent, if hyperuricemia could be eliminated from the popu-lation, around 20% of MS could be prevented. Although a significant association between serum urate and MS was found, we do not know the mechanism of this relationship and whether urate via MS affects the risk of CVD or vice versa. Due to its antioxidant properties, uric acid may protect the body from oxidative stress, which has been linked to cardiovascular disease. Hence, it has been
pro-posed that hyperuricemia is an early marker of CVD.16 It
is also worth noting that over half of Taiwanese elderly women were centrally obese. It is considered by ATP III that the rising prevalence of MS is mainly due to
obe-sity.50 Takahashi et al., has also reported that the size of
intra-abdominal visceral fat is positively correlated with serum urate and negatively correlated with uric acid
clear-ance.51 Therefore, it would be valuable to use our results
to evaluate the effect of change in serum urate on CVD risk via central obesity modification.
Consistent with the results of other age groups in
Tai-wan,26 we found a relatively high serum uric acid level
and prevalence of hyperuricemia in the elderly Han Chi-nese without the associated risk factors of alcohol con-sumption and obesity. In addition, the mean uric acid level and prevalence of hyperuricemia in people from the Mountain areas, mainly indigenes, were even higher, which may be due to a gene-environment interaction. Our data show that the metabolic disorders of MS were sig-nificantly associated with hyperuricemia in the Taiwanese elderly.
Acknowledgements
We express our thanks to Dr. Su-Chien Chang, Ms. I-Chen Huang, Wan-Yuan Chou, and Su-Chuan Wang for their valuable assistance in the preparation of this manuscript. We would like to thank all of the interviewers, local health department dieti-tians and all of those who assisted with the survey in local areas. We are particularly grateful for financial assistance from the Department of Health, Executive Yuan (Project name: Elderly Nutrition and Health Survey in Taiwan 1997-2002).
References
1. Arromdee E, Michet CJ, Crowson CS, O'Fallon WM, Gabriel SE. Epidemiology of gout: is the incidence rising?
J Rheumatol 2002; 29: 2403-2406.
2. Chen S, Du H, Wang Y, Xu L. The epidemiology study of hyperuricemia and gout in a community population of Huangpu District in Shanghai. Chin Med J (Engl) 1998; 111: 228-230.
3. Chen SY, Chen CL, Shen ML, Kamatani N. Trends in the manifestations of gout in Taiwan. Rheumatology (Oxford) 2003; 42: 1529-1533.
4. Klemp P, Stansfield SA, Castle B, Robertson MC. Gout is on the increase in New Zealand. Ann Rheum Dis 1997; 56: 22-26.
5. Zeng Q, Wang Q, Chen R, Xiao Z, Huang S, Xu J. Primary gout in Shantou: a clinical and epidemiological study. Chin Med J (Engl) 2003; 116: 66-69.
6. Wallace KL, Riedel AA, Joseph-Ridge N, Wortmann R. Increasing prevalence of gout and hyperuricemia over 10 years among older adults in a managed care population. J Rheumatol 2004; 31: 1582-1587.
7. Terkeltaub RA. Clinical practice. Gout. N Engl J Med 2003; 349: 16471655.
8. Mahowald ML. Overview of the evaluation and management of gout and hyperuricemia. Rheumatology & Musculoskeletal Medicine for Primary Care, Gout 2004/10/8 [cited 2005/5/12]; Available from: http://www.rheumatology.org/publications/primarycare/nu mber4/hrh0021498.asp
9. Franse LV, Pahor M, DiBari M, Shorr RI, Wan JY, Somes GW, et al. Serum uric acid, diuretic treatment and risk of cardiovascular events in the Systolic Hypertension in the Elderly Program (SHEP). J Hypertens 2000; 18:1149-1154. 10. Lai SW, Tan CK, Ng KC. Epidemiology of hyper-uricemia
in the elderly.Yale J Biol Med 2001;74:151-157.
11. Lin KC, Tsai ST, Lin HY, Chou P. Different progressions of hyperglycemia and diabetes among hyperuricemic men and women in the Kinmen study. J Rheumatol 2004; 31: 1159-1165.
12. Tseng CH. Independent association of uric acid levels with peripheral arterial disease in Taiwanese patients with Type 2 diabetes. Diabet Med 2004; 21: 724-729.
13. Langlois M, De Bacquer D, Duprez D, De Buyzere M, Delanghe J, Blaton V. Serum uric acid in hypertensive patients with and without peripheral arterial disease. Atherosclerosis 2003; 168: 163-168.
14. Li Y, Stamler J, Xiao Z, Folsom A, Tao S, Zhang H. Serum uric acid and its correlates in Chinese adult populations, urban and rural, of Beijing. The PRC-USA Collaborative Study in Cardiovascular and Cardio-pulmonary Epidemiology. Int J Epidemiol 1997; 26: 288-296.
15. Nagahama K, Iseki K, Inoue T, Touma T, Ikemiya Y, Takishita S. Hyperuricemia and cardiovascular risk factor clustering in a screened cohort in Okinawa, Japan. Hypertens Res Clin Exp 2004; 27: 227-233.
16. Niskanen LK, Laaksonen DE, Nyyssonen K, Alfthan G, Lakka HM, Lakka TA, et al. Uric acid level as a risk factor for cardiovascular and all-cause mortality in middle-aged men: a prospective cohort study. Arch Intern Med 2004; 164: 1546-1551.
17. Chu NF, Wang DJ, Liou SH, Shieh SM. Relationship between hyperuricemia and other cardiovascular disease risk factors among adult males in Taiwan. Eur J Epidemiol 2000; 16: 13-17.
18. Freedman DS, Williamson DF, Gunter EW, Byers T. Relation of serum uric acid to mortality and ischemic heart disease. The NHANES I Epidemiologic Follow-up Study. Am J Epidemiol 1995; 141: 637-644.
19. Fang J, Alderman MH. Serum uric acid and cardio-vascular mortality the NHANES I epidemiologic follow-up study, 1971-1992. National Health and Nutrition Examination Survey. JAMA 2000; 283: 2404-2410.
20. Moriarity JT, Folsom AR, Iribarren C, Nieto FJ, Rosamond WD. Serum uric acid and risk of coronary heart disease: Atherosclerosis Risk in Communities (ARIC) Study. Ann Epidemiol 2000; 10: 136-143.
21. Isomaa B, Almgren P, Tuomi T, Forsen B, Lahti K, Nissen M, et al. Cardiovascular morbidity and mortality associated with the metabolic syndrome. Diabetes Care 2001; 24: 683-689.
22. Lakka HM, Laaksonen DE, Lakka TA, Niskanen LK, Kumpusalo E, Tuomilehto J, et al. The metabolic syndrome and total and cardiovascular disease mortality in middle-aged men. JAMA 2002; 288: 2709-2716.
23. Trevisan M, Liu J, Bahsas FB, Menotti A, Group. LER. Syndrome X and mortality: a population-based study. Am J Epidemiol 1998; 148: 958-966.
24. Pan W-H. Metabolic syndrome - an important but complex disease entity for Asians. Acta Cardiol Sin 2002; 18: 24-26.
25. Tan CE, Ma S, Wai D, Chew SK, Tai ES. Can we apply the National Cholesterol Education Program Adult Treatment Panel definition of the metabolic syndrome to Asians? Diabetes Care 2004; 27: 1182-1186.
26. Chang HY, Pan WH, Yeh WT, Tsai KS. Hyperuricemia and gout in Taiwan: results from the Nutritional and Health Survey in Taiwan (1993-96). J Rheumatol 2001; 28: 1640-1646.
27. Chou P, Soong LN, Lin HY. Community-based epidemio-logical study on hyperuricemia in Pu-Li, Taiwan. J Formos Med Assoc 1993; 92: 597-602.
28. Lai SW, Tan CK, Ng KC. Epidemiology of hyperglycemia in elderly persons. J Gerontol A Biol Sci Med Sci 2000; 55: M257-M259.
29. Lai SW, Li TC, Li CI, Tan CK, Ng KC, Lai MM, Liu CS, Lin CC. Association between serum uric acid and cardiovascular risk factors among elderly people in Taiwan. Kaohsiung J Med Sci 1999; 15: 686-690.
30. Chou CT, Lai JS. The epidemiology of hyperuricaemia and gout in Taiwan aborigines. Br J Rheumatol 1998; 37: 258-262.
31. Chang SJ, Ko YC, Wang TN, Chang FT, Cinkotai FF, Chen CJ. High prevalence of gout and related risk factors in Taiwan's Aborigines. J Rheumatol 1997; 24: 1364-1369. 32. Akizuki S. Serum uric acid levels among thirty-four
thousand people in Japan. Ann Rheum Dis 1982; 41: 272-274.
33. Darmawan J, Valkenburg HA, Muirden KD, Wigley RD. The epidemiology of gout and hyperuricemia in a rural population of Java. J Rheumatol 1992; 19: 1595-1599. 34. Lai SW, Li TC, Ng KC. Hyperuricaemia and its related
factors in Taiwanese middle-aged adults. Int J Nurs Pract 2002; 8: 56-60.
35. Lin KC, Lin HY, Chou P. Community based epidemiological study on hyperuricemia and gout in Kin-Hu, Kinmen. J Rheumatol 2000; 27: 1045-1050.
36. Pan WH,Hung YT, Shaw NS, Lin W, Lee SD, Chiu CF, Lin MC, Chen SY, Hong CM, Huang TY, Chang HY, Tu SH, Chang YH, Yeh WT, Su SC. Elderly Nutrition and Health Survey in Taiwan (1999–2000): research design, methodology and content. Asia Pac J Clin Nutr 2005; 14 (3): 203-210.
37. Executive Summary of The Third Report of The National Cholesterol Education Program (NCEP) Expert Panel on Detection, Evaluation, And Treatment of High Blood Cholesterol In Adults (Adult Treatment Panel III). JAMA 2001; 285: 2486-2497.
38. Ford ES, Giles WH, Dietz WH. Prevalence of the metabolic syndrome among US adults: findings from the third National Health and Nutrition Examination Survey. JAMA 2002; 287: 356-359.
39. Park YW, Zhu S, Palaniappan L, Heshka S, Carnethon MR, Heymsfield SB. The metabolic syndrome: pre-valence and associated risk factor findings in the US population from the Third National Health and Nutrition Examination Survey, 1988-1994. Arch Intern Med 2003; 163: 427-436. 40. SAS Institute Inc. SAS/STAT User's Guide. In. 8 ed. Cary,
NC: SAS Institute; 1999.
41. Shah BV, Barnwell BG, S. BG. SUDDAN. User's Manual. In. 8 ed. Research Triangle Park, NC: Research Triangle Institute; 2001.
42. Chou P, Chen HH, Hsiao KJ. Community-based epide-miological study on diabetes in Pu-Li, Taiwan. Diabetes Care 1992; 15: 81-89.
43. Wingrove CS, Walton C, Stevenson JC. The effect of meno-pause on serum uric acid levels in non-obese healthy women. Metabolism 1998; 47: 435-438.
44. Sumino H, Ichikawa S, Kanda T, Nakamura T, Sakamaki T. Reduction of serum uric acid by hormone replacement therapy in postmenopausal women with hyperuricaemia. Lancet 1999; 354: 650.
45. Vazquez-Mellado J, Alvarez Hernandez E, Burgos-Vargas R. Primary prevention in rheumatology: the importance of hyperuricemia. Best Pract Res Clin Rheumatol 2004; 18: 111-124.
46. Robbins J, Wahl P, Savage P, Enright P, Powe N, Lyles M. Hematological and biochemical laboratory values in older Cardiovascular Health Study participants. J Am Geriatr Soc 1995; 43: 855-859.
47. Chang FT, Chang SJ, Wu YY, Wang TN, Ko YC. Body mass index and hyperuricemia differences between aboriginal and nonaboriginal children in Taiwan. Kaohsiung J Med Sci 1995; 11: 315-321.
48. Cheng LS, Chiang SL, Tu HP, Chang SJ, Wang TN, Ko AM, Chakraborty R, Ko YC. Genomewide scan for gout in taiwanese aborigines reveals linkage to chromosome 4q25. Am J Hum Genet 2004; 75: 498-503.
49. Choi HK, Liu S, Curhan G. Intake of purine-rich foods, protein, and dairy products and relationship to serum levels of uric acid: the Third National Health and Nutrition Examination Survey. Arthritis & Rheumatism 2005; 52: 283-289.
50. Grundy SM, Brewer HB, Jr., Cleeman JI, Smith SC, Jr., Lenfant C. Definition of metabolic syndrome: Report of the National Heart, Lung, and Blood Institute/American Heart Association conference on scientific issues related to definition. Circulation 2004; 109: 433-438.
51. Takahashi S, Yamamoto T, Tsutsumi Z, Moriwaki Y, Yamakita J, Higashino K. Close correlation between visceral fat accumulation and uric acid metabolism in healthy men. Metabolism 1997; 46: 1162-1165.
52. Lindeberg S, Cordain L, Rastam L, Ahren B. Serum uric acid in traditional Pacific Islanders and in Swedes. J Intern Med 2004; 255: 373-378.