國立臺灣大學醫學院微生物學研究所 碩士論文
Graduate Institute of Microbiology College of Medicine
National Taiwan University Master Thesis
利用慢性感染之小鼠模式
研究 B 型肝炎病毒專一性免疫功能缺失之機制 Studies of the mechanisms underlying the immune dysfunction against HBV in a mouse model of chronic HBV infection
陳致曄 Chih-Yeh Chen
指導教授:陶秘華 博士 Advisor: Mi-Hua Tao, Ph.D.
中華民國一百零二年七月 July, 2013
中文摘要
全世界超過三億五千萬的慢性 B 型肝炎病毒感染患者至今仍處於產生肝硬化
以及肝細胞癌的高風險之下。清除B 型肝炎病毒需要有效的 B 型肝炎專一性胞殺
型T 細胞的作用,而專一性胞殺型 T 細胞在急性 B 型肝炎病毒感染的病人中具備
有效抗病毒功能,但是在慢性B 型肝炎病毒感染病人中,這些專一性胞殺型 T 細
胞的數目較少,抗病毒功能也較差。臨床報告中,患者體內的B 型肝炎病毒劑量
被指出與專一性胞殺型T 細胞的數量及功能存在負相關趨勢。而免疫反應缺失與
病毒劑量的因果關係尚未完全釐清,主要原因在於臨床研究中無法操控病毒感染
的劑量,而B 型肝炎的自然宿主只有人類、黑猩猩以及樹鼩,缺乏合適的小動物
模式用以研究免疫反應缺失的機制。本實驗室近期發展的慢性B 型肝炎小鼠模式,
透過搭載B 型肝炎病毒基因體的腺相關病毒載體(AAV/HBV),使 B 型肝炎病毒
能夠長期在小鼠肝細胞中複製並製造病毒抗原。利用此小鼠模式,我們證明B 型
肝炎病毒專一性免疫反應有功能缺失的現象,而較高的病毒劑量確實造成較嚴重
的功能性缺失,同時造成胞殺型T 細胞表現較高量的 Programmed death-1(PD-1)
等抑制型受器(inhibitory receptors)。PD-1 配體(ligand)基因剔除小鼠(PD-L1 KO)
於感染AAV/HBV 之後,專一性胞殺型 T 細胞的功能較野生型小鼠的反應為強,
而感染後第二週基因剔除小鼠血清中的B 型肝炎病毒表面抗原量相較於野生型小
鼠顯著下降,顯示PD-1 訊息傳導對於 B 型肝炎專一性胞殺型 T 細胞免疫功能缺失
的重要性。然而當基因剔除小鼠感染高劑量的AAV/HBV 時,血清中抗原量在第
八週回升至與野生型小鼠相同的程度,顯示PD-1 訊息傳導在高劑量 B 型肝炎病毒
感染時僅扮演部分角色。由於此模式中,表現PD-1 的胞殺型 T 細胞無法以專一性
五聚體(pentamer)偵測出等量的細胞數,因此以功能性分析與替代性實驗方法證
明表現PD-1 的胞殺型 T 細胞具有 B 型肝炎病毒專一性。本篇研究證明高劑量 B
型肝炎病毒造成較嚴重的專一性胞殺型T細胞免疫功能缺失,而PD-1 訊息傳導在
高劑量B 型肝炎病毒感染的情況中僅佔有部分貢獻。因此本篇研究提供未來慢性
B 型肝炎免疫治療的參考依據,利用阻斷 PD-1 作為慢性 B 型肝炎免疫治療時,患 者體內病毒劑量可能對於治療結果產生影響,需將其列入評估。
關鍵字:B 型肝炎病毒、慢性病毒感染、病毒劑量、免疫功能缺失、PD-1
Abstract
The viral burdens in chronic hepatitis B patients are correlated with the levels of functional impairment of specific CD8 T cells, which express programmed death 1 (PD-1), and blocking inhibitory signals PD-1 ex vivo augments immunity against hepatitis B virus (HBV). However, due to the limitation of heterogeneity of patients, viral subtypes, and exposure time to viruses, it remains elusive whether the different degrees of T-cell dysfunction are directly induced by the divergence of HBV titers. In addition, the therapeutic effect by blocking PD-1:PD-L1 interaction is yet to be determined under high viral loads. Taking advantage of a mouse model of HBV chronic infection that allows the control of the quantities of monoclonal virus following adeno-associated viral vector delivery of HBV genomic DNA, we demonstrated that the functions of HBV-specific CD8 T cells diminished gradually post infection and T cell dysfunction progressed accompanied with increased viral loads. Consistently, intrahepatic CD8 T cells expressed increasing levels of PD-1 and other inhibitory receptors in a viral load-dependent manner. In PD-L1 KO mice, the functions of specific CD8 T cells were more robust in the early phase of infection, leading to reduced levels of viral antigen. However, activity of anti-HBV T cells sustained only in KO mice with low but not high viral loads, implicating the roles of other immune regulatory factors other than the PD-1:PD-L1 pathway. In addition, the HBV-specificity of PD-1+ CD8 T cells were demonstrated by functional assays and alternative approaches. Collectively, our data indicate that the viral load-induced dysfunction of HBV-specific CD8 T cells is partially regulated by PD-1 pathway, and impeding this pathway alone may not be sufficient to control the persistent infection, particularly in high HBV levels.
Keywords: HBV, chronic viral infection, viral loads, immune dysfunction, PD-1
Contents
1. Introduction ... 1
1.1 Chronic viral infection ... 1
1.1.1 T cell exhaustion ... 2
1.1.2 Inhibitory receptors ... 3
1.1.3 Effects of viral burdens on T cell exhaustion ... 4
1.2 Hepatitis B virus (HBV) ... 4
1.2.1 Genomic structure and genotypes ... 4
1.2.2 Viral proteins ... 5
1.2.3 Replication and life cycle ... 6
1.2.4 HBV infection ... 7
1.2.5 Immune responses in HBV infection ... 7
1.2.6 Animal models ... 8
1.3 Aim of this study ... 10
2. Materials and Methods ... 11
2.1 Animals ... 11
2.2 Adeno-associated viral (AAV) vectors ... 11
2.3 AAV injection ... 12
2.4 Immunization ... 12
2.5 Isolation of splenocytes and intrahepatic lymphocytes ... 12
2.6 IFN-γ and TNF-α ELISPOT ... 13
2.7 Serological analysis ... 13
2.8 Flow cytometric analysis and fluorescence-activating cell sorting (FACS) ... 14
2.9 In vivo blockade with mAb injection ... 15 2.10 Preparation of bone marrow-derived dendritic cells (BMDCs) and in vitro
adenovirus infection ... 15
2.11 In vitro T-cell expansion ... 16
2.12 T cell receptor (TCR) repertoire spectratype analysis ... 16
2.13 Statistics ... 17
3. Results ... 18
3.1 Negative Effects of Viral Loads on The Function of HBV-Specific CD8 T Cells ... 18
3.2 Intrahepatic T cells from mice with high viral loads expressed higher levels of inhibitory receptors, especially PD-1 ... 19
3.3 The reduction of viral antigens and ameliorated immune responses in the absence of PD-1:PD-L1 interaction ... 21
3.4 Loss of viral control and HBV-specific responses of CD8 T cells in high viral load mice even in the absence of PD-1:PD-L1 interaction ... 21
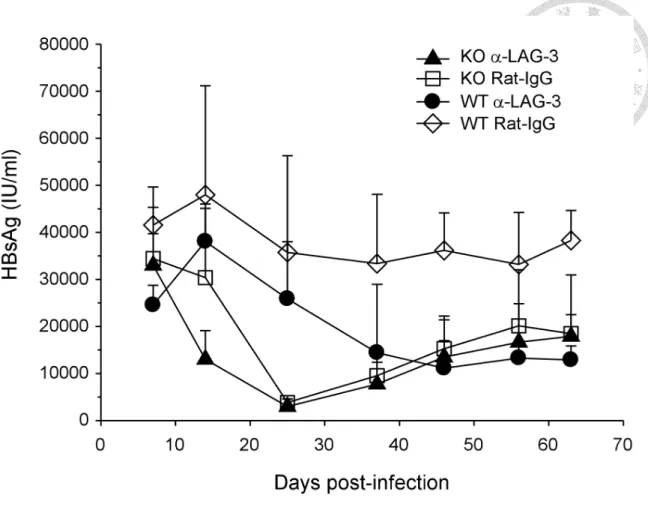
3.5 Blockade of LAG-3 accelerated the reduction of serum HBsAg in PD-L1 KO mice ... 23
3.6 Identification of H-2Kb-restricted epitopes of HBsAg and HBcAg ... 23
3.7 Detection of subdominant clones of HBV-specific CD8 T cells which recognize other HBV epitopes during chronic infection ... 24
3.8 Alternative approaches to demonstrate the HBV-specificity of PD-1+ CD8 T cells ... 27
4. Discussion ... 29
4.1 Model advantage ... 29
4.2 Tolerance ... 30
4.3 Dose effect ... 31
4.4 PD-1 expression and other regulatory factors ... 32
4.5 Blocking PD-1 ... 33
4.6 HBV-specificity of PD-1+ CD8 T cells ... 35
4.7 Conclusion ... 36
5. References ... 38
6. Figures ... 53
7. Tables ... 77
Figures
Figure 1. Long-term expression of HBsAg in low, intermediate, and high viral loads . 53 Figure 2. Functional impairment of HBV-specific CD8 T cells depended on viral loads
... 54 Figure 3. PD-1 expression on intrahepatic CD8 T cells was upregulated in a viral
load-dependent manner ... 56 Figure 4. Expression of 2B4 and LAG-3 on intrahepatic CD8 T cells increased with
greater extents during infection of higher viral loads ... 58 Figure 5. The levels of PD-1 upregulation on intrahepatic CD4 T cells depended on
viral loads ... 59 Figure 6. HBV-specific immunity in early stage of infection was more potent in the
absence of PD-1:PD-L1 ... 60 Figure 7. Reduction of HBsAg in PD-L1 KO mice infected with low, intermediate, and
high viral loads of AAV/HBV ... 61 Figure 8. Higher viral loads elicited more intense functions of HBV-specific CD8 T
cells in the early phase of infection in PD-L1 KO mice ... 62 Figure 9. Accelerated functional loss of HBV-specific CD8 T cells in PD-L1 KO mice
infected with high viral load of AAV/HBV ... 63 Figure 10. Blockade of LAG-3 accelerated the reduction of serum HBsAg in PD-L1 KO mice ... 65 Figure 11. Identification of H-2Kb-restricted dominant epitopes of HBsAg and HBcAg
... 66 Figure 12. Detection of subdominant clones of HBV-specific CD8 T cells in chronically infected C57BL/6 mice ... 68 Figure 13. PD-1+ CD8 T cells from AAV/HBV-infected mice were irresponsive to
stimulation using bone marrow-derived dendritic cells (BMDCs) infected with adenoviral vectors expressing HBV antigens ... 69 Figure 14. PD-1+ intrahepatic CD8 T cells showed more intense function of TNF-α
production against HBV peptides than the PD-1- counterpart CD8 T cells after in vitro expansion ... 71 Figure 15. The frequencies of CD11ahi CD8 T cells depended on viral loads of
AAV/HBV ... 73 Figure 16. Higher degree of oligoclonal T-cell expansion was observed in PD-1+
intrahepatic CD8 T cells than that of the PD-1- counterpart CD8 T cells ... 75
Tables
Table 1. Overlapping peptide library of HBsAg and HBcAg………77 Table 2. Primers for TCRβ spectratype analysis………80
1. Introduction
1.1 Chronic viral infection
In contrast to acute viral infection in which robust immunities against viral pathogens are rapidly elicited and control the viral replication and spread, chronic viral infection is considered a process of equilibrium between virus and host (1). Two fundamental events are required for the establishment of chronic viral infection. First, the invading viruses have to escape from antiviral immunities that eliminate the pathogens. Second, the strength of immune responses must be adjusted to tolerate the presence of foreign antigens without the induction of excessive inflammation, which can cause severe damage to infected tissues. The functionally impaired immunities are generally
observed in patients of chronic viral infection, such as human immunodeficiency virus (HIV), hepatitis B virus (HBV) and hepatitis C virus (HCV), in comparison to the antiviral immune responses in patients with acute infection.
During self-limited acute infection, the innate immune responses, including natural killer (NK) cell activity and interferon (IFN) production, are generated at early stage of infection and act as the first line of defense that limits the spread of virus. Thereafter, adaptive immunities, such as B cells, helper T cells (CD4 T cells), and cytotoxic T lymphocytes (CTL, CD8 T cells), are induced and activated through antigen-presenting cells (APCs). The effective adaptive immune responses contribute to the viral clearance by eliminating infected cells and neutralizing free-form viruses. The immunological situation in chronic viral infection is altered that the hosts fail to generate potent immunity against the invading pathogens. The failure of viral clearance is generally attributed to ineffective adaptive immunity, which could result from an active inhibition of immune activation by the virus or a lack of pathogen-associated molecular patterns
(PAMPs) that are required for the induction of immune activation (2).
1.1.1 T cell exhaustion
Researches in chronic viral infection mostly focus on the dysfunction of T cells, which are the main effector in terms of both cellular and humoral immunities against viral infection. T cell dysfunction is generally classified into T cell anergy and T cell exhaustion. Both of types are characterized with the loss of proliferative and cytolytic activity, the incapability of cytokine production, as well as the susceptibility to apoptosis (1, 3). Nevertheless, anergy arises at the time of first encounter of cognate antigens with the stimulation of MHC-peptide complexes (signal 1) in the absence of costimulatory molecules (signal 2), such as B7.1 and B7.2 (3). In contrast, T cell
exhaustion is not decided at the first time of antigen exposure but a progressive progress in the context of persistent existence of cognate antigens, which is a common phenotype of chronic viral infection. Exhausted T cells that are virus-specific in chronic carriers of HIV, HBV, and HCV are found to react poorly or even unresponsive to antigen
stimulation.
Several regulatory mechanisms that cause T cell exhaustion are found in chronic viral infection: immature APCs that constantly present antigens in the absence of
costimulatory signals, inhibitory cytokines such as IL-10 and TGF-β, regulatory cell subsets like regulatory T cells (Tregs), and inhibitory receptors expressed on T cells that generate regulatory signals and counteract T cell activation. Blocking these inhibitory mechanisms could prevent T cell exhaustion and restore the functions of T cells against virus. They are potential targets of immunotherapies for chronic infection in the future (2).
1.1.2 Inhibitory receptors
Recent studies show that in chronic viral infection, inhibitory receptors play critical roles in regulating the immune tolerance, especially in T cell exhaustion (4).
Programmed death-1 (PD-1, CD279) is the first inhibitory molecule found essential to T cell exhaustion, as blocking PD-1 signaling restores antiviral functions of virus-specific T cells and help the clearance of persistent virus in chronic lymphocytic
choriomeningitis virus (LCMV) infection (5) and in clinical studies of HIV (6). Upon activation, T cells upregulate the expression of PD-1 and thus prevent excessive activation (7). In self-limited infection, the expression of PD-1 is downregulated days after activation. In contrast, the expression is prolonged on T cells in chronic infection, which could be a consequence of constant exposure to antigens (1). When engaging with its ligands, PD-L1 (also as known as B7-H1) and PD-L2 (B7-DC), PD-1 is
phosphorylated on its two intracellular, and then binds phosphatases, SHP-1 and SHP-2, that downregulate antigen receptor signaling by dephosphorylation of signaling
intermediates (7). PD-L1 has a wider range of expression in parenchymal tissues and hematopoietic cells than that of PD-L2. Blocking PD-1 signaling in vivo has not only been shown to have therapeutic effect on animal models of chronic viral infection such as simian immunodeficiency virus (SIV) (8), but also lead to surprising responsive rate in cancer patients of several different types of tumors (9-12).
Other inhibitory receptors, including Lymphocyte activation gene-3 (LAG-3, CD223), Natural killer cell receptor 2B4 (CD244), T cell immunoglobulin (Tim-3) have been identified in LCMV studies and other human chronic viral infection (4, 13-16). They interact with their ligands (LAG-3:MHC II; 2B4:CD48; Tim-3:Galectin-9) and
transduce repressive signals that inhibit T cell activation. Individual blockades of these receptors using mAb show positive effects on the rescue of exhausted T cells and the
augmentation of antiviral immunities (4). A synergistic effect of combinatorial blockade of PD-1 and LAG-3 accelerate clearance of chronic pathogens, such as LCMV and plasmodium sp. in animal models (17, 18).
1.1.3 Effects of viral burdens on T cell exhaustion
Studies in LCMV clearly demonstrate that higher viral loads have negative effects on antiviral immune responses. Sustained exposure to high amount of cognate antigens results in the functional impairment of virus-specific CD8 T cells which thus fail to eliminate viral infection (19). In addition, mice with low viral load respond better to therapeutic vaccination (20). High antigen load also can lead to quick loss of memory CD8 T cells (21). In other human disease of chronic viral infection, the negative
correlation of viral loads and the antiviral functions of T cells are mostly determined by in vitro assays using peripheral blood mononuclear cells (PBMCs) (22, 23), whereas in vivo studies are rarely done.
1.2 Hepatitis B virus (HBV)
1.2.1 Genomic structure and genotypes
Hepatitis B virus (HBV) is an enveloped DNA virus with a diameter of 42 nm (Dane particle) and classified taxonomically in hepadnaviridae. The viral genome of HBV is a relaxed circular partially double-stranded DNA with a length of 3.2 kb (24). Negative strand of HBV genomic DNA is in full length and covalently linked with viral
polymerase on 5’-end, while positive strand is shorter with a capped oligoribonucleotide on 5’-end. After viral entry, the genomic structure is converted into
covalently-closed-circular DNA (cccDNA) in the nucleus of hepatocytes. The viral genome contains 4 open reading frames (ORF) which are highly overlapped: C-ORF,
coding for capsid core protein (HBcAg) and HBV e antigen (HBeAg); P-ORF, coding for HBV polymerase protein; S-ORF, coding for 3 HBV envelope proteins: large surface Ag (pre-S1 or LHBsAg), middle surface Ag (pre-S2 or MHBsAg), and small surface Ag (S, HBsAg, or SHBsAg).
The 4 major RNA transcripts are denominated by their lengths (25). 3.5 kb mRNA includes pregenomic RNA and precore mRNA. The former is responsible for the synthesis of HBcAg and polymerase protein, and serves as the template of for synthesis of DNA negative strand. 2.4 kb mRNA encodes pre-S1 envelope protein and 2.1 kb mRNA is the template for synthesis of pre-S2 envelope protein and HBsAg. 0.7 kb mRNA encodes HBx protein. All the transcripts share the same sequences at 3’-end. At least 8 genotypes, denominated from A to H, have been identified and classified
according to an intergroup divergence of more than 8% in the complete nucleotide sequence (26).
1.2.2 Viral proteins
HBcAg is a structural protein with molecular weight of 21 kDa. Dimers of HBcAg comprise the viral nucleocapsids, which encapsidate pregenomic RNA and viral polymerase protein.
HBeAg (precore protein) shares the same ORF with HBcAg with extra 5’ sequence, which encodes a signal peptide that direct the newly synthesized precore protein to secretory pathways (27). After cleavage of the N-terminus, the molecular weight of HBeAg decreases from 22 kDa to 17 kDa, smaller than HBcAg. In contrast to HBcAg, which is particulate, HBeAg is non-particulate and secretory. Studies illustrated that HBeAg is dispensable for the replication and infection of HBV (28, 29). However, researches in terms of viral immunology revealed a protective role of HBeAg for HBV
to evade host immunity (30, 31).
HBV polymerase (90 kDa) consists of 3 functional domains: terminal protein (TP) domain, reverse transcriptase (RT) domain, and RNase H domain (RH) (32). TP domain is responsible for protein-priming step of viral replication, while RH domain possesses an enzyme function for digesting the RNA template after reverse transcription by RT domain.
The molecular weights of pre-S1, pre-S2, and S envelope proteins are 39, 33, and 25 kDa, respectively. These proteins share common C-terminal sequences. After
synthesized and modified with glycosylation, these proteins are secreted as 22-nm subviral particles, which contain no nucleocapsid of HBV, whereas the 42-nm Dane particles, which are infectious, comprise nucleocapsid. In patients’ serum, Dane particles are outnumbered by the non-infectious subviral particles (104 to 106 folds).
HBx protein has a molecular weight of 17 kDa. HBx protein is inessential for HBV replication but can enhance viral replication (33). Nonetheless, it has been demonstrated that HBx protein can interact with several cellular proteins and regulate their
physiological functions, which leads to onsets of hepatocellular carcinoma (HCC) (34).
1.2.3 Replication and life cycle
Hepatocyte is the major tropism of HBV. The putative receptor of HBV has recently been identified and further studies are required to confirm this discovery (35, 36). After the nucleocapsid is transported to the nucleus, the partially double-stranded DNA is converted to cccDNA by cellular DNA polymerase. The episomal cccDNA serves as the template for viral transcripts. After transcription and translation, the pregenomic RNA is bound by viral polymerase and subsequently encapsidated into nucleocapsid, where replication of viral DNA takes place. After reverse transcription by polymerase,
the newly formed negative strand DNA becomes the template for synthesis of positive strand. The mature nucleocapsid containing the partially double-stranded DNA genome is transported back to the nucleus to replenish the pools of cccDNA or enveloped by pre-S1, pre-S2 and HBsAg at a ratio of 1:1:4 followed by secretion.
1.2.4 HBV infection
Patients who are serologically positive for HBsAg for more than 6 months are diagnosed as chronic hepatitis B (CHB) infection. More than 350 millions of people worldwide are suffering from chronic hepatitis B infection. HBV infection in adulthood usually becomes asymptomatic and self-limited (90-95%), whereas most neonatal infection via vertical transmission and infection during childhood develop into chronic infection (more than 90%) (37). Additionally, acute HBV infection in persons under immunosuppression conditions is more likely to turn into chronic infection (38).
1.2.5 Immune responses in HBV infection
Persistent infection of hepatitis B virus (HBV) is a common cause of liver cirrhosis and hepatocellular carcinoma worldwide and elucidating the mechanisms of the immunological interaction between HBV and host is the key step toward resolving the diseases (39-41). In acute HBV infection, viral clearance requires specific CD8 T cells which are induced vigorously after exposure to viral antigens and equipped with fully activated antiviral functions, including both cytolytic and non-cytolytic effects that lead to self-limited infection. In contrast, clinical observations of chronic carriers reveal functional defects of HBV-specific CD8 T cells in terms of both quantity and quality. In line with other chronic viral infections, the levels of viremia of chronic HBV patients are inversely correlated to the frequencies of HBV-specific CD8 T cells and their
production of cytokines such as IFN-γ which control the viral replication (23). There is a correlation between the expression of PD-1 of these T cells and the viremia levels in patients and blocking PD-1:PD-L1 pathway improve the function of specific CD8 T cells in vitro (42). Nonetheless, the investigation of the direct effect of HBV burdens on T cell dysfunction is limited by the diversities of genetic background of patients, viral genotypes, and time of exposure to antigens. It is also difficult to address this issue due to the lack of small animal models of natural chronic HBV infection.
1.2.6 Animal models
Since the natural hosts of HBV are human, chimpanzee, and tupaia, proper animal models with available immunological reagents are absent (43, 44). Several substitutive animal models were developed and used for the research of HBV. Alternative
hepadnaviruses that possess infectivity toward hepatocytes of ducks (duck hepatitis B virus, DHBV) and of woodchucks (woodchuck hepatitis virus, WHV) have been used in virological and immunological researches (45, 46). Nevertheless, these viruses differ from HBV and manipulation of experiments of these alternative animals is quite
difficult. Immunodeficient mice baring human hepatocytes as xenografts provide mouse model for virological researches and drug screening. However, the lack of immune system and the laborious experimental procedures render this model limited (47).
HBV-transgenic mice, with HBV genome integrated chromosomally as, were firstly introduced as a mouse model of chronic carrier for the studies of anti-HBV immunity in chronic infection (48, 49). It has a limitation that HBV-specific CD8 T cells are absent in these mice due to central tolerance. As a result, HBV-specific CD8 T cells have to be generated by other donors and adoptively transferred into the transgenic recipients.
Hydrodynamic injection of plasmids containing terminally redundant HBV genome lead
to chronic infection in part of injected mice (30 to 40%) depending on mouse strains (50). Liver damages are observed in injected mice with elevated serum alanine
aminotransferase (ALT). Infection of adenoviral vectors carrying the full-length HBV genome can bypass the viral entry step but can only establish transient expression of HBV. A recent report showed that low dose of adenoviral vectors can achieve long-term HBV replication and protein expression in mouse hepatocytes (51). However, it is difficult to manipulate viral loads in these models due to a relatively narrower window to establish persistent infection.
Using adeno-associated viral (AAV) vectors containing two split genomes of HBV (AAV2/8-5’-HBV-SD and AAV2/8-3’-HBV-SA), we establish persistent viral
replication and expression after recombination of two HBV half genomes in the hepatocytes of immunocompetent mice (52). The persistent rate is 100% and
independent on mouse strains, as the presence of HBV virions and proteins are detected in the sera and the livers of 4 different strains. The profiles of antibody responses are similar to those observed in chronic carriers, while HBs- but not HBc-specific IFN-γ production of CD8 T cells are detected both in the liver and, to a less extent, the spleen.
The frequencies of HBs-reacting CD8 T cells peak at 2 weeks post-infection (p.i.) decrease gradually during persistent infection. The cellular immunity against HBV peaks at week 2 p.i. but diminishes during the persistent expression of virus, indicating a tolerant phenotype to HBV in the immunocompetent hosts. Mice infected with AAV/HBV show hyporesponsiveness to HBV vaccination, but the immunity against ovalbumin (OVA) induced by immunization is comparable to uninfected mice, suggesting the immune tolerance is HBV specific.
There are several advantages of this AAV-mediated mouse model of chronic HBV infection. First, transduction of AAV/HBV shows poor induction of innate immune
responses in immunocompetent hosts (53, 54), which recapitulates HBV infection (55, 56). Second, the AAV DNA genomes are converted into concatamer, an episomal form of extrachromosomal DNA (57), which resembles cccDNA of HBV. Third, the
recombinant AAV vectors is defective and no viral genes of AAV are expressed in transduced cells (58). Most importantly, viral loads of HBV in infected hosts can be controlled by adjusting AAV/HBV titers used for infection.
1.3 Aim of this study
In this report, using AAV/HBV-mediated mouse model of chronic HBV infection, we were able to manipulate infectious doses and persistent viral loads in immunocompetent hosts while the infection duration and the homogeneity of host and virus are controlled.
We demonstrated that mice expressed and maintained high HBV proteins exhibited a great level of dysfunction of HBV-specific CD8 T cells, concomitant with up-regulation of PD-1 expression. Deprivation of PD-1:PD-L1 signaling partially restored the
functions of HBV-specific CD8 T, however, was not sufficient to achieve long-term suppression of HBV in hosts with high viral proteins. Our results suggest that blocking PD-1 signaling alone may not be sufficient to control HBV in chronic carriers,
especially in those with high viral burdens.
2. Materials and Methods
2.1 Animals
Male C57BL/6 mice were purchased from the National Laboratory Animal Breeding and Research Center (Taipei, Taiwan). PD-L1 KO mice were kindly provided by Dr.
Lieping Chen (59). All animals were housed in a specific pathogen-free environment in the animal facility of the Institute of Biomedical Sciences, Academia Sinica. All
experimental procedures complied with the regulations of the Academia Sinica Institutional Animal Care and Use Committee and the Council of Agriculture Guidebook for the Care and Use of Laboratory Animals.
2.2 Adeno-associated viral (AAV) vectors
The AAV2/8-5’HBV-SD and AAV2/8-3’HBV-SA which contain 5’-HBV and 3’-HBV genome, respectively, were generated and described previously (52). Briefly, plasmid pHBV1.3, containing the 1.3-times overlength HBV genome (genotype D), was split at the CAG/G site between nucleotides 2192 and 2193. A highly conserved
synthetic intronwas inserted at the split site. Plasmids pAAV5’-HBV-SD and
pAAV-3’-HBV-SA were generated by subcloning the two halves of HBV genome were subcloned into the pAAV-MCS vector (Stratagene, La Jolla, CA), which contains the inverted terminal repeat of AAV serotype 2 at both ends. AAV/Empty that contains no transgene served as a negative control. All AAV vectors were generated by the triple transfection method and purified by CsCl sedimentation (58). The physical vector genome (vg) of AAV was measured by quantitative PCR using SYBR Green reaction mix (Roche Diagnostics, Mannheim, Germany) (60).
2.3 AAV injection
Mice at 6-8 weeks of age were intravenously injected with the indicated titers (1010, 1011, or 1012 vg) of both AAV2/8-5'-HBV-SD and AAV2/8/-3'-HBV-SA (designated as AAV/HBV). Mice injected with AAV/Empty of the same titers were used as negative controls.
2.4 Immunization
In vivo electroporation following plasmid injection was performed as previously described (61). Briefly, mice were anesthetized with acepromazine maleate (Fermenta Animal Health Co., Kansas, Mo., USA). Fifty micrograms of plasmid DNA encoding CMV promoter-driven HBsAg, HBcAg, or OVA was injected into each bilateral quadriceps muscles using a disposable insulin syringe with a 27-gauge needle.
Immediately after injection, a pair of electrode needles was inserted into the muscle to a depth of 5 mm to encompass the DNA injection sites, and electric pulses were delivered using an electric pulse generator (Electro Square Porator ECM 830; BTX, San Diego, Calif., USA). The shape of the pulse was a square wave. The electrodes consisted of a pair of gold-plated stainless steel needles 5 mm in length and 0.8 mm in diameter with a fixed distance between them of 5 mm. Six pulses of 100 V each were administered to each injection site at a rate of 1 pulse/s, with each pulse being 50 miniseconds in duration. The procedure was repeated once two weeks after the first immunization. In experiments indicated, mice were i.v. injected with 1 x 10⁸ PFU of adenoviral vector expressing pre-S2 envelope protein one week after the second DNA immunization.
2.5 Isolation of splenocytes and intrahepatic lymphocytes
Splenocytes and intrahepatic lymphocytes were isolated on a Percoll density gradient
as described (62). Briefly, the liver was perfused with HBSS, removed and sliced, followed by incubation with collagenase IV (Sigma-Aldrich, St. Louis, MO) at 37°C for 30 min. Intrahepatic lymphocytes were separated from parenchymal cells by
centrifugation at 50×g for 5 min. Cells prepared from one mouse were suspended in 20 ml of 33% Percoll gradient solution (GE Healthcare, Piscataway, NJ) and centrifuged at 754×g for 18 min. After treated with red blood cell lysis buffer and washed with PBS, cells were used for IFN-γ ELISPOT and flow cytometric analysis.
2.6 IFN-γ and TNF-α ELISPOT
CD8 T cells were positively selected from intrahepatic and splenic lymphocytes using mouse CD8a MicroBeads and magnetic separator (Miltenyi Biotec, Bergisch-Gladbach, Germany). Mouse IFN-γ and TNF-α ELISPOT Ready-Set-Go kit (eBioscience, San Diego, CA) was used according to the manufacturer’s instruction. Briefly, CD8T cells (2.5 × 10⁴ to 5 × 10⁵ cells per well) were cocultured with EL4 cells, a murine thymoma cell line derived from C57BL/6 mice, pulsed with 10 µg/ml of peptides on
MultiScreen-IP plates (Millipore, Bedford MA) precoated with α-IFN-γ capture antibody. Three H-2Kb-restricted HBV epitopes, HBs190-197, HBs208-215, and HBc93-100
were used. The OVA257-264 peptide, an H2-Kb-restricted ovalbumin epitope and Con A (2 µg/ml) were used as negative and positive controls, respectively. Spots were
developed 18-24 h and detected sequentially with biotinylated antibody against IFN-γ, streptavidin-horseradish peroxidase, and AEC substrates. Spots were counted with AID ELISPOT Reader System with software 5.0 (AID GmbH, Ottobrunn, Germany).
2.7 Serological analysis
Sera samples were collected at different time points post AAV injection. Serological
markers for HBV (HBsAg and α-HBs antibodies) were quantified using an Elecsys Systems electrochemiluminescence kit and a Cobas e analyzer (Roche Diagnostics GmbH, Mannheim, Germany).
2.8 Flow cytometric analysis and fluorescence-activating cell sorting (FACS)
PD-1 expression on intrahepatic and splenic T lymphocytes was characterized by flow cytometric analysis. Cells were pre-incubated with α-CD16/32 monoclonal antibody (mAb, 2.4G2; ATCC, Manassas, VA) to block nonspecific binding of antibodies to Fc receptors. Cells were then incubated with the following mAbs for 30 min on ice: eFluor® 450-conjugated rat α-mouse TCRβ (H57-597, eBioscience, San Diego, CA), allophycocyanin (APC)-eFluor® 780-conjugated rat α-mouse CD8a
(53-6.7, eBioscience, San Diego, CA), phycoerythrin (PE)-conjugated hamster α-mouse PD-1 (J43, eBioscience, San Diego, CA), PE-conjugated rat α-mouse LAG-3 (C9B7W, eBioscience, San Diego, CA), fluorescein isothiocyanate (FITC)-conjugated rat
α-mouse 2B4 (eBio244F4, eBioscience, San Diego, CA),
Peridinin-Chlorophyll-Protein-Complex (PerCP)-conjugated rat α-mouse Tim-3 (215008, R&D Systems Inc., Minneapolis, MN), and Alexa Fluor 647-conjugated rat α-mouse CD11a (M17/4, Biolegend, San Diego, CA). After wash, cells were stained with fixable viability dye eFluor® 506 for 30 min on ice. Cells were analyzed with FACS LSRII (BD Biosciences, San Jose, CA) and FlowJo V.7.2.5 software (Treestar, Ashland, OR). For intracellular cytokine staining, cells were harvested after culture for 6-12 hours in the presence of brefeldin A (Biolegend, San Diego, CA) in U-bottom 96-well plates. After stained with surface marker and viability dye, cells were fixed and permeablized with fixation/permeablilization kit (eBioscience, San Diego, CA) for 1
hour. The following mAbs were used for cytokine staining: PE-conjugated rat α-mouse IFN-γ (XMG1.2, BD Biosciences, San Jose, CA) and FITC-conjugated rat α-mouse TNF-α (MP6-XT22, eBioscience, San Diego, CA). For FACS, lymphocytes isolated from the liver and the spleen were stained with TCRβ, CD8a, and PD-1 as previous described after blocking. 7-amino-actinomycin D (7-AAD, eBioscience, San Diego, CA) was used to rule out dead cells.
2.9 In vivo blockade with mAb injection
Mice at 6-8 weeks of age were intraperitoneally injected with 200 µg of α-LAG-3 mAb (clone C9B7W, BioXCell, West Lebanon, NH) or Rat-IgG isotype control
antibody on day -7, -1, 4, 8, 15, 21, 25, 39, 47, and 56. On day 0, treated mice were i.v.
injected with 1011 vg AAV/HBV.
2.10 Preparation of bone marrow-derived dendritic cells (BMDCs) and in
vitro adenovirus infectionBMDCs were generated following the method reported by Lutz et al (63). In brief, bone marrow cells were isolated from femurs and tibiae, and cultured on Petri dish with RPMI containing 10% FBS, 50 µΜ b-ΜΕ, and 200 U/ml of GM-CSF. Fresh
GM-CSF-containing medium was replenished on day 3, 6, and 8. On day 10, suspended cells were collected and infected with 50 MOI of adenoviral vectors expressing either full-length HBV, pre-S2 envelope protein, HBcAg, by centrifugation at 2000×g, 37°C for 2 hours (64). After wash twice with PBS, BMDCs were cultured in RPMI
containing 100 U/ml of GM-CSF for 24 hours before subjected to further stimulation.
2.11 In vitro T-cell expansion
CD8 T cells were expanded in vitro with protocols modified from previous studies (23, 65). Briefly, Sorted CD8 T cells (2×10⁴ per well) were co-cultured in U-bottom 96-well plates with LPS-primed BMDCs (2×10⁴ per well) that were pulsed with overlapping peptide pools. Naïve splenocytes (2×10⁵ per well) that were previously irradiated with 45 Gy γ-radiation were added as feeder cells. The culture medium (RPMI with 10% FBS, 50 µM β-ME) contains interleukin-7 (IL-7, 5 ng/ml), IL-12 (100 pg/ml), IL-15 (1 ng/ml), and Dynabeads coated with α-CD3 plus α-CD28 mAbs (8×10⁴ per well). IL-2 (100 U/ml) was added on day 4 of culture. On day 10, 150 µl of culture medium was aspirated and peptide-pulsed irradiated naïve splenocytes were added along with 100U/ml of IL-2 for a second round of expansion. On day 20, all expanded cells were subjected to TNF-α ELISPOT.
2.12 T cell receptor (TCR) repertoire spectratype analysis
To analyze the TCR Vβ transcript size patterns, cDNA samples were amplified using a TCR Cβ (TCR β-chain constant region)-specific primer and a set of TCR Vβ (TCR β-chain variable region)-specific primers (66). Detail sequences are descried in Table 2.
Sorted cells were subjected to RNA extraction by RNeasy Mini kit (Qiagen, Hilden, Germany) and reverse transcription by Transcriptor Reverse Transcriptase (Roche, Diagnostics, Mannheim, Germany). PCR was performed in a total volume of 12.5 µl containing 0.1 µl FastStart Taq DNA polymerase (5 U/µl) (Roche Diagnostics, Mannheim, Germany), 1.25 µl 10× reaction buffer, 1 µl dNTPs (2.5 mM), 0.75 µl MgCl2 (25 mM), 1 µl forward and reverse primers (5 mM) and 1.25 µl cDNA. After an initial denaturation step of 5 minutes at 95°C, the reactions were subjected to 45 cycles of polymerase chain reaction (PCR; 30 seconds at 95°C, 30 seconds at 60°C, 45 seconds
at 72°C) followed by a final elongation step for 10 minutes at 72°C. PCR products were then labeled with Cβ-carboxyfluorescein (Cβ-FAM) primer by 5 cycles of primer extension. The primer extension conditions include an initial denaturation of 2 min at 95°C and 5 PCR cycles of 2 min at 95°C, 2 min at 60°C and 20 min at 72°C. Labeled PCR products were mixed with the cocktail of 10 µl deionized formamide and
GeneScan-500 LIZ size standard (Applied Biosystems, Foster City, CA) and
cDNA-fragment length were analyzed with ABI 3700 Analyzer (Applied Biosystems, Foster City, CA) and PeakScanner Analysis Software 1.0 (Applied Biosystems, Foster City, CA) according to the manufacturer’s protocol.
2.13 Statistics
The unpaired Student t test was used for statistic analyses. Results were regarded as significant if the two-tailed p value was ≤ 0.05.
3. Results
3.1 Negative Effects of Viral Loads on The Function of HBV-Specific CD8 T Cells
As reported in clinical studies, the viral titers of HBV in chronic carriers correlate ex vivo to the numbers and functions of specific CD8 T cells (23). To examine the direct effect of viral loads on the functions of HBV-specific CD8 T cells, we infected
C57BL/6 mice with 1010 (low), 1011 (intermediate), or 1012 (hi) vg of AAV/HBV.
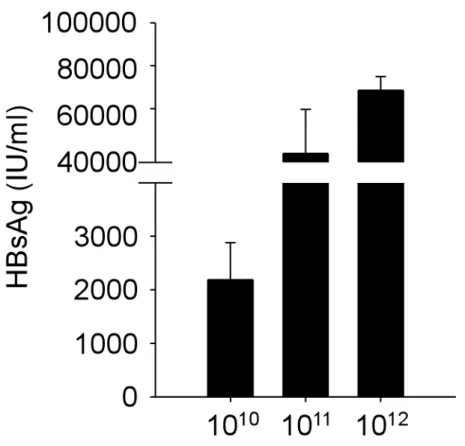
Infection with these doses of AAV/HBV established persistent expressions of HBsAg, which is detected 6 months p.i. (Figure 1). To gain insight into the functions of
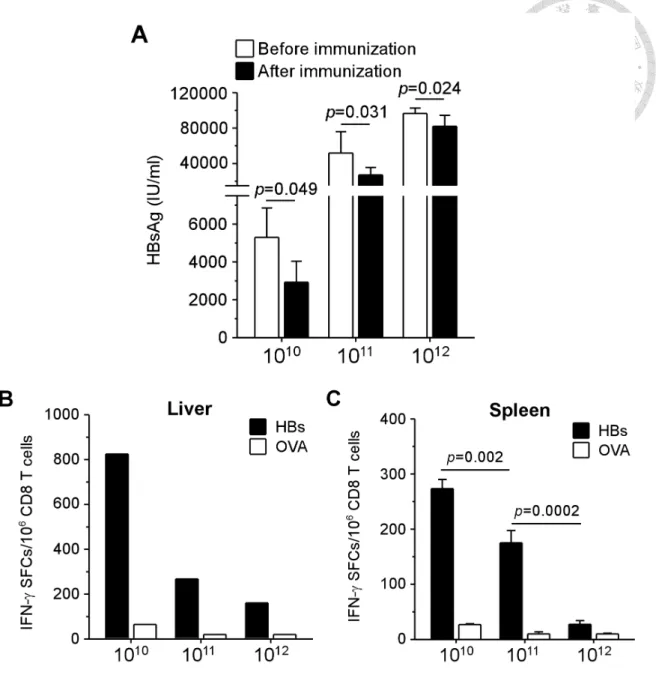
HBV-specific CD8 T cells, we treated infected mice at week 2 p.i. with therapeutic vaccination consisting of twice immunization with plasmid DNA encoding HBsAg followed by a booster of adenoviral vector expressing pre-S2 envelope protein. As shown in Figure 2, the levels of serum HBsAg correlated to the viral titers at week 2 p.i.
(5.3 ± 1.6×10³, 5.2 ± 2.4×10⁴, and 9.7 ± 0.6×10⁴ IU/ml for low, intermediate, and high viral load groups, respectively). After vaccination, shown in Figure 2A, we observed approximately 50% significant reduction of HBsAg in low and intermediate viral load groups (2.9 ± 1.1×10³ and 2.7 ± 0.8×10⁴ IU/ml, p = 0.049 and 0.031, respectively), whereas the level of HBsAg in mice with high viral load reduced only slightly (8.2 ± 1.2×10⁴ IU/ml, p = 0.024). It is noteworthy that anti-HBs antibodies were detectable in none of the groups of different viral loads (data not shown), suggesting therapeutic vaccine alone was not sufficient to eliminate chronic HBV infection even in the low viral load group. The functions of intrahepatic CD8 T cells at one week after
vaccination, however, were restored more efficiently in low viral load group, resulting in 3.1- and 5.1-fold greater numbers of IFN-γ spot-forming cells than that in the groups
of intermediate and high, respectively (Figure 2B). Consistently, shown in Figure 2C, therapeutic vaccination induced the greatest number of IFN-γ producing HBV-specific CD8 T cells in the spleens of low viral load group (273 ± 17 spot-forming cells per million CD8 T cells), which was significantly higher than those in the groups of intermediate (175 ± 22, p = 0.002) and high (27.5 ± 6.6, p = 0.0002). These data revealed a viral load-dependent tolerance of HBV-specific CD8 T cells in this mouse model of chronic HBV infection.
3.2 Intrahepatic T cells from mice with high viral loads expressed higher levels of inhibitory receptors, especially PD-1
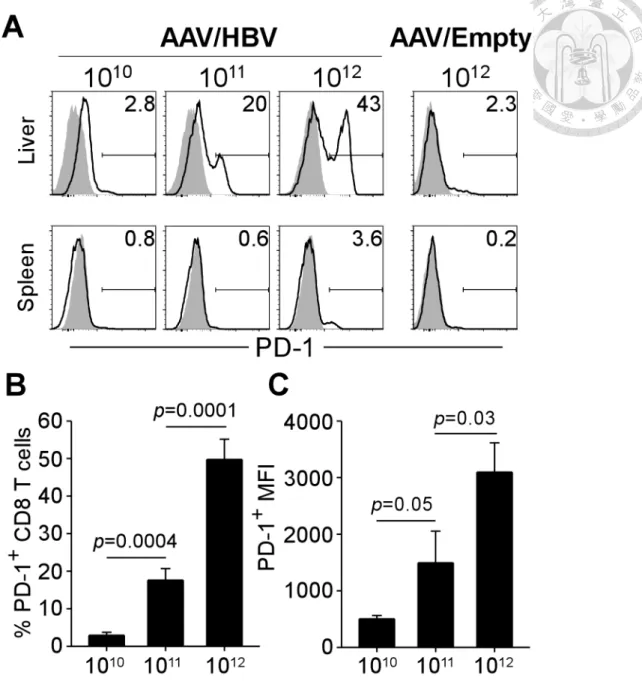
To dissect the mechanisms of HBV-specific immune tolerance in varying degrees, we analyzed the phenotypic profiles of CD8 T cells in the liver and spleen of mice infected with low, intermediate, and high viral loads. After 4 months of AAV/HBV infection, intrahepatic CD8 T cells expressed several inhibitory receptors, including programmed death-1 (PD-1; also know as CD279), 2B4 (CD244), lymphocyte activation gene-3 (LAG-3; CD223). Among these receptors, PD-1 was upregulated with the greatest extent and its expression levels raised as the viral loads increased (Figure 3A). As shown in Figure 3B, in mice with high viral load (1012 vg), 49.8 ± 5.4% of CD8 T cells in the liver expressed PD-1, which is significantly greater than the frequencies of PD-1+ CD8 T cells in the liver of intermediate (1011 vg) and low (1010 vg) viral load groups (17.6 ± 3.1% and 2.9 ± 0.8%, respectively). Moreover, intrahepatic CD8 T cells from high viral load mice displayed 2.1- and 6.1-fold higher mean fluorescence intensity (MFI) for PD-1 (3,097 ± 518) in comparison with intermediate and low viral load groups (1,494 ± 560 and 504 ± 59), indicating an reinforced tolerance of intrahepatic CD8 T cells in the context of high viral loads (Figure 3C). In contrast, PD-1 expression
was only slightly upregulated on splenic CD8 T cells (Figure 3A), suggesting a local effect of HBV-induced tolerance in the liver. The induction of PD-1did not result from the AAV vectors, since it was not observed in mice infected with high dose of
AAV/Empty, which contains no transgene (Figure 3A).
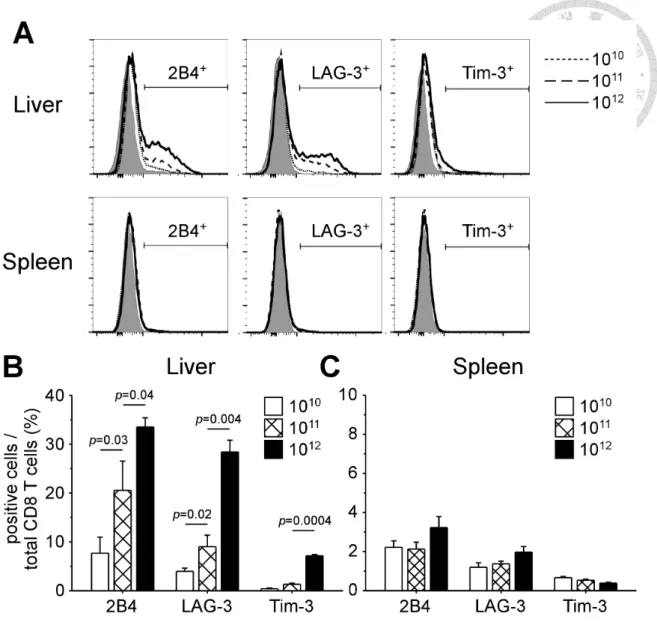
Intrahepatic CD8 T cells also overexpressed other inhibitory receptors, such as 2B4 and LAG-3, in a viral load-dependent manner (Figure 4A). Figure 4B shows the percentages of 2B4+ cells among total intrahepatic CD8 T cells in mice with different viral loads (7.7 ± 3.3%, 20.5 ± 6.0%, and 33.5 ± 1.9% for low, intermediate, and high viral load, respectively). The same trend of upregulation was observed in LAG-3+ cells (4.0 ± 0.6%, 9.0 ± 2.4%, and 28.4 ± 2.4% for low, intermediate, and high viral load, respectively). The expression levels of 2B4 and LAG-3 were more moderate in
comparison with that of PD-1. Upregulation of Tim-3 was only observed on intrahepatic CD8 T cells of high viral load group (7.2 ± 0.2%). No overexpression of inhibitory receptors on splenic CD8 T cells was detected.
A viral load-dependent PD-1 upregulation was also found on intrahepatic CD4 T cells (Figure 5A). As shown in Figure 5B, the frequency of PD-1+ CD4 T cells was the highest in high viral load group (57.6 ± 0.8%), compared with intermediate group (31.1
± 5.1%) and low group (14.9 ± 0.7). Surprisingly, splenic CD4 T cells expressed PD-1, whose expression levels were independent on viral loads. In AAV/Empty mice, the expression of PD-1 was also found on splenic CD4 T cells but not on CD8 T cells (data not shown), suggesting an effect irrelevant to HBV. The upregulation of other inhibitory receptors were not observed on both intrahepatic and splenic CD4 T cells. These data indicate that exhausted phenotypes of CD8 and CD4 T cells were induced locally by AAV/HBV infection in a manner dependent on viral loads.
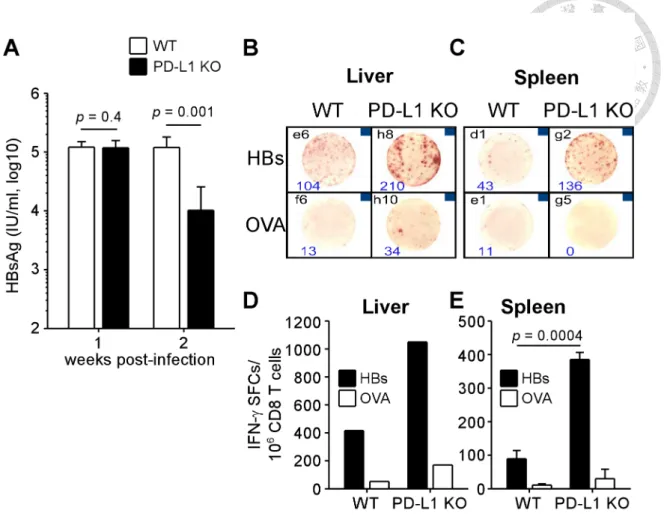
3.3 The reduction of viral antigens and ameliorated immune responses in the absence of PD-1:PD-L1 interaction
Upon engagement to its ligands, PD-1 generated signals that inhibit TCR signaling and subsequent activation of T cells (7). To investigate the role of PD-1 signaling in regulating HBV-specific immunity in this mouse model of HBV infection, we
compared the serological and immunological results of WT mice with PD-L1 KO mice, which lack B7-H1, the major ligand of PD-1. After 1 week of infection with 1012 vg of AAV/HBV, the level of HBsAg in the serum of PD-L1 KO mice was comparable to that of WT mice (Figure 6A). However, compared to their WT littermates, KO mice showed a significant 11.8-fold reduction of HBsAg at week 2 p.i. As shown in Figure 6B to D, the reduction was concomitant with the observation of more potent IFN-γ production by HBV-specific CD8 T cells from both the liver and spleen of KO mice (1,050 and 385 ± 21 spot-forming cells per million CD8 T cells), in comparison with WT mice (416 and 89 ± 25 spot-forming cells per million CD8 T cells), suggesting the important effect of PD-1:PD-L1 interaction on the regulation of HBV-specific
immunity in the early stage of infection.
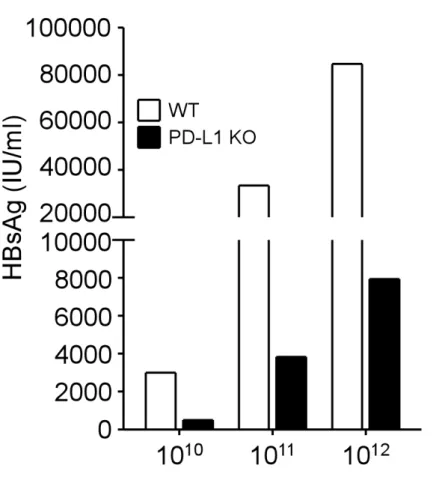
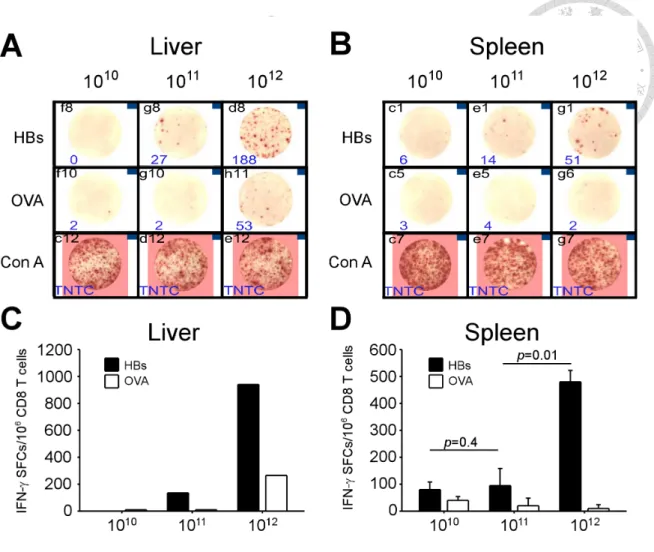
3.4 Loss of viral control and HBV-specific responses of CD8 T cells in high viral load mice even in the absence of PD-1:PD-L1 interaction
In order to determine the effect of PD-1 signaling on immune tolerance to HBV in the context of different viral loads, we use low, intermediate, and high titers of AAV/HBV to infect WT and PD-L1 KO mice. Serum HBsAg showed comparable levels within the same viral load group at the first week after infection, regardless of deficiency of PD-L1 (data not shown). One week later, the HBsAg levels decreased in KO mice of all viral
load groups (Figure 7). In this early phase of infection (2 weeks p.i.), the functions of HBV-specific CD8 T cells had positive correlation with viral loads in PD-L1 KO mice (Figure 8). In mice infected with high viral loads, the numbers of HBV-specific IFN-γ spot-forming cells were the greatest in the liver (940 spot-forming cells) and the spleen (480 ± 42 spot-forming cells), compared with mice with intermediate and low viral loads.
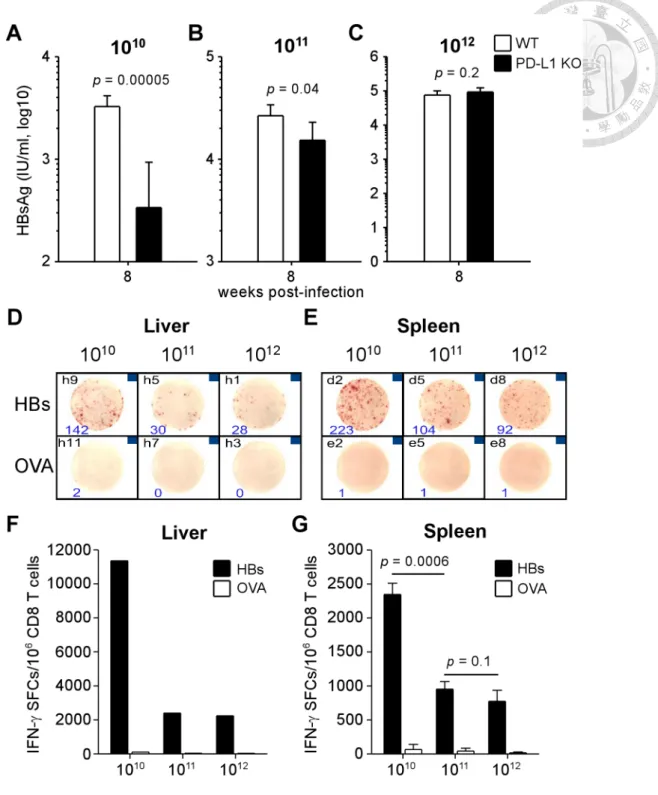
Nonetheless, in the late phase of infection (week 8 p.i.), the control of viral antigen levels was lost in high viral load mice (Figure 9A to C). The antigen level of KO mice infected with high viral load elevated to the comparable level of WT mice (9.3 ±
3.0×10⁴ vs. 7.5± 2.5×10⁴ IU/ml, p = 0.2), and this restoration of HBsAg was incomplete in KO mice with intermediate viral loads, whose HBsAg level remained 58% to that of WT mice of intermediate group (1.5 ± 0.8×10⁴ vs. 2.7 ± 0.7×10⁴ IU/ml, p = 0.04). The HBsAg level did not rebound in KO mice infected with low viral load at week 8 p.i.
(3.4 ± 6.0×10² vs. 3.3 ± 0.9×10³ IU/ml, p = 0.00005).
Consistent to the observation of viral control, the IFN-γ-secreting HBV-specific CD8 T cells were most numerous in the liver of low-viral load-infected PD-L1 KO mice when compared to intermediate- and high-viral loads (11,360 vs. 2,400 and 2,240 spot-forming cells per million CD8 T cells, Figure 9D and F). The specific CD8 T cells in the spleen of KO mice with low viral load also displayed stronger responses in comparison with mice with intermediate and high loads (2,346 ± 164 vs. 953 ± 41 and 775 ± 16 spot-forming cells per million CD8 T cells). These data indicate that lack of PD-1 signaling is not sufficient to control the viremia and maintain functional specific CD8 T cells in the context of high viral load, suggesting PD-1 partially contributes to the immune tolerance.
3.5 Blockade of LAG-3 accelerated the reduction of serum HBsAg in PD-L1 KO mice
For further investigation of other factors regulate the establishment of immune tolerance to HBV, we treated WT and PD-L1 KO mice with commercially available α-LAG-3 monoclonal antibody (mAb) to examine the inhibitory effect of LAG-3, one of the potential targets that were overexpressed on intrahepatic CD8 T cells in this model. Mice were intraperitoneally injected with 200 µg α-LAG-3 mAb or Rat-IgG isotype approximately once a week, starting at one week before infection of AAV/HBV (1011 vg). As shown in Figure 10, the first significant reduction of serum HBsAg was observed on day 14 p.i. in PD-L1 KO mice treated with α-LAG-3 mAb (2.5×10⁵ IU/ml), compared to day 7 p.i. (6.3×10⁵ IU/ml; 2.5-fold reduction, p = 0.005). The levels of HBsAg of isotype treated KO mice reduced secondly at day 25 p.i. (7.4×10⁴ IU/ml), compared to day 14 p.i. (5.8×10⁵ IU/ml; 7.9 fold-reduction, p = 0.008). A later
reduction was detected in WT mice treated with α-LAG-3 mAb at day 37 p.i. (2.8×10⁵ IU/ml), compared to day 25 p.i. (5.0×10⁵ IU/ml; 1.8-fold reduction, p = 0.02). There is no reduction observed in WT mice treated with isotype control. The HBsAg levels at week 8 p.i. maintained ~50% of the first week after infection in all groups except WT-isotype group. The result suggests a synergistic effect of PD-1 and LAG-3 on the acceleration of viral suppression. However, there is no difference in terms of the suppression level of HBsAg at the late stage of infection.
3.6 Identification of H-2K
b-restricted epitopes of HBsAg and HBcAg
Since the inhibitory receptors on intrahepatic CD8 T cells were only overexpress in AAV/HBV-infected mice but not in AAV/Empty-infected mice, the PD-1+ CD8 T cells are reasonably assumed to be specific to HBV. A desired approach to demonstrate theHBV specificity of PD-1+ CD8 T cells is flow cytometric analysis using PD-1 and tetramer staining. However, we were unable to detect specific CD8 T cells in
AAV/HBV-infected mice using HBs190-197-pentamer, suggesting there could be other clones of HBV-speccific CD8 T cells. In order to gain access to the detection and analysis of other clones of HBV-specific CD8 T cells, we screen the sequences of HBsAg and HBcAg to identify all the dominant H-2Kb-restricted epitopes using overlapping peptides that span the whole sequences of HBsAg and HBcAg (Table 1).
After immunized with plasmid DNA encoding HBsAg and HBcAg, C57BL/6 were sacrificed and splenic CD8 T cells were subjected to IFN-γ ELISPOT. EL4 cells pulsed with overlapping peptide pools were used to stimulate effector CD8 T cells of
immunized mice. Three peptide pools of HBsAg (S31-40, S61-70, and S71-76) and one pool of HBcAg (C21-30) showed positive responses (Figure 11A and B), indicating that these pools contain H-2Kb-restricted epitopes which were recognized by HBV-speicifc CD8 T cells from immunized mice. A second round of screening was performed using individual peptides from the 4 positive pools discovered in the last IFN-γ ELISPOT. As shown in Figure 11C and D, we found 6 individual peptides that were recognizable by HBV-specific CD8 T cells. Consistent with previous studies (67-69), these individual peptides contain 3 H-2Kb-restricted epitopes: HBs190-197 in S70 and S71; HBs208-215 in S74 and S75; HBc93-100 in C14 and C15 (labeled in Table 1). HBs208-215- and
HBc93-100-specific CD8 T cells should be detected with functional tetramer/pentamer in the future.
3.7 Detection of subdominant clones of HBV-specific CD8 T cells which recognize other HBV epitopes during chronic infection
Evidences have been shown that dominant clones of virus-specific CD8 T cells can
be subjected to apoptosis that leads to clonal deletion during persistent exposure to cognate antigens in chronic viral infection (70). As a result, subdominant clones could become dominant ones in the late phase of infection. The intrahepatic CD8 T cells overexpressing PD-1 therefore may recognize HBV epitopes other than those identified by a method of immunization (Figure 11). To address whether these PD-1+ CD8 T cells are reactive to other epitopes, we isolated intrahepatic lymphocytes from
AAV/HBV-infected mice (1011 vg, 12 months p.i.) and stimulated them with EL4 cells pulsed with overlapping peptide pools. The productions of IFN-γ and TNF-α by
intraheptic CD8 T cells were detected by flow cytometric analysis after intracellular cytokine staining, and meanwhile the expression of PD-1 was exmained. The frequency of PD-1+ expression on intrahepatic CD8 T cells was 33% (data not shown). However, there was no significant production of effector cytokines by total intrahepatic CD8 T cells (both PD-1+ and PD-1-) after co-culturing with HBV epitope-presenting EL4 cells, compared to control groups of irrelenvant epitope (OVA) and EL4 cells alone (Med).
Because of exhausted status, these CD8 T cells could lose effector functions upon recognizing cognate epitopes. Thus, a more potent stimulation may be required to activate these CD8 T cells by proffesional antigen-presenting cells (APCs).
We next test this approach with bone marrow-derived dendritic cells (BMDCs) from PD-L1 KO mice and in vitro infected BMDCs using adenoviral vectors expressing either full-length of HBV (Ad-HBV), pre-S2 envelope protein (Ad-mS), or core antigen (Ad-C). The infection of adenovirus resulted in the activation of BMDCs, as the
expression of CD80, CD86, and CD40 were highly induced after infection. Mice infected with 1012 vg AAV/HBV for 6 weeks were sacrificed. After CD8 T cell enrichment from the liver and the spleen, intrahepatic and splenic CD8 T cells were sorted by fluorescence-activating cell sorting (FACS) after PD-1 staining (Figure 13A).
The PD-1 expressions on intrahepatic and splenic CD8 T cells were 56.2 and 10.2%, respectively (Figure 13B). Sorted CD8 T cells were co-cultured with
adenovirus-infected BMDCs that express HBV epitopes. As shown in Figure 13C, CD8 T cells from immunized mice (DDA) were activated by stimulation of BMDCs infected by Ad-HBV, Ad-mS, and Ad-C. The degrees of activation were more intense than stimulation by BMDCs infected by adenovirus expressin luciferase (Ad-Luc, negative control), indicating BMDCs infected by Ad-HBV, Ad-mS, and Ad-C were capable of eliciting activation of HBV-specific CD8 T cells. After co-culture, the sorted PD-1- and PD-1+ CD8 T cells showed no positive responses to HBV-specific stimulation when compared to Ad-Luc control, suggesting the stimulation by professional APCs may not be sufficient to activate the exhausted T cells.
In clinical studies, dysfunctional CD8 T cells from patients of chronic infection or cancer were in vitro expanded with the stimulation of epitopes prior to functional assay (23, 65, 71). The sorted PD-1- and PD-1+ intrahepatic CD8 T cells used in Figure 13 were in vitro expanded by co-culture with BMDCs irradiated naïve splenocytes pulsed with overlapping peptide pools. After 2 rounds of in vitro expansion, all expanded cells were subjected to TNF-α ELISPOT, in which peptide-pulsed EL4 cells were used to stimulate the expanded CD8 T cells. Figure 14 shows that a positive response was
detected in PD-1+ CD8 T cells stimulated with peptide pool S51-60 in TNF-α ELISPOT.
This response was not observed in PD-1- CD8 T cells stimulated with the same peptide pool. The data suggests that the PD-1 expressing CD8 T cells consist of HBV-specific CD8 T cells.
3.8 Alternative approaches to demonstrate the HBV-specificity of PD-1
+CD8 T cells
In addition to functional assays, alternative methods are used to determine the
pathogen-specificity of T cells. Antigen-specific CD8 T cells express higher amounts of CD11a and the upregulation of CD11a results from exposure to cognate antigens but not inflammation (72). In infection models that lack the information about MHC I-restricted epitopes, the antigen-experienced CD8 T cells with a portrait of CD11ahi were defined as pathogen-specific CD8 T cells (18). In AAV/HBV infected mice, CD11ahi CD8 T cells were detected in the liver and the frequencies of these antigen-experienced CD8 T cells were correlated to the viral loads and antigen levels (Figure 15A and C). The correlation between viral loads and the frequencies of CD11ahi CD8 T cells in the spleen was also observed (data not shown). All PD-1+ CD8 T cells expressed high level of CD11a (Figure 15B). However, a proportion of CD11ahi CD8 T cells was PD-1 negative, suggesting some antigen-experienced CD8 T cells did not overexpress PD-1.
HBV-specific CD8 T cells are assumed to be derived from oligoclones of naïve T cells. As a result, oligoclonal expansion of T cells is supposed to be detected in PD-1+ CD8 T cells. To prove this, we sorted intrahepatic CD8 T cells by FACS after PD-1 staining and analyze the lengths of CDR3 in TCRβ cDNA by PCR with primers specific for TCRβ variable regions after RNA extraction and reverse transcription. The CDR3 lengths of naïve T cells are randomly distributed due to rearrangement of CDR locus, and thus the spectratype of CDR3 of naïve T cells shows a Gaussian distribution. T cell repertoire that undergoes oligoclonal expansion contains more cells with certain length of CDR3, and thus a protruding peak rises in the spectratype profile. As shown in
Figure 16, non-Gaussian distributions were observed in 17 out of 20 spectratype profiles (85%) of PD-1+ intrahepatic CD8 T cells (labeled with arrows), whereas only 6 profiles
of abnormal distribution (27%) were observed in PD-1- counterpart. These data provide indirect evidences showing the existence of antigen-specificity in PD-1+ intrahepatic CD8 T cell, but not in PD-1- ones.
4. Discussion
In summary, our results demonstrated that chronic HBV infection with high levels of viral antigens resulted in upregulation of PD-1 expression and great levels of
dysfunction of HBV-specific CD8 T cells. Serum antigen levels in the early phase of infection was reduced in the absence of PD-1:PD-L1 signaling, along with the functional restoration of HBV-specific CD8 T cells. However, impeding the
PD-1:PD-L1 inhibitory signal was not sufficient to achieve long-term suppression of HBV in mice infected with high viral loads and the partially restored function of HBV-specific CD8 T cells was unable to eliminate the persistent virus.
4.1 Model advantage
More than 350 millions of people are suffering from persistent HBV infection and in high risks of viral hepatitis-derived liver cirrhosis and hepatocellular carcinoma (73, 74).
Although effective prophylaxis vaccinations have immensely reduced the rate of new infection, therapeutic approaches that facilitate the elimination of the cunning virus are still anticipated by chronic carriers, whose immune responses against HBV are found impaired in comparison to acute patients. Because HBV is unable to infect mouse hepatocytes, the lack of suitable mouse models of chronic infection impedes
experimental researches for understanding how HBV prevents the induction of antiviral immune responses and establishes persistent infection. HBV-transgenic mice were firstly introduced as a mouse model of chronic carrier for the studies of anti-HBV immunity in chronic infection (48, 49). HBV-specific CD8 T cells are absent in these mice due to central tolerance and have to be generated by other donors and adoptively transferred into the transgenic recipients. Hydrodynamic injection of plasmids or
infection of adenoviral vectors carrying the full-length HBV genome were reported to bypass the viral entry step and achieve long-term HBV replication and protein
expression in mouse hepatocytes (50, 51, 75). These approaches made successful models of chronic HBV infection in immunocompetent mice, however, it is difficult to manipulate viral doses in the infected hosts because of the experimental limitations of these models. Using adeno-associated viral vectors as a delivery system, we showed in this report that we are able to control the viral loads in immunocompetent hosts via different sizes of viral inoculum and all of the doses can establish persistent expression of HBV proteins (Figure 1). This allows us to address the effects of different viral loads on immune tolerance to HBV in a system with homogenous host genetics, viral
genotypes, and infection durations. For a comprehensive study of HBV-specific cellular immune responses, we screened HBV epitopes in the context of H2-Kb by overlapping peptide and identified 3 dominant epitopes of HBsAg and HBcAg that were previously reported (Figure 11) (67-69). We therefore focused on the functions and phenotypes of CD8 T cells recognizing these three HBV epitopes during persistent HBV infection.
4.2 Tolerance
Our AAV/HBV infection model recapitulates several immunological features of chronic viral infections. In chronic viral infections of humans with HIV, HBV, and HCV and of mice with LCMV, virus-specific CD8 T cells are characterized with exhausted phenotypes (1, 3, 76, 77). Virus-specific CD8 T cells show transient function upon stimulation of cognate antigens but acquire functional loss during the progression of chronic infection, including impairment of cytokine production, cytolytic activity, and proliferation. Consistently, in our AAV/HBV infection mouse model we observed a peak of HBs-specific CD8 T cells in the liver and the spleen at week 2 p.i. (early phase
of infection), which became undetectable in later time points. The transient responses against HBV are seldom observed in patients at an early stage of chronic infection. The exhaustion of CD8 T cells was specific to HBV, as the immunization of OVA in AAV/HBV-infected mice generated the same quantity and quality of OVA-specific IFN-γ production from CD8 T cells as compared with that in the control mice.
Interestingly, we observed a higher frequency of HBs-specific CD8 T cells in the liver than in the spleen, which is in line with clinical observations, indicating HBV-specific CD8 T cells are more enriched locally than peripherally (78).
4.3 Dose effect
Clinical studies showed an inverse correlation of viral loads and the antiviral functions of virus-specific CD8 T cells in chronic infections of HIV and HBV (22, 23).
However, due to the complexity of clinical samples it is still elusive that whether high viral loads of HBV are the cause or the consequence of CD8 T cell exhaustion. By manipulating the viral doses used for infection, we demonstrated clearly that higher viral loads led to more severe status of immune dysfunction of HBV-specific CD8 T cells. Therapeutic vaccination restored the production of IFN-γ by HBV-specific CD8 T cells to a greater extent in mice with low viral loads, whose serum antigen levels
reduced approximately 50% (Figure 2). In contrast, the level of HBsAg in mice with high viral load was slightly reduced (15% reduction). It is noteworthy that there is no elevation of ALT detected after vaccination, suggesting a non-cytolytic control could have contributed to the reduction of vial antigen through production of antiviral cytokines, such as IFN-γ, by HBV-specific CD8 T cells (74). Interestingly, Asabe and colleagues demonstrate that HBV persistency and impaired CD8 T cell functions were observed in chimpanzees inoculated with very low viral titers, attributed to the late
priming of CD4 T cells after 100% of hepatocytes are infected (79). Both high-dose and low-dose inocula of HBV cause high viral burdens in infected chimpanzees, as well as poor responses of intrahepatic CD8 T cells. In contrast, the viral loads are lower in chimpanzees infected with intermediate sizes of viral inocula, in which more robust CD8 T cell responses are found in the liver.
In clinical studies of chronic carriers receiving lamivudine treatments for 1 year, restoration of HBV-specific T cell functions can be extensively observed after dramatic decrease of HBV loads, as a result of suppression of viral replication (80, 81). This phenomenon indicates an effect of viral loads on the inhibition of T cell responses.
However, the restoration was only transiently induced and declined 4 months after the starting of treatments, regardless of the sustained viral suppression, suggesting the requirement of other immune stimulations to reinforce and extend the antiviral immunity (82).
4.4 PD-1 expression and other regulatory factors
During persistent infection, exhausted virus-specific CD8 T cells express several inhibitory receptors which generate suppressive signals when ligation with their ligands (4). PD-1, one of the first implicated inhibitory receptors in T cell exhaustion, is highly expressed on virus-specific T cells and recruits SH2-domain containing tyrosine phosphatase 1 (SHP-1) and SHP-2 which inhibit TCR signaling (7). Upregulation of PD-1 is observed on HBV-specific CD8 T cells of chronic carriers and inversely correlated with viral burdens (23, 42, 83). As shown in Figure 3, infection of higher doses of HBV led to not only higher frequencies of PD-1+ CD8 T cells but greater degree of PD-1 expression on each CD8 T cells, suggesting the tolerance of CD8 T cells in the liver was reinforced in the context of higher viral loads (84). The results were
only found in the liver, while the dose-dependent effect of PD-1 expression was absent in the spleen. This is in line with clinical findings that PD-1 expression on
HBV-specific CD8 T cells was higher in the liver than in the periphery (78, 85). The induction of PD-1 on intrahepatic CD8 T cells was not observed in AAV/Empty infected mice, indicating a HBV-dependent mechanism of PD-1 induction rather than an AAV-derived effect. Increased PD-1 expression on CD4 T cells was also observed in a dose-dependent manner (Figure 5), implicating a lack of CD4 T cell help which is necessary for the effector functions of HBV-specific CD8 T cells (40, 79, 86). It is controversial whether frequencies of CD4+CD25+Foxp3+ regulatory T cells (Treg cells) is increased in chronic HBV patients and whether the frequencies of Treg cells is correlated with outcome of HBV infection (87). Accumulation of Treg cells was not detected in this model of infection (data not shown), which is different from another model using AAV vector as chronic model of HBV infection (88).
4.5 Blocking PD-1
Beginning from the first evidence of the therapeutic effect by blocking PD-1 pathway in LCMV model (5), several independent studies demonstrated that the antiviral
functions of virus-specific CD8 T cells from chronic carriers can be restored through the blockade with anti-PD-1 or anti-PD-L1 monoclonal antibodies (6, 23, 89).
Immunotherapy targeting PD-1:PD-L1 interaction has become one of the most promising strategies for rescuing functionally impaired immunity against chronic infections and cancers (15, 90, 91).
The effects of blocking PD-1 pathway on the restoration of HBV-specific T cell functions have been shown in clinical studies (23), as well as in animal models of chronic HBV infection. The proliferation and degranulation of peripheral T cells were