國立臺灣大學管理學院會計學研究所 碩士論文
Department of Accounting College of Management
National Taiwan University Master thesis
虧損公司是否濫行研究發展投資?
Do Loss Firms Abuse R&D Investments?
游上逸 Yu, Shang Yi
指導教授﹕王全三 博士 Advisor: Wang, Chuan-San, Ph.D.
中華民國 101 年 7 月
July, 2012
中文摘要
盈餘虧損頻率與研究發展投資均逐年上升,但虧損與研究發展投資的關係尚未被 完全釐清。本研究以公司行為理論說明虧損公司增加研究發展投資的動機,另以 展望理論分析虧損公司的風險偏好,並分析虧損對研究發展投資決策與此類投資 決策對未來盈餘的影響。研究結果發現,相較於獲利公司,虧損公司有較多的研 究發展投資,與公司行為理論相符。虧損公司的研究發展投資,並隨虧損擴大而 增加,符合展望理論。換言之,展望動機是"虧損所誘發的研究發展投資"的重要 因素。從未來盈餘績效來看,研究結果顯示展望動機所誘發的研究發展投資與未 來盈餘成負向關聯,而高品質的財務報導能減少虧損公司過度投資(研究發展計 劃),進而紓緩因展望動機所誘發的無效率研究發展投資。
關鍵字: 虧損;研究發展投資;公司行為理論;展望理論;展望動機;展望動機所誘 發的研究發展投資
i
Abstract
Both the frequency of negative earnings and R&D investment have been increasing.
However, the relation between these two variables has not been fully explored. This study uses the behavioral theory of firm to explain loss firms' motivation to increase R&D and prospect theory to analyze loss firms' risk attitudes in terms of their R&D decision and the future financial performance of the loss-induced R&D. Results show that negative earnings induce firms to invest more in R&D, consistent with the behavioral theory. Further, R&D investment increases as firms' earnings become more negative, as proposed by the prospect theory. In other words, the prospect incentive is a critical factor of the “loss-induced” R&D. As regarding future operating performance, results indicate that prospect-based R&D is negatively associated with future earnings, and I further find that higher financial reporting quality curbs such unproductive activities by reducing loss firms' overinvestment in R&D.
Keywords: Losses; R&D; Behavioral Theory of Firm; Prospect Theory; Prospect
Incentive; Prospect-Based R&Dii
Index
1. Introduction ... 1
2. Literature review and hypotheses ... 9
2.1 Losses induce R&D ... 10
2.2 Determinants of loss-induced R&D ... 12
2. 3 Future financial performance of loss-induced R&D ... 20
2.4 The role of financial reporting quality ... 21
3. Research Design ... 23
3.1 R&D levels analyses ... 23
3.2 Earnings analyses ... 28
3.3 Further analyses─The role of financial reporting quality ... 30
4. Sample selection and firm characteristics ... 31
4.1 Sample selection ... 31
4.2 Sample characteristics ... 34
5. Results ... 43
5.1 R&D levels analyses ... 43
5.2 Earnings analyses ... 45
5.3 Further analyses ... 47
5.4 Robustness tests ... 47
6. Conclusion ... 48
Reference ... 51
iii
Tables and Figures
Figure 1: The conceptual model of the behavioral theory ... 14
Figure 2: The value function of the prospect theory ... 17
Figure 3: Relation between performance level and probability of change ... 19
Table 1: Descriptive statistics ... 32
Table 2: Pearson (top) and Spearman (bottom) Correlations ... 37
Table 3: R&D levels analyses ... 39
Table 4: Earnings analyses ... 40
Table 5: Further analyses ... 42
iv
1
1. Introduction
Firm value is shifting from tangibles to intangibles with a significant increase
in activities of research and development (R&D) (i.e., Lev and Zarowin, 1999) and
there has been a substantial increase in reported losses (Hayn, 1995; Joos and Plesko,
2005; Skinner and Soltes, 2009). These two variables are highly related. For example,
Joos and Plesko (2005) find that loss firms contain more R&D investments, and Li’s
(2011) untabulated results show that, among these loss firms, R&D are negatively
associated with forecast earnings. Their results raises questions for us: Why do
negative earnings, which imply a low marginal return to capital, encourage rather than
discourage R&D investments? Based on Hayn (1995), who proposes that loss itself
could persist for several years, I wonder whether loss firm’s R&D is an important
factor of loss persistency. That is, do loss firms invest in unproductive R&D? If so,
what factor drives them to do this and how to mitigate such relationship?
Prior research in organization literature has provided behavioral theory (Cyert
and March, 1963, henceforth BT) and prospect theory (Kahneman and Tversky, 1979,
henceforth PT) for us to address our research questions. However, in my viewpoint,
the above two theories are not yet integrated well to an intact theory to explain the
association between loss and R&D, and further, its implication to future earnings. To
illustrate, BT suggests that firms failing to attain a certain level of performance may
2
seek to solve the problem by investing in R&D (in their term, failure-induced R&D,
Chen and Miller, 2007; Chen, 2008), and their tolerance for risk may increase at the
same time; however, the increased risk tolerance influences firms’ behavior on
"high-level decision making" rather than "R&D decision"1. In other words, BT
attributes failure-induced R&D to the problem-solving incentive and excludes the
risk-seeking incentive (in my term, prospect incentive) from R&D decision process.
Respecting PT, except for giving formal proof on risk-seeking behavior when firms
are under a certain performance level (Kahneman and Tversky, 1979), Bowman (1980)
shows that such behavior may trigger undesirable results, i.e., a negative association
between risk and return for firms. However, the above findings of PT have not been
applied to explain the failure-induced R&D. In brief, although both BT and PT
address the problem of firm's decision making, their main interests are different. BT
examines firm's risky change, such as R&D, under different performance level and
excludes the prospect incentive from R&D decision; while PT, rather than examining
firm's R&D activities, it focuses on the relationship of prospect incentive (risk taking
behavior) under different performance level and its subsequent financial results. This
discrepancy restricts researchers under BT to predict the future performance of
failure-induced R&D because it does not attribute such R&D to prospect incentive but
1 To see the detailed explanation, please see section 2.2.
3
to problem-solving incentive, which lacks theoretical support upon the link of future
performance.
As such, I try to bridge this gap by incorporating PT into BT, and therefore
provide in-depth analyses on the following issues. (1) Since my investigation is on
loss-R&D relationship, I first adopt the failure-induced R&D framework suggested by
BT, and consider whether BT can be applied with a simple zero earnings point, which
serves as a reference level for each firm, rather than a complex mixture of both firm
itself and its competitors’ recent and past performance. (2) Whether prospect
incentive acts as an important factor in failure-induced R&D, i.e., BT overlooks the
importance of prospect incentive in R&D decision since it excludes prospect incentive
from R&D decision. (3) Whether a negative association between future earnings and
prospect-based R&D (i.e., the increased R&D which is based on prospect incentive)
exists since PT predicts that firm's prospect incentive (risk taking behavior) under its
reference point (aspiration level) deteriorates future earnings. (4) From the accounting
viewpoint, I wonder whether there exists mechanism to curb such undesirable and
inefficient activity, thereby providing a potential moderator, financial reporting
quality, and testing whether it mitigates firms’ (those with higher prospect incentive)
inclination to overinvest in R&D.
4
I therefore derive the hypotheses corresponding to each issue as follows. First,
I expect BT can be applied with a simple zero earnings point, which serves as an
reference point for management, because accounting literature has confirmed its (zero
earnings point) importance by showing that management inclination to avoid losses
(Graham et al., 2005; Hansen, 2010; Baber et al., 1991; Burgstahler and Dichev, 1997;
Gunny, 2010). Second, I expect that prospect incentive drives firms with big loss to
invest more in R&D compared with those in small losses because R&D is an
investment with high uncertainty (Kothari et al., 2002) and firms tend to adopt
projects with high risk when their losses become larger according to PT. Third, based
on prior research, showing that risk taking behavior under adversity incurs worse
future earnings (Bowman, 1980; Fiegenbaum and Thomas, 1988; Chang and Thomas,
1989; Fiegenbaum, 1990; Jegers, 1991; Sinha, 1994; Gooding et al., 1996; Lehner,
2000), I expect that the prospect-based R&D deteriorates future earnings. Forth,
accounting literature has shown that both losses and R&D activities will increase the
possibility of moral hazard, which in turn deteriorates future accounting performance2.
To illustrate, once firms are in losses, they have great incentive to meet/beat zero
earnings benchmark through manipulating discretionary accruals (e.g., Hansen, 2010)
and real activities (Baber et al., 1991; Burgstahler and Dichev, 1997; Gunny, 2010);
2 To see the detailed demonstration, please see section 2.4.
5
while investments in R&D will exacerbate the degree of information asymmetry
between firms and their shareholders/debtholders (Clinch, 1991; Myers and Majluf,
1984; Aboody and Lev, 2000), which in turn increase the likelihood of moral hazard
in which firms engage (Arrow, 1971; Pauly, 1974; Holmstrom, 1979; Healy and
Palepu, 2001). Moral hazard may thus lead loss firms to engage in unproductive
activities by driving them to overinvest R&D since their inclination to take undue risk
increases. Since high quality financial reporting mitigates moral hazard by facilitating
contracting and monitoring (Kanodia and Lee, 1998; Healy and Palepu, 2001), I
therefore expect that reporting quality curbs unproductive R&D.
Distinct from prior studies, which employs the absolute difference between firm’s ROE and its industry’s contemporaneous median ROE as the measure of firm’s
risk taking behavior (Miller and Bromiley, 1990; Fiegenbaum, 1990; Jegers, 1991;
Sinha, 1994; Gooding et al., 1996), I create a simpler proxy based on the fourfold risk
attitudes proposed by PT to capture firm’s risk taking incentive (prospect incentive).
Measures of other variables are largely consistent with literature.
Based on a sample of 19,788 firm-years from 1993 to 2006, I find that loss
firms increase their R&D spending, implying that zero earnings point serves as an
aspiration level for firms (H1). Further, I find that firms with big loss invest more in
R&D than those in small losses, indicating that prospect incentive (based on fourfold
6
risk attitudes framework) drives loss firms to invest more on R&D (H2). Respecting
the future performance of prospect-based R&D, I find that prospect-based R&D of
loss firms deteriorates future earnings (H3). Further analyses show the effect of
prospect incentive on R&D is less positive for firms with higher quality financial
reporting, providing support for H4. These results hold after addressing the potential
sample selection bias of missing value of R&D excluding those observations instead
of resetting them to zero, and they are robust to using total assets and market
capitalization of common stock to scale R&D (operating income before depreciation,
advertising and R&D expenditures) as an alternative proxy for R&D (earnings). My
evidence highlights the important role of prospect incentive in loss-induced R&D and
thereby deteriorating firms' future earnings.
My study contributes to the literature along the following dimensions. First,
with respect to my research design, I capture firms' prospect incentive by employing
the characteristics of PT’s fourfold risk attitude argument which is different from the
traditional industry median ROE approach, and further, I incorporate it into BT to
explain the loss-induced R&D. By doing this, I show that prospect incentive exists
and does affect loss firm’s R&D decision significantly, indicating that extant research
may put overemphasis on problem-solving incentive, which lacks theoretical support
and is immeasurable, and overlook the importance of prospect incentive when
7
analyzing loss-induced R&D. Introducing prospect incentive into firm’s investment
decision extends the flexibility of the application of BT, i.e., researchers can examine
the investment projects either with high risk or with low risk. To illustrate, since firms
at different performance level may differ in risk preference, researchers can use this
characteristic to predict firms' choice of investment projects, which cannot be
achieved by existing BT framework. I also elaborate prior studies by presenting more
detailed analyses on the R&D-aspiration level relationship with a PT perspective. In
other words, I not only examine the effect of performance below/above the aspiration
level on R&D but also examine whether firm’s R&D investments vary among each
region. Most importantly, my approach provides a framework to understand the
implications of loss-induced R&D on firm’s future accounting performance. To
illustrate, since I emphasize the importance of prospect incentive on loss-induced
R&D, rather than problem-solving incentive, I have a strong theoretical background
(Bowman, 1980; Fiegenbaum and Thomas, 1988; Chang and Thomas, 1989;
Fiegenbaum, 1990; Jegers, 1991; Sinha, 1994; Gooding et al., 1996; Lehner, 2000)3
to predict there is a negative association between loss-induced R&D and future
3 Researchers have found that firms in adversity and with excessive risk taking behavior perform
worse in future. The possible reasons proposed by Fiegenbaum and Thomas (1988) are failed firms' inclination to escalating commitment, less diversified strategy, angency problem and organization inertia.
8
earnings, which cannot be achieved by existing BT framework. Hence, my study
develop a new framework that can explain firms with different risk attitude invest
differently in R&D and therefore lead to different financial results all at once, again,
which cannot be achieved by existing BT framework.
Second, I find a new variable, prospect incentive4, moderating R&D’s future
financial performance. Specifically, I show that as firm's losses become larger, which
is accompanied by raising prospect incentive, R&D activities reduce the positive
association between R&D activities and subsequent accounting performance. That is,
while investments of loss firms can be those firms’ attempt to revert to normal, as
suggested by the abandonment option of Hayn (1995), their R&D expenditures fail to
help them upon such objective. My results supplement Hayn (1995) by showing the
actual performance of loss firms' investments and this more negative association
between loss firms’ R&D activities and subsequent accounting performance is
consistent with Li (2011), who suggests that R&D activities of loss firms is negatively
associated with forecast earnings. My results also extend prior studies (e.g., Lev and
Sougiannis, 1996) that show a positive association between all firms’ R&D
4 I use the interaction of two dummy variables, LOSS and BIG, to capture the prospect incentive since firms' prospect incentive raises as their losses become larger, as per PT. The former is a dummy variable equal to one, if the earnings is negative, and the latter represents that firm's earnings to one-year lagged total assets is above (below) the industry's median value of profit (loss) firms’ earnings to one-year lagged total assets in year t.
9
expenditures and subsequent earnings. It therefore may help investors improve their
prediction on firms’ future performance.
Third, my study adds to a growing empirical literature in accounting that
examines how financial reporting quality affects investments (e.g., Bushman et al.,
2005; Biddle and Hillary, 2006; McNichols and Stubben, 2008; Biddle et al., 2009;
Chen et al., 2011). Distinct from prior studies, which examine the effect of reporting
quality on the efficiency of “total investment” or “capital investment” (e.g., Biddle
and Hillary, 2006; Biddle et al., 2009), my study examines the effect of reporting
quality on the efficiency of “R&D”. To illustrate, my evidence shows that higher
reporting quality alleviate firms’ (those with higher prospect incentive) inclination to
overinvest in R&D, which in turn lead to worse future financial results as Ming-Liang
et al. (2010) suggested.
The rest of the thesis is organized as follows: Section 2 develops the research
questions. The research design is presented in Section 3. Section 4 presents the
sample characteristics. Section 5 presents results, and Section 6 concludes the paper.
2. Literature review and hypotheses
This study addresses the issue of the interplay between loss and R&D activity.
I analyze their relationship by four steps. First, I examine whether loss firms prefer
R&D investments based on behavioral theory of the firm. Second, I examine whether
10
loss-induced R&D is driven by prospect incentive based on prospect theory. Third, I
examine whether prospect incentive on R&D therefore deteriorate future earnings for
loss firms. Forth, I examine whether financial reporting quality will curb unproductive
loss-induced R&D.
2.1 Losses induce R&D
Following Schumpeter (1942), researchers have postulated that absolute
performance is a key determinant of firms’ R&D investment decisions; however, there
is no consensus on the directional effect of performance on R&D.5 The behavioral
theory of the firm (Cyert and March, 1963, hereafter BT) reconciles the conflicting
arguments by providing a theoretical framework that uses relative performance to a
certain level to explain firms’ R&D investment decision. It models a firm as a
goal-directed and history dependent system that utilizes simple rules to guide
decision-making in response to performance feedback. Managers under BT use an
“aspiration level6” to evaluate performance and the performance relative to the
5 Some research find a positive effect of performance on R&D (Cameron et al., 1987; Grabowski, 1968; McKinley, 1993; Nelson and Winter, 1982), but others find a negative effect (e.g., Antonelli, 1989; Bolton, 1993).
6 Aspiration level is defined as "the smallest outcome that would be deemed satisfactory by the decision maker" (Schneider, 1992) and could be seen as a function of recent performance, past performance levels (historical aspiration level), and the recent performance of other firms (social aspiration level). It is used by bounded rational individuals to determine the boundary between success and failure in continuous measures of performance (March and Simon, 1958).
11
aspiration level influences their inclination to take risks and make changes through
R&D (March and Shapira , 1987, 1992; Shapira, 1986). According to BT, firms fail to
attain the aspiration level may seek to solve performance problems by investing in
R&D (Chen and Miller, 2007; Chen, 2008). It is because that managers under
pressure generally believe that upgrading firm’s technology will help to return to its
aspiration level (Greve, 1998, 2003).
Although BT has explained why failure to achieve aspiration level induces
R&D, it still leaves us an unanswered question of whether zero earnings point also
serves as an aspiration level for managers since the organization literature formulate
aspiration level as a function of historical aspiration level and social aspiration level
as mentioned before. My study concerns about zero earnings point because that both
loss and R&D are two important trends in the U.S. economy (Lev and Zarowin, 1999);
however, the association between them remains largely unknown. If zero earnings
point does serve as a reference point (i.e., aspiration level) for managers, it may have
influence on managers’ decision on R&D as BT suggested.
From viewpoint of accounting, I argue that zero earnings point has influence
on firms’ decision making (i.e., it could serve as an aspiration level for managers). To
illustrate, Degeorge et al. (1999) argue that there are three-level earnings benchmarks
for firms, including loss avoidance, earnings improvement, and analysts’ forecasts.
12
Survey done by Graham et al. (2005) further shows that 65% of financial executives
from public companies agree that loss avoidance benchmark is important.7 Although
loss avoidance does not lead the hierarchy among benchmarks (Brown and Caylor,
2005), its importance remains. For example, literature has shown that some managers
try to meet/beat zero earnings benchmark by manipulating firms’ discretionary
accruals (e.g., Hansen, 2010) and real activities (Baber et al., 1991; Burgstahler and
Dichev, 1997; Gunny, 2010).
As such, I hypothesize that zero earnings point can also be used as an
aspiration level for firms, which in turn means that I can apply BT to predict loss
firms’ R&D investment behavior. Accordingly, I examine the following hypothesis:
H1. Zero earnings point serves as an aspiration level for firms. Therefore, loss firms
invest more on R&D according to BT.
2.2 Determinants of loss-induced R&D
Prospect incentive
BT has guided much recent research on risky organizational changes,
including firm’s R&D investment decision. This theory proposes that firms’ R&D
7 This survey presents 84% of financial executives agree that the earnings improvement benchmark is important, and there are 69%, 65% agree that analyst forecast and loss avoidance benchmark is important respectively.
13
investments can be attributed to two types of organizational search, i.e., problemistic
search and slack search. However, since my study focus only on loss-induced R&D, I
put emphasis on problemistic search alone8. When firms fail to attain their aspiration
level, they launch problemistic search which aims to solve the performance problems
immediately. Problemistic search induces increased R&D when managers judge that
upgrading firms’ technology and product portfolio can solve the performance
problems, and this judgment happens universally (Greve, 2003). Once firms’
performance are above their aspiration level, they tend to maintain current routines
and have limited motivation to search for anything new (Cyert and March, 1963;
Levinthal and March, 1981).
However, what is the role of risk preference in the schema of loss-induced
R&D? Although BT suggest that performance under aspiration level will increase
managers’ tolerance for risk, i.e., they are willing to take more risk, because they are
under pressure from stakeholders to return to aspiration as soon as possible, the theory
does not indicate whether risk seeking incentive has any association with loss-induced
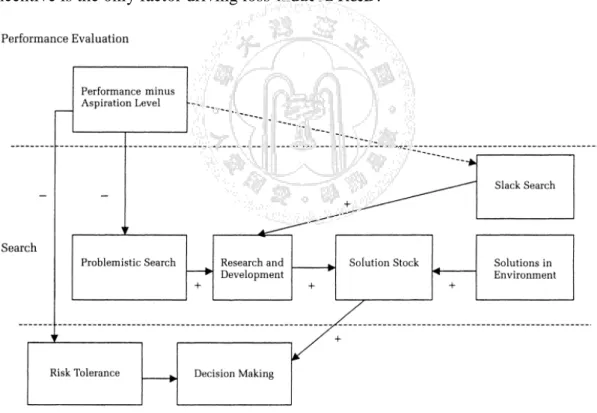
R&D. To illustrate, I refer to Greve’s (2003) conceptual model for BT, shown in
8 Problemistic search is defined as "search that is stimulated by a problem ... and is directed toward
finding a solution to that problem" (Cyert and March, 1963); whereas slack search refers to search that is triggered by firms’ endowment such as underused financial reserves, capacities, facilities and labor (Levinthal and March, 1981). In my study, slack search (firm’s endowment) may be used as a control variable rather than a primary variable.
14
Figure 1. It shows that R&D is driven by two factors, problemistic search and slack
search as mentioned before, and the latter is neutral from the firm’s performance level
unlike the former shows a direct negative association between firm’s relative
performance to its aspiration level and R&D. With respect to risk preference, denoted
as risk tolerance, I can see that it influences firm’s behavior at the later stage,
“decision making”, but not at the earlier “search” stage, which, in my opinion, implies
that risk preference is irrelevant to R&D decision process and the problem-solving
incentive is the only factor driving loss-induced R&D.
Figure 1: The conceptual model of the behavioral theory. Source: Greve (2003).
Except for the previous question I raised on BT, I have two additional
concerns for the argument of problem-solving incentive. First, to my knowledge, the
15
role of problem-solving incentive in the schema of loss-induced R&D is given and
predetermined, that means researchers following BT usually do not test either the
argument of problem-solving incentive is correct or its quantitative impact on R&D or
future earnings. One of the reasons for this problem could be that problem-solving
incentive lacks theoretical support, or at least such theory has not yet been referred,
and it thus makes problem-solving incentive immeasurable compared with the
incentive derived by firm’s endowment (slack search). Second, the lack of theoretical
support for problem-solving incentive limits the scope of research following BT and
yields limited implications for problem-solving incentive. For example, given the
great interest in the future performance of R&D (either earnings or its variability) in
accounting and economic academy, researchers cannot make any prediction on the
future earnings or its variability of loss-induced R&D since there are no theory
examining the association between such incentive and future performance.
I organize the above problems in BT to a simpler representation: the
overemphasis on problem-solving incentive, which can be problematic, lead to
overlooking on risk seeking incentive when analyzing loss-induced R&D. To address
16
this problem, I first introduce Prospect theory (hereafter PT; Kahneman and Tversky,
1979) and incorporate it into BT9 subsequently.
To illustrate, PT distinguishes two phases in the decision process: an early
phase of editing and a subsequent phase of evaluation. In the first phase, once people
receive different prospects (or gambles, investment projects) to choose, they start to
form a reference point, consisting of the factors from past and present related context
of experience10, and then translate each prospect to a simpler representation. In the
second phase, the edited prospects are evaluated and the prospect of highest value is
chosen. Since the value function used by people to evaluate prospects in phase 2 is the
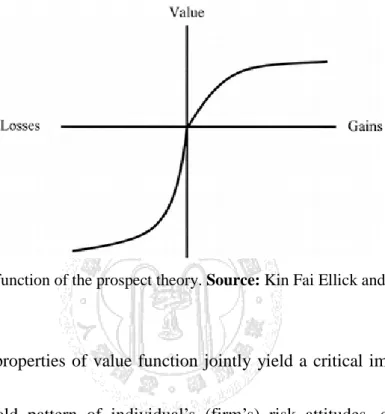
core argument in PT, I show this function in Figure 2 and provide a further
explanation on its key properties as follows. First, it contains a reference point,
derived from phase 1 and separating the outcome of each prospect into gains and
losses region which is perceived by the individual. Simply speaking, reference point is
9 PT is originally developed to explain individual decision making under uncertainty that cannot be explained by expected utility theory (Von Neumann and Morgenstern, 1944); however, it is well documented that PT also works at firm level (e.g., Fiegenbaum and Thomas, 1988; Chang and Thomas, 1989; Miller and Bromiley, 1990; Jegers, 1991; Sinha, 1994; Johnson, 1994; Gooding et al., 1996).
10 In PT, reference point is the status quo or a value of zero (Kahneman and Tversky, 1979) basically;
however, it is also consisted of multiple factors like aspiration level, and there is no general rule for deciding on such a definition. Most researchers assume a common reference point by measuring industry median or mean of returns over the time period (Fiegenbaum and Thomas, 1988; Fiegenbaum, 1990; Miller and Bromiley, 1990; Jegers, 1991; Sinha, 1994; Johnson, 1994).
17
equal to the aspiration level in BT. Second, the carriers of value are changes in wealth,
rather than final states. That is, I can see a given point on the x-axis as “earning 10
dollars”, which shows a certain performance level. Third, the value function is
concave for gains, convex for losses, being steeper for losses than for gains.
Figure 2: The value function of the prospect theory. Source: Kin Fai Ellick and Jessica Y.Y.
(2005).
The above properties of value function jointly yield a critical implication for
my study, a fourfold pattern of individual’s (firm’s) risk attitudes, derived from
twofold risk attitudes. Specifically, firm is risk seeking (averse) when it perceives that
its performance level is in the losses (gains) region, and its risk attitudes keep varying
among each region, i.e., firm in big losses (small gains) is more risk seeking than that
in small losses (big gains). I first explain the reason of twofold risk attitudes by
showing the risk seeking side. When firm fails to attain its aspiration level (reference
point), it falls in the losses region and the discrepancy (between its performance and
reference point) will persists until firm adapts to this downward shock. It
18
consequently induces two results. First, the perceived losses situation will affect
firm’s way to code the prospect11, which in turn leads firm to adopt riskier prospect.
Second, since the marginal benefit (in terms of individual’s psychological value) at
any given point of the value function always outperforms marginal cost in losses
region, firm has strong incentive to increase their performance by taking riskier
prospect. To further explain fourfold risk attitudes, I refer to the value function’s
convex and concave characteristics. When firm falls in the region of big loss, taking
more risk incurs little, close to zero, marginal losses (in terms of individual’s
psychological value), therefore, firm in big losses is more likely to adopt risky
prospect than firm in small losses. As for firm in big gains region, taking more risk
incurs little, close to zero, marginal gains (in terms of individual’s psychological
value), therefore, firm in big gains is less likely to adopt risky prospect than firm in
small gains.
Supporting fourfold risk attitudes, Greve’s empirical studies (1998, 2003b,
2003c), which is based on US radio industry, Japanese shipbuilding industry and
cross-section data respectively, show a kinked curve which illustrates that the
relationship between firm performance and the probability of strategy (risky) change
has a tipping point at the aspiration level (as shown in Figure 3, from Greve (1998)).
11 To see a complete example, please check Kahneman and Tversky (1979), p.286.
19
This downward sloping curve shows that firms at different performance level do risky
changes, defined as format change, facility and innovation investment respectively,
different in magnitude. Specifically, firms in losses take more risk than those in gains,
and among each region, firms in big losses (small gains) take more risk than those in
small losses (big gains). His proxy for risky change is very similar with R&D, of my
main interest, since R&D is also an investment with high risk (Kothari et al., 2002).
Hence, based on fourfold risk attitudes framework and Greve’s empirical evidence, I
hypothesize that firms with increased risk seeking incentive (in my term, prospect
incentive) invest more in R&D. Such hypothesis thus incorporates PT into BT
automatically since it extends the twofold risk attitudes assumption. My hypothesis is
as follows:
H2. Prospect incentive (based on fourfold risk attitudes framework) drives loss firms
to invest more on R&D.
20
Figure 3: Relation between performance level and probability of change. Source: Greve (1998).
2.3 Future financial performance of loss-induced R&D
Though R&D investments do benefit firms on average according to a variety
of literature no matter from accounting perspective or economic perspective (e.g., Lev
and Sougiannis, 1996; Eberhart et al., 2004; Lev et al., 2006; Long and Ravenscraft,
1993; Vivero, 2002; Branch, 1974; Tassey, 1983; Morbey and Reithner, 1990;
Doukas, 1991; Erickson and Jacobson, 1992; Ito and Pucik, 1993; Johnson and
Pazderka, 1993; Lee and Shim, 1995), when I look specifically at loss firms, situation
seems change. Accounting literature has shown some clues, for example, based on
Hayn (1995), proposing that loss itself could persist for several years, Joos and Plesko
(2004) further shows that persistent loss firms have more R&D. The association
between loss and R&D is tested informally until Li (2011) showing that R&D is
negatively associated with forecast earnings.
Based on my H2, I further argue that prospect incentive may lead loss firms to
invest in unproductive R&D, i.e., it has negative impact on future earnings, according
to PT. Under PT’s assumptions, loss firms will choose investment projects with high
risk (e.g. R&D, Kothari et al., 2002) to bet on the probability of reversing from losses
rapidly. In other words, they care variance in returns more than expected returns.
Research following PT has found that firms with unbalanced risk-return preference
21
presented above, i.e., prospect incentive, perform worse in future. For example,
following Bowman’s finding (1980) which shows a negative association between
organizational risk and future return, researchers (Fiegenbaum and Thomas, 1988;
Chang and Thomas, 1989; Fiegenbaum, 1990; Jegers, 1991; Sinha, 1994; Gooding et
al., 1996; Lehner, 2000) further extend that firms below (above) the reference point
exhibited a negative (positive) relationship between risk and future return.
Accordingly, I infer that prospect incentive on R&D may have negative impact on
future earnings. My hypothesis is as follows:
H3. Prospect (incentive)-based R&D of loss firms has negative impact on future
earnings.
2.4 The role of financial reporting quality
Based on H2 and H3, hypothesizing that prospect incentive drives loss firms
to invest more in R&D and thus deteriorates future earnings, I subsequently consider
whether there exists mechanism to curb such undesirable and inefficient activity. To
address this problem, I first presume that moral hazard induces such unproductive
activities based on prior research (Jensen and Merckling, 1976; Jensen, 1986), stating
that managers may undertake suboptimal investments that maximize their own
benefits at the expense of shareholders, and then examine the following two factors in
my study that leads to moral hazard. First, losses increase the likelihood of moral
22
hazard in which firms engage. For example, management may initiate an audit firm
change in an attempt to suppress or delay the release of unfavorable information
(Kluger and Shields, 1991) or manipulate firms’ discretionary accruals (e.g., Hansen,
2010) and real activities (Baber et al., 1991; Burgstahler and Dichev, 1997; Gunny,
2010) to meet/beat zero earnings benchmark. Second, investments in R&D exacerbate
the degree of information asymmetry between firms and their
shareholders/debtholders (Clinch, 1991; Myers and Majluf, 1984; Aboody and Lev,
2000), which in turn increase the likelihood of moral hazard in which firms engage
(Arrow, 1971; Pauly, 1974; Holmstrom, 1979; Healy and Palepu, 2001). Moral hazard
may thus lead loss firms to engage in unproductive activities by driving them to
overinvest R&D since their inclination to take undue risk increases. To illustrate,
Ming-Liang et al. (2010) shows that there is an inverted-U correlation between R&D
intensity and firm performance, indicating that R&D overinvestments do harms future
earnings.
To address the problem of moral hazard presented above, I introduce financial
reporting quality. Since high quality financial reporting conveys more precise
information about the future cash flows of firms’ investment projects, facilitates
efficient contracting, and improves investors' ability to monitor managers’ investment
23
decisions thus mitigates the information asymmetry and moral hazard (Kanodia and
Lee, 1998; Healy and Palepu, 2001), I have the following hypothesis:
H4. Reporting quality curbs unproductive R&D activities of loss firms.
3. Research design
3.1 R&D levels analyses
I investigate H1 concerning how the level of R&D varies with reporting losses
by estimating the following pooled cross-sectional regressions:
𝑅𝑅𝑅𝑅𝑅𝑅𝑖𝑖𝑖𝑖 = 𝛽𝛽0+ 𝛽𝛽1𝐿𝐿𝐿𝐿𝐿𝐿𝐿𝐿𝑖𝑖𝑖𝑖 + 𝛽𝛽2𝑍𝑍 𝐿𝐿𝑆𝑆𝐿𝐿𝑅𝑅𝑅𝑅𝑖𝑖𝑖𝑖−1+ 𝛽𝛽3𝑇𝑇𝑇𝑇𝑇𝑇𝑇𝑇𝑖𝑖𝑖𝑖−1+ 𝛽𝛽4𝑅𝑅𝑅𝑅𝑅𝑅𝑖𝑖𝑖𝑖−1+ 𝛽𝛽5𝑇𝑇𝐿𝐿𝑇𝑇𝑇𝑇𝑇𝑇𝑇𝑇𝑖𝑖𝑖𝑖−1+ 𝛽𝛽6𝐿𝐿𝑅𝑅𝐿𝐿𝑖𝑖𝑖𝑖−1+ 𝛽𝛽7𝐿𝐿𝑆𝑆𝑂𝑂𝑖𝑖𝑖𝑖 + 𝛽𝛽8𝐿𝐿𝑇𝑇𝑍𝑍𝑅𝑅𝑖𝑖𝑖𝑖−1+
𝑇𝑇𝐼𝐼𝐼𝐼𝐼𝐼𝐼𝐼𝑖𝑖𝐼𝐼𝐼𝐼 & 𝑌𝑌𝑌𝑌𝑌𝑌𝐼𝐼 𝑇𝑇𝐼𝐼𝐼𝐼𝑖𝑖𝐼𝐼𝑌𝑌𝑖𝑖𝐼𝐼𝐼𝐼𝐼𝐼 + 𝜀𝜀𝑖𝑖𝑖𝑖 (1)
where
RDE
is R&D expense (XRD from Compustat) to sales revenue (SALE from Compustat) in year t. For firms with zero or missing R&D expenditures, RDE equals 0.LOSS
is a dummy variable equal to one, if the sum of income before interest and tax (EBIT) and the lagged R&D (abbreviated as earnings, hereafter) is negative in year t, and zero otherwise.Z SCORE
I use Altman’s (1983) Z, which is defined as (1.2 × (ACT – LCT) + 1.4 × RE + 3.3 × EBIT + SALE) / AT + 0.6 × (CSHO × PRCC_F / LT) of firm i at the end of year t-1.TANG
is the net book value of property plant and equipment (PPENT from Compustat), scaled by total assets (AT from Compustat) of firm i at the end of year t-1.TOBINQ
is the ratio of market value of total assets (PRCC_F × CSHO + AT – CEQ – TXDB) to book value of total assets (AT) of firm i at the end of year t-1.LEV
is the ratio of long-term debt (DLTT from Compustat) to the sum of long-term debt plus the market value of equity (DLTT + CSHPRI ×24
PRCC_F) of firm i at the end of year t-1.
OCF
is net cash flow from operating activities (OANCF from Compustat) divided by sales revenue in year t.SIZE
is the natural logarithm of total assets of firm i at the end of year t-1.Industry indicators are created using 48-industry groups by Fama and French (1997).
My H1 argues that BT could be applied with a simple zero earnings, rather
than a mixture historical and social aspiration level, thus I expect that firms increase
their R&D spending as they fall to into losses. As such, the term LOSS is of primary
interest in my analysis. Its coefficient reflects how the level of R&D varies with
reporting loss. If zero earnings point does serve as an aspiration for management (H1),
then the coefficient of LOSS should be positive in Eq. (1).
I expect a negative coefficient on Z SCORE according to the ‘threat-rigidity’
hypothesis (Staw et al., 1981). This hypothesis states that stress and anxiety under
threatening situation will disable management to launch new activities, conserve
resources, and seek to keep existing production activities lean (March and Shapira,
1987, 1992; Ketchen and Palmer, 1999). I also expect a negative coefficient on TANG
since firms with a high level of investment in physical capital face more financial
constraints (Aghion et al., 2004; Hsiao and Tahmiscioglu, 1997; Fazzari et al., 1988),
which in turn affects their ability to invest in R&D. Following Lev and Sougiannis
(1996) and Dunlap-Hinkler et al. (2007), I expect a positive coefficient on lagged
R&D since strong returns on R&D would encourage future R&D investment. I also
25
expect a positive coefficient on lagged TOBINQ, as (Lach and Schankerman, 1989;
Bhagat and Welch, 1995) document that an increase in R&D might help firm take
advantage of growth opportunities. As for the financing aspect of firms, I include
LEV and OCF as control variables. I expect a negative coefficient on LEV and a
positive coefficient on OCF since R&D activity involves severe information
asymmetry, moral hazard risk and transaction cost of negotiation between managers
and outsiders, which in turn leads outsiders’ reluctance to finance firm’s R&D project
(Smith and Warner, 1979; Williamson, 1988) and firm’s heavy reliance on internal
financing (Myers and Majluf, 1984). I control SIZE but have no expectation for its
coefficient because a variety of researchers have stressed its importance on R&D;
however, there is no consensus on its directional effect.12 Finally, to ensure that my
results are not driven by differences across industries, I include an indicator variable
for each of the Fama and French (1997) industries in my all equations.
I investigate H2 concerning how the level of R&D varies with prospect
incentive by estimating the following pooled cross-sectional regression:
𝑅𝑅𝑅𝑅𝑅𝑅𝑖𝑖𝑖𝑖 = 𝛽𝛽0+ 𝛽𝛽1𝑇𝑇𝑇𝑇𝑇𝑇𝑖𝑖𝑖𝑖 + 𝛽𝛽2𝑇𝑇𝑇𝑇𝑇𝑇𝑖𝑖𝑖𝑖𝑖𝑖 × 𝐿𝐿𝐿𝐿𝐿𝐿𝐿𝐿𝑖𝑖𝑖𝑖 + 𝛽𝛽3𝐿𝐿𝐿𝐿𝐿𝐿𝐿𝐿𝑖𝑖𝑖𝑖 + 𝛽𝛽4𝑍𝑍 𝐿𝐿𝑆𝑆𝐿𝐿𝑅𝑅𝑅𝑅𝑖𝑖𝑖𝑖−1+ 𝛽𝛽5𝑇𝑇𝑇𝑇𝑇𝑇𝑇𝑇𝑖𝑖𝑖𝑖−1 +𝛽𝛽6𝑅𝑅𝑅𝑅𝑅𝑅𝑖𝑖𝑖𝑖−1+ 𝛽𝛽7𝑇𝑇𝐿𝐿𝑇𝑇𝑇𝑇𝑇𝑇𝑇𝑇𝑖𝑖𝑖𝑖−1+ 𝛽𝛽8𝐿𝐿𝑅𝑅𝐿𝐿𝑖𝑖𝑖𝑖−1+ 𝛽𝛽9𝐿𝐿𝑆𝑆𝑂𝑂𝑖𝑖𝑖𝑖 + 𝛽𝛽10𝐿𝐿𝑇𝑇𝑍𝑍𝑅𝑅𝑖𝑖𝑖𝑖−1+
𝑇𝑇𝐼𝐼𝐼𝐼𝐼𝐼𝐼𝐼𝑖𝑖𝐼𝐼𝐼𝐼 & 𝑌𝑌𝑌𝑌𝑌𝑌𝐼𝐼 𝑇𝑇𝐼𝐼𝐼𝐼𝑖𝑖𝐼𝐼𝑌𝑌𝑖𝑖𝐼𝐼𝐼𝐼𝐼𝐼 + 𝜀𝜀𝑖𝑖𝑖𝑖 (2)
12 Some research suggests a linear and positive relationship (Schumpeter, 1942; Cohen and Levin, 1989); whereas others suggest that R&D and firm size are independent (e.g., Lee and Sung, 2005) or even inverse (Holmström, 1989; Cohen and Klepper, 1996).
26
Where
BIG
is a dummy variable equal to one, if the earnings to one-year lagged total assets is above (below) the median value of profit (loss) firms’ earnings to one-year lagged total assets in year t and industry j, and zero otherwise.Researchers under the organization stream usually use the absolute difference
between firm’s ROE and its industry’s contemporaneous median ROE as the measure
of firm’s risk taking behavior (Miller and Bromiley, 1990; Fiegenbaum, 1990; Jegers,
1991; Sinha, 1994; Gooding et al., 1996). However, since my hypothesized reference
point (aspiration level) is zero earnings point, which is different from traditional
organization studies using a mixture of historical aspiration and social aspiration, I do
not follow this approach in my study in case it complicates my research design
accompanied by the confusing results.
As such, I create a simpler proxy based on the fourfold risk attitudes proposed
by PT rather than ROE approach to capture firm’s risk taking incentive (prospect
incentive). To illustrate, I presume the prospect incentive of firm increases as firm’s
earnings shift from small loss (big profit) to big loss (small profit), as per PT which is
already explained in section 2, thereby adding the dummy variable, BIG, and interact
it with LOSS to form four-region performance levels enabling us to capture the
prospect incentive. My approach yields four advantages. First, unlike problem-solving
incentive, lacking a formal theoretical support or at least lacking a clear reference in
27
the stream of BT, prospect incentive is clearly based on PT and its reference is also
clearly shown in the empirical studies following BT. Second, based on the first one,
the measurability of prospect incentive is better than problem-solving incentive
accordingly. Specifically, PT gives us a clear indication that prospect incentive varies
with firm’s performance; however, no theory, to my knowledge, proposes that
problem-solving incentive performs the same way. I therefore assume that
problem-solving incentive holds constant or at least varies relatively small to firm’s
performance in contrast with prospect incentive, making my proxy, BIG, works to
capture prospect incentive and differentiate it from problem-solving incentive. Third,
BT proposes that problem-solving incentive rises as firm performs worse than its
aspiration level; however, it does not propose that firm performing better than its
aspiration level does the same way. My proxy, BIG, thus will not be confounded by
the factor of problem-solving incentive based on BT, i.e., it is purer for 𝛽𝛽1 than (𝛽𝛽1+𝛽𝛽2) when measuring prospect incentive. Forth, interacting these two indicator
variables expands traditional ROE approach by enabling the multiple comparisons
among four groups. To sum up, I expect a negative sign on 𝛽𝛽1 and a positive sign on (𝛽𝛽1+𝛽𝛽2), since I hypothesize that the high-risk feature of R&D (Kothari et al., 2002)
fits the needs of the firm with prospect incentive. Given my study is focus on loss
firms, the sign of (𝛽𝛽1+𝛽𝛽2), would be of my primary interest.
28
3.2 Earnings analyses
I further test H3 concerning how prospect incentive on R&D influences future
earnings by estimating the following pooled cross-sectional regression:
𝑅𝑅𝑇𝑇𝑅𝑅𝑇𝑇5𝑖𝑖𝑖𝑖 = 𝛽𝛽0+ 𝛽𝛽1𝑇𝑇𝑇𝑇𝑇𝑇𝑖𝑖𝑖𝑖 + 𝛽𝛽2𝐿𝐿𝐿𝐿𝐿𝐿𝐿𝐿𝑖𝑖𝑖𝑖 + 𝛽𝛽3𝑅𝑅𝑅𝑅𝑅𝑅𝑖𝑖𝑖𝑖 + 𝛽𝛽4𝑇𝑇𝑇𝑇𝑇𝑇𝑖𝑖𝑖𝑖 × 𝐿𝐿𝐿𝐿𝐿𝐿𝐿𝐿𝑖𝑖𝑖𝑖 + 𝛽𝛽5𝑇𝑇𝑇𝑇𝑇𝑇𝑖𝑖𝑖𝑖 × 𝑅𝑅𝑅𝑅𝑅𝑅𝑖𝑖𝑖𝑖 + 𝛽𝛽6𝐿𝐿𝐿𝐿𝐿𝐿𝐿𝐿𝑖𝑖𝑖𝑖 × 𝑅𝑅𝑅𝑅𝑅𝑅𝑖𝑖𝑖𝑖 + 𝛽𝛽7𝑇𝑇𝑇𝑇𝑇𝑇𝑖𝑖𝑖𝑖 × 𝐿𝐿𝐿𝐿𝐿𝐿𝐿𝐿𝑖𝑖𝑖𝑖 × 𝑅𝑅𝑅𝑅𝑅𝑅𝑖𝑖𝑖𝑖 + 𝛽𝛽8𝐿𝐿𝑇𝑇𝑍𝑍𝑅𝑅𝑖𝑖𝑖𝑖 + 𝛽𝛽9𝑇𝑇𝐵𝐵𝑖𝑖𝑖𝑖 + 𝛽𝛽10𝑇𝑇𝑇𝑇𝑇𝑇𝑇𝑇𝑖𝑖𝑖𝑖−1+ 𝛽𝛽11𝑇𝑇𝑅𝑅𝑅𝑅𝐴𝐴𝑖𝑖𝑖𝑖 +
𝑇𝑇𝐼𝐼𝐼𝐼𝐼𝐼𝐼𝐼𝑖𝑖𝐼𝐼𝐼𝐼 & 𝑌𝑌𝑌𝑌𝑌𝑌𝐼𝐼 𝑇𝑇𝐼𝐼𝐼𝐼𝑖𝑖𝐼𝐼𝑌𝑌𝑖𝑖𝐼𝐼𝐼𝐼𝐼𝐼 + 𝜀𝜀𝑖𝑖𝑖𝑖 (3)
Where
EARN5
is the average earnings over five subsequent years from t+1 to t+5 divided by sales revenue in year t. I use income before interest and tax (EBIT) plus R&D expenditures (XRD) for earnings.BM
is the stockholders’ equity (SEQ from Compustat) divided by market value of equity (CSHPRI times PRCC_F from Compustat).ADEX
is advertising expenditures (XAD from Compustat) to sales ratio. For firms with zero or missing advertising expenditures, ADEX equals 0.I follow the model used by Ciftci and Cready (2011) to reduce the complexity
of R&D’s long-lived effect on subsequent earnings. This approach simplifies the
procedure required to estimate and aggregate multiple R&D terms and R&D
interaction terms as well as the associated standard errors, therefore provides a
parsimonious estimate of the marginal explanatory impact of prospect incentive on
the R&D relation. To address the potential disadvantage stems from the
windows-overlapping feature of average earnings, I conduct a supplemental analysis
to Eq. (3) and (5) in which I replace RDE with RDC (i.e., R&D capital), which is a
weighted average of past R&D investment numbers as per Lev and Sougiannis (1996).
29
To calculate RDC, I assume 20% amortization rate. I also follow Ciftci and Cready
(2011) to use one year ahead earnings (i.e., EARN1) as an alternative to EARN5.
I follow Fama and French (1995) to include book-to-market ratio (BM) and
size (SIZE) as control variables, as they suggest a negative coefficient for the former
and a positive coefficient for the latter. I also follow Lev and Sougiannis (1996) to
include advertising expenditures (ADEX) and tangible assets (TANG) as control
variables and expect them with positive coefficient.
I expect a negative sign on (𝛽𝛽1+𝛽𝛽4) since Bowman (1980) has shown a
negative association between organizational risk and future return when firms are in
loss. While I expect a positive sign on 𝛽𝛽3, as Lev and Sougiannis (1996) document
that current earnings is positively related to past R&D which implicitly indicate that
current R&D benefits future earnings. My control variables include SIZE, BM, ADEX
and TANG as per Fama and French (1995) and Lev and Sougiannis (1996). The
prediction on the coefficients of above control variables are mentioned in prior
paragraph. The sign of (𝛽𝛽1+𝛽𝛽4+𝛽𝛽5+𝛽𝛽7) is of primary interest in my analysis. It
reflects how the association between R&D intensity and the level of future earnings
varies with loss firms’ prospect incentive. Simply speaking, the sum of the coefficient 𝛽𝛽1, 𝛽𝛽4, 𝛽𝛽5 and 𝛽𝛽7 shows the incremental R&D intensity switched from firms in the
sample of small loss to big loss, and I presume that such R&D is driven largely by
30
prospect incentive (prospect-based R&D) rather than problem-solving incentive as
mentioned before. If prospect incentive decreases payoffs to R&D investment (H3),
then the sign of (𝛽𝛽1+𝛽𝛽4+𝛽𝛽5+𝛽𝛽7) should be negative.
3.3 Further analyses─The role of financial reporting quality
To examine how financial reporting quality (RQ) curbs the unproductive R&D
activities of loss firms (H4), I finally estimate the following regression model:
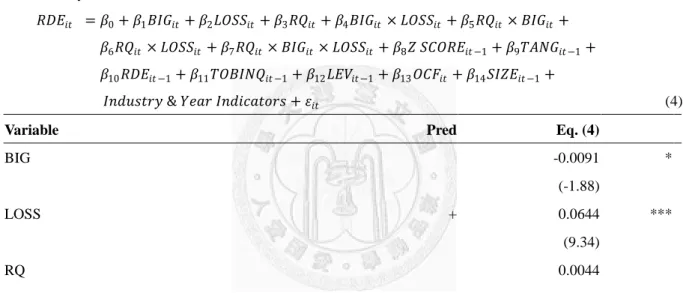
𝑅𝑅𝑅𝑅𝑅𝑅𝑖𝑖𝑖𝑖 = 𝛽𝛽0 + 𝛽𝛽1𝑇𝑇𝑇𝑇𝑇𝑇𝑖𝑖𝑖𝑖 + 𝛽𝛽2𝐿𝐿𝐿𝐿𝐿𝐿𝐿𝐿𝑖𝑖𝑖𝑖 + 𝛽𝛽3𝑅𝑅𝑇𝑇𝑖𝑖𝑖𝑖 + 𝛽𝛽4𝑇𝑇𝑇𝑇𝑇𝑇𝑖𝑖𝑖𝑖× 𝐿𝐿𝐿𝐿𝐿𝐿𝐿𝐿𝑖𝑖𝑖𝑖 + 𝛽𝛽5𝑅𝑅𝑇𝑇𝑖𝑖𝑖𝑖 × 𝑇𝑇𝑇𝑇𝑇𝑇𝑖𝑖𝑖𝑖 + 𝛽𝛽6𝑅𝑅𝑇𝑇𝑖𝑖𝑖𝑖 × 𝐿𝐿𝐿𝐿𝐿𝐿𝐿𝐿𝑖𝑖𝑖𝑖 + 𝛽𝛽7𝑅𝑅𝑇𝑇𝑖𝑖𝑖𝑖 × 𝑇𝑇𝑇𝑇𝑇𝑇𝑖𝑖𝑖𝑖 × 𝐿𝐿𝐿𝐿𝐿𝐿𝐿𝐿𝑖𝑖𝑖𝑖 +
𝛽𝛽8𝑍𝑍 𝐿𝐿𝑆𝑆𝐿𝐿𝑅𝑅𝑅𝑅𝑖𝑖𝑖𝑖−1+ 𝛽𝛽9𝑇𝑇𝑇𝑇𝑇𝑇𝑇𝑇𝑖𝑖𝑖𝑖−1+ 𝛽𝛽10𝑅𝑅𝑅𝑅𝑅𝑅𝑖𝑖𝑖𝑖−1+ 𝛽𝛽11𝑇𝑇𝐿𝐿𝑇𝑇𝑇𝑇𝑇𝑇𝑇𝑇𝑖𝑖𝑖𝑖−1+ 𝛽𝛽12𝐿𝐿𝑅𝑅𝐿𝐿𝑖𝑖𝑖𝑖−1+ 𝛽𝛽13𝐿𝐿𝑆𝑆𝑂𝑂𝑖𝑖𝑖𝑖 + 𝛽𝛽14𝐿𝐿𝑇𝑇𝑍𝑍𝑅𝑅𝑖𝑖𝑖𝑖−1+
𝑇𝑇𝐼𝐼𝐼𝐼𝐼𝐼𝐼𝐼𝑖𝑖𝐼𝐼𝐼𝐼 & 𝑌𝑌𝑌𝑌𝑌𝑌𝐼𝐼 𝑇𝑇𝐼𝐼𝐼𝐼𝑖𝑖𝐼𝐼𝑌𝑌𝑖𝑖𝐼𝐼𝐼𝐼𝐼𝐼 + 𝜀𝜀𝑖𝑖𝑖𝑖 (4)
Where
RQ
I use the negative value of the standard deviation of regression residuals from the modified Dechow and Dichev (2002) model by McNichols (2002). I follow Francis et al. (2005) and estimate the model cross-sectionally for each industry (defined using Fama and French (1997) industry classification) and year. I require a minimum of 20 observations for each industry-year. I take the negative value of the standard deviation so that higher RQ indicates higher reporting quality.Based on the assumption that moral hazard deteriorates future earnings by
driving loss firms to overinvest R&D, i.e., take undue risk, I adopt the measure of RQ,
which is capable of mitigating moral hazard problem and has been used by several
studies (e.g., Aboody et al., 2005; Francis et al., 2004, 2005; Biddle et al., 2009), and
interact it with the main variable in Eq. (2) to derive Eq. (4). If reporting quality does
31
works to mitigate moral hazard, it would be reasonable to see loss firms alleviate their
R&D spending.
I applied Eq. (4), rather than traditional expected-level approach (e.g., Biddle
et al., 2009), to test whether firms with big loss overinvest in R&D because it
simplifies my research design in sacrifice of limited validity. To illustrate, since it is
conceivable that moral hazard problem increases as firms’ losses become larger; I use
a different way to interpret variables capturing the shift from small loss to big loss and
redefine it as a measure of moral hazard problem. Therefore, (𝛽𝛽1+𝛽𝛽4) represents the
magnitude of moral hazard-induced R&D. Given the fact that moral hazard is a
critical driver of overinvestment of R&D as mentioned in section 2.4; I use a
parsimonious way to measure the overinvested part of R&D: the magnitude of (𝛽𝛽1+𝛽𝛽4). As such, a negative sign on (𝛽𝛽5+𝛽𝛽7) would provide support for my H4,
indicating that the magnitude of overinvested R&D decreases for firms with higher
financial reporting quality than for firms with lower financial reporting quality. In
other words, a negative sign for (𝛽𝛽5+𝛽𝛽7) would be consistent with higher financial
reporting quality mitigating the overinvestment in R&D.
4. Sample selection and firm characteristics
4.1. Sample selection
I start my sample selection by retaining all firm-years with listed common
32
stock in the Compustat annual file over years 1993 to 2006. My sample period starts
from 1993 because it is the first year data from the statement of cash flows are
available to compute my reporting quality (RQ) measure at the beginning of the
year.13 Following prior literature (e.g., Richardson, 2006; Biddle and Hillary, 2006) I
exclude financial and utility firms (SIC codes 6000-6999; 4900-4949). After I remove
firm-years with insufficient data to measure my test and control variables, my final
sample consists of 19,788 firm-years over 1993 to 2006. In my robustness tests, I
further reduce my sample to 11,781 observations to examine specifically at “R&D
firms” as suggested by Ciftci and Cready (2011) by excluding firms with missing
R&D expenditure instead of setting them to zero. Additionally, my dependent variable,
EARN5,calculated over five subsequent years (i.e., from years t+1 to t+5), restricts
my analyses to ends with fiscal 2006 independent variables.
Table 1
Descriptive statistics.
N Mean Med Std Dev
RDE 19,788 0.1185 0.0011 0.5123
RDC 19,788 0.3337 0.0077 1.3923
LOSS 19,788 0.1633 0.0000 0.3697
BIG 19,788 0.4835 0.0000 0.4997
13 Since SFAS 95 requires companies to report cash flow from operations (CFO) in the statement of cash flows from 1988, we can compute unexpected working capital starting from year 1989. Since we need past five years of working capital (and other variables) to compute reporting quality (RQ), the first year with the beginning-of-year value of RQ is 1994.
33
Z SCORE 19,788 5.1597 3.6694 6.5631
TANG 19,788 0.3224 0.2512 0.2609
RDE_1 19,788 0.1141 0.0010 0.4811
TOBINQ 19,788 1.9526 1.4389 1.5465
LEV 19,788 0.1622 0.0852 0.1949
OCF 19,788 -0.0329 0.0695 0.7006
SIZE 19,788 5.1957 5.1634 2.1665
BM 19,788 0.6834 0.5148 0.5934
ADEX 19,788 0.0085 0.0000 0.0224
EARN5 19,788 -0.1062 0.1023 31.2143
EARN1 19,788 -0.2788 0.0912 13.4082
RQ 19,788 -0.1269 -0.0758 0.2279
This table reports descriptive statistics (Panel A) and correlations (Panel B) for the main and control variables in my all equations. The sample contains 19,788 firm-year observations over 1993-2006. R&D is either RDE or RDC. The former is the R&D expense (XRD from Compustat) to sales revenue (SALE from Compustat) in year t, the latter is R&D capital to sales ratio. R&D capital is calculated assuming 20% amortization rate. For firms with zero or missing R&D expenditures, RDE (RDC) equals 0. LOSS is a dummy variable equal to 1, if the sum of income before interest and tax (EBIT from Compustat) and the lagged R&D is negative in year t, and 0 otherwise. BIG is a dummy variable equal to one, if the earnings to one-year lagged total assets is above (below) the median value of profit (loss) firms’
earnings to one-year lagged total assets in year t and industry j, and zero otherwise. Z SCORE is bankruptcy risk as in Altman’s Z-score of firm i at the end of year t-1. TANG is the net book value of property plant and equipment (PPENT from Compustat), scaled by total assets (AT from Compustat) of firm i at the end of year t-1. RDE_1 is R&D expense (XRD from Compustat) to sales revenue (SALE from Compustat) in year t-1. TOBINQ is the ratio of the market value to the book value of total assets of firm i at the end of year t-1. LEV is the ratio of long-term debt (DLTT from Compustat) to the sum of long-term debt plus the market value of equity (DLTT + CSHPRI × PRCC_F) of firm i at the end of year t-1. OCF is net cash flow from operating activities (OANCF from Compustat) divided by sales revenue in year t. SIZE is the natural logarithm of total assets of firm i at the end of year t-1. BM is calculated as stockholders’ equity (SEQ from Compustat) divided by market value of equity (CSHPRI × PRCC_F from Compustat). ADEX is advertising expenditures (XAD from Compustat) to sales ratio. For firms with zero or missing advertising expenditures, ADEX equals 0. EARN5 is the average earnings (EBIT + XRD) over five subsequent years from t+1 to t+5 divided by sales revenue in year t. EARN1 is the earnings before interest, tax and R&D in year t+1 divided by sales revenue in year t. If a firm is delisted in any of the years t+1 to t+5, EARN5 or EARN1 is set to the mean value in the firm’s Altman Z-score decile portfolio. RQ is financial reporting quality derived by Dechow and Dichev (2002) and modified by Mc Nichols (2002) of firm i at the end of year t-1.
34
4.2. Sample characteristics
Among the 140,378 observations, I find that 23,573 (16.79%) observations
have LOSS=1, as their annual income before interest and tax (EBIT) and the lagged
R&D is negative. The remaining 116,805 observations have LOSS=0, because their
EBIT and the lagged R&D is positive.14 Normal management in the final sample
accepts positive net present-value opportunities since doing so is irrelevant to the
predicted sign of reported income. Table 1 reports descriptive statistics for the sample.
To mitigate the influence of potential outliers, I winsorize all continuous variables at
the 1% and 99% levels. Respecting my dependent variables, the mean and median
values of RDE are 0.12 and 0 respectively, while RDC are 0.33 and 0.01 respectively.
The mean and median of EARN5 are -0.11 and 0.10 respectively, while EARN1 are
-0.28 and 0.09. Respecting my primary independent variables, the mean and median
values of LOSS dummy are 0.16 and 0 respectively, implying that losses are relatively
infrequent and transient as per Hayn (1995). As mentioned earlier, I create a dummy
variable, BIG, and incorporate it with LOSS to capture firms’ risk seeking incentive
instead of traditional median ROE approach (e.g., Miller and Bromiley, 1990;
14 To avoid biases favor my hypotheses, I discard 6,983 observations. These observations have
positive income before tax and the lagged R&D but their income becomes negative once the lagged R&D expenditures are deducted from the income. Baber et al. (1991) show that management in these observations tend to reject some positive net present value opportunities since doing so yields positive income.
35
Fiegenbaum, 1990; Jegers, 1991; Sinha, 1994; Gooding et al., 1996), thereby yielding
0.48 and 0 for the mean and median respectively. As for RQ, I multiply it by negative
one so that higher RQ indicates higher reporting quality. As a result, RQ has negative
values with the mean and median of -0.13 and -0.08 respectively. The distribution of
RQ is similar Biddle et al. (2009).
Table 2 reports the Pearson and Spearman correlations among my variables.
Consistent with my predictions, I find that there is a positive and significant
correlation between LOSS, BIG and RDE. It therefore provides us preliminary
evidence on my hypotheses (1) and (2) stating that losses drive firms to invest more in
R&D and prospect incentive strengthen this inclination even more. As for hypotheses
(3), I find that LOSS is significantly negative associated with EARN5 and EARN1,
and significantly positive associated with R&D, which is consistent with Hayn (1995)
and Joos and Plesko (2005). However, it is difficult to explain the association among
BIG and R&D, LOSS, EARN5, EARN1 since there exists opposite correlations
between BIG and the others and some of these correlations are insignificant. It also
yields little information for us to explain BIG alone since it captures profit firms’
prospect incentive and that is not of my main interest. Finally, respecting hypotheses
(4), I find that RQ is negatively associated with LOSS, which induces prospect
incentive, and positively associated with EARN5 and EARN1. Again, since my main
36
interest is “loss firms’ prospect incentive”, I cannot refer to BIG alone and therefore
cannot observe whether the prospect-based R&D is negatively associated with RQ.
My correlation results for other control variables are substantially consistent with
prior studies mentioned before. For example, a positive and significant correlation
between Z SCORE, lagged R&D, TOBINQ and RDE; a negative and significant
correlation between TANG, LEV and RDE. There is also a high correlation between
SIZE, BM, TANG and EARN5.