芝麻對停經婦女性激素與血脂的影響
66
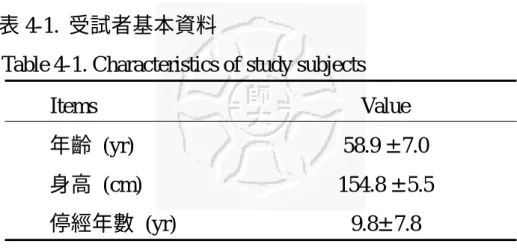
表 4-1. 受試者基本資料
Table 4-1. Characteristics of study subjects
Items Value
年齡 (yr) 58.9 ± 7.0
身高 (cm) 154.8 ± 5.5
停經年數 (yr) 9.8± 7.8
Values are means ± SD (n=24)
67
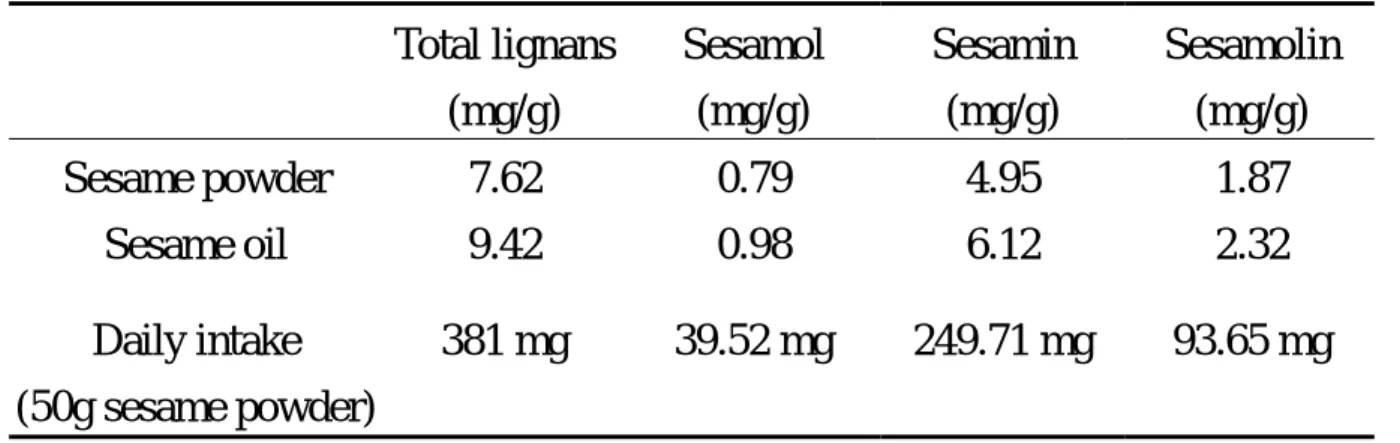
表 4-2. 芝麻的 lignans 含量
Table 4-2. The lignans contents of sesame Total lignans
(mg/g)
Sesamol (mg/g)
Sesamin (mg/g)
Sesamolin (mg/g)
Sesame powder 7.62 0.79 4.95 1.87
Sesame oil 9.42 0.98 6.12 2.32
Daily intake (50g sesame powder)
381 mg 39.52 mg 249.71 mg 93.65 mg
芝麻對停經婦女性激素與血脂的影響
68
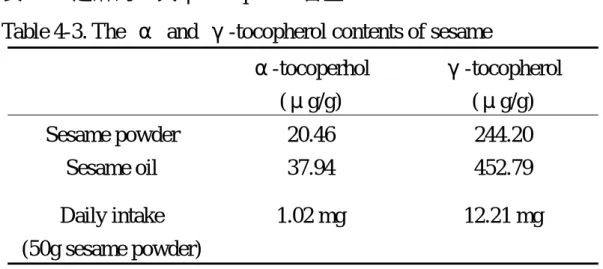
表 4-3. 芝麻的α與γ-tocopherol 含量
Table 4-3. The α and γ-tocopherol contents of sesame α-tocoperhol
(μg/g)
γ-tocopherol (μg/g) Sesame powder 20.46 244.20
Sesame oil 37.94 452.79
Daily intake (50g sesame powder)
1.02 mg 12.21 mg
69
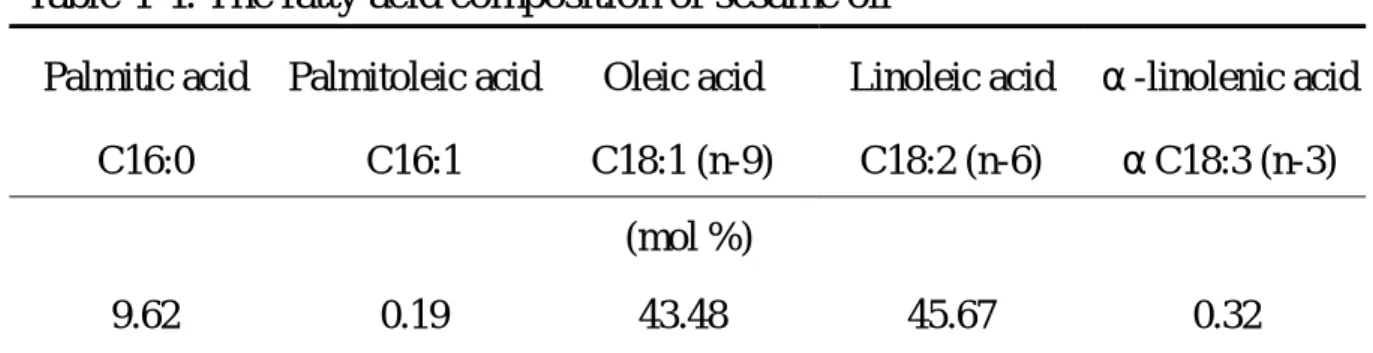
表 4-4. 芝麻油的脂肪酸組成
Table 4-4. The fatty acid composition of sesame oil
Palmitic acid Palmitoleic acid Oleic acid Linoleic acid α-linolenic acid C16:0 C16:1 C18:1 (n-9) C18:2 (n-6) αC18:3 (n-3)
(mol %)
9.62 0.19 43.48 45.67 0.32
芝麻對停經婦女性激素與血脂的影響
70
表 4-5. 芝麻的鈣、草酸含量
Table 4-5. The calcium and oxalate contents of sesame Ca
(mmol/100 g)
Oxalate (mmol/100 g) Sesame powder 2.678 0.705
Daily intake (50g sesame powder)
1.339 mmol 0.353 mmol
Ca:40 mg/mmol
Oxalate:90.04 mg/mmol
71 第四章 結果
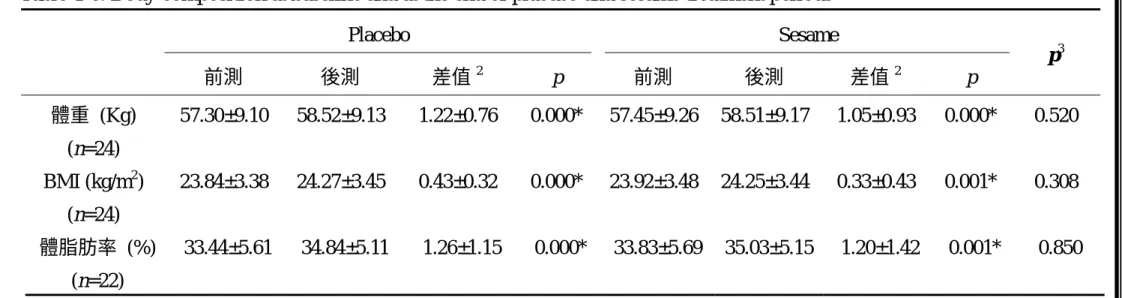
表 4-6. 受試者實驗期間身體組成之變化
1Table 4-6. Body composition at baseline and at the end of placebo and sesame treatment periods
1Placebo Sesame
前測 後測 差值2 p 前測 後測 差值2 p
p3
體重 (Kg) (n=24)
57.30±9.10 58.52±9.13 1.22±0.76 0.000* 57.45±9.26 58.51±9.17 1.05±0.93 0.000* 0.520
BMI (kg/m2) (n=24)
23.84±3.38 24.27±3.45 0.43±0.32 0.000* 23.92±3.48 24.25±3.44 0.33±0.43 0.001* 0.308
體脂肪率 (%) (n=22)
33.44±5.61 34.84±5.11 1.26±1.15 0.000* 33.83±5.69 35.03±5.15 1.20±1.42 0.001* 0.850
1 Values are means ± SD.
2差值=後測-前測
3 Comparison of changes from baseline between the sesame and placebo periods.
* Values are significantly different between before and after the treatment period at p<0.05.
72 芝麻對停經婦女性激素與血脂的影響
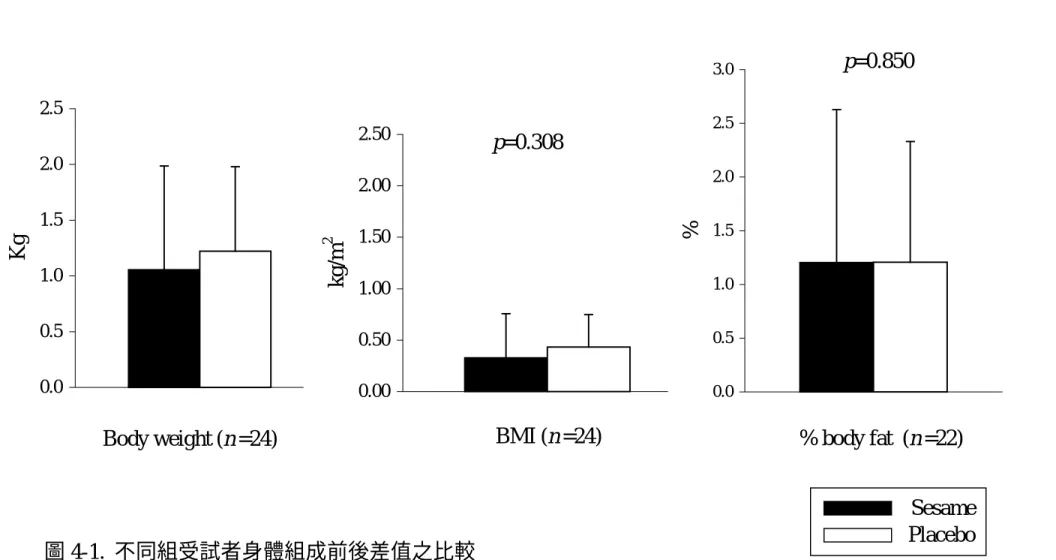
圖 4-1. 不同組受試者身體組成前後差值之比較
Figure 4-1. Comparison of the mean differences (±SD) in body composition between the sesame and placebo periods.
Body weight (n =24)
0.0 0.5 1.0 1.5 2.0 2.5
Kg
BMI (n =24)
0.00 0.50 1.00 1.50 2.00 2.50
kg/m
2% body fat (n =22)
0.0 0.5 1.0 1.5 2.0 2.5 3.0
%
Sesame Placebo p=0.308
p=0.850
73 第四章 結果
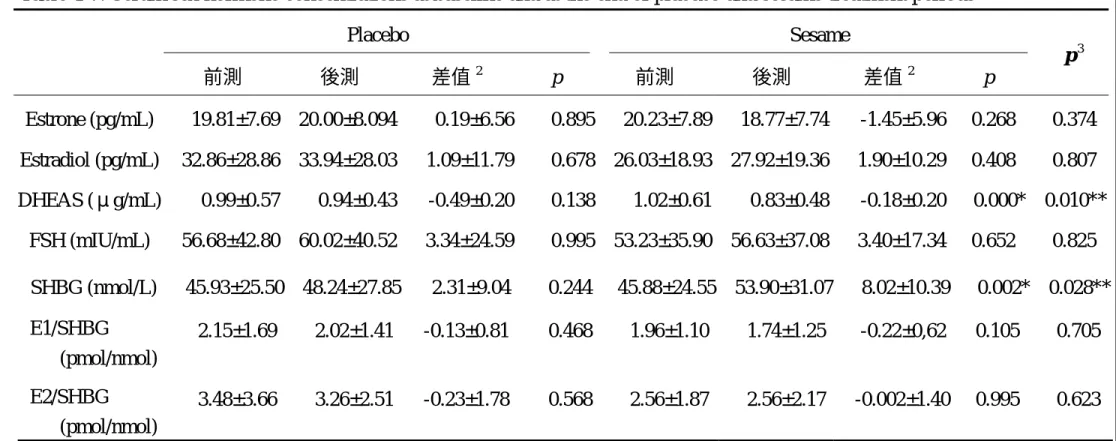
表 4-7. 受試者實驗期間血清中性激素之濃度
1Table 4-7. Serum sex hormone concentrations at baseline and at the end of placebo and sesame treatment periods
1Placebo Sesame
前測 後測 差值2 p 前測 後測 差值2 p
p 3
Estrone (pg/mL) 19.81±7.69 20.00±8.094 0.19±6.56 0.895 20.23±7.89 18.77±7.74 -1.45±5.96 0.268 0.374 Estradiol (pg/mL) 32.86±28.86 33.94±28.03 1.09±11.79 0.678 26.03±18.93 27.92±19.36 1.90±10.29 0.408 0.807 DHEAS (μg/mL) 0.99±0.57 0.94±0.43 -0.49±0.20 0.138 1.02±0.61 0.83±0.48 -0.18±0.20 0.000* 0.010**
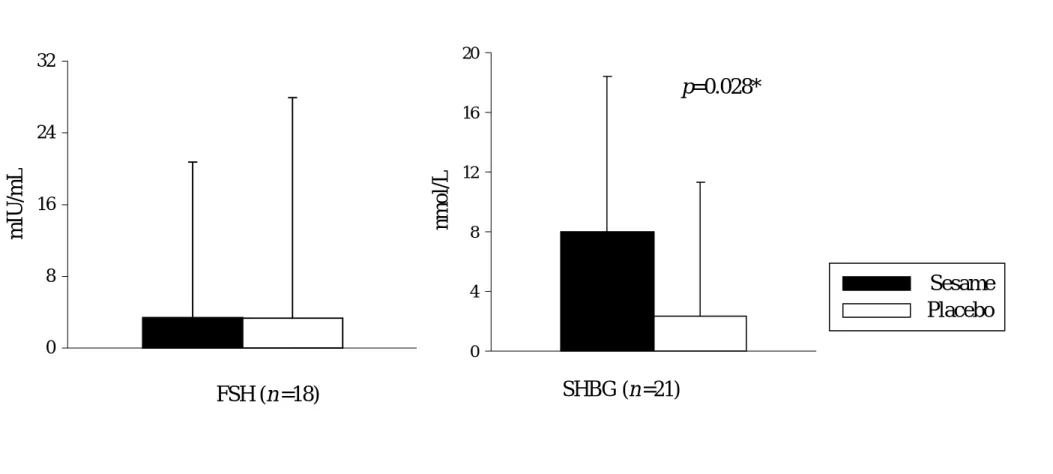
FSH (mIU/mL) 56.68±42.80 60.02±40.52 3.34±24.59 0.995 53.23±35.90 56.63±37.08 3.40±17.34 0.652 0.825 SHBG (nmol/L) 45.93±25.50 48.24±27.85 2.31±9.04 0.244 45.88±24.55 53.90±31.07 8.02±10.39 0.002* 0.028**
E1/SHBG (pmol/nmol)
2.15±1.69 2.02±1.41 -0.13±0.81 0.468 1.96±1.10 1.74±1.25 -0.22±0,62 0.105 0.705
E2/SHBG (pmol/nmol)
3.48±3.66 3.26±2.51 -0.23±1.78 0.568 2.56±1.87 2.56±2.17 -0.002±1.40 0.995 0.623
Estrone, DHEAS, SHBG, E1/SHBG (n=22) ; Estradiol, E2/SHBG (n=21) ; FSH (n=18)
1 Values are means ± SD.
2差值=後測-前測
3 Comparison of changes from baseline between the sesame and placebo periods.
* Values are significantly different between before and after the treatment period at p<0.05.
** Mean differences (±SD) are significantly different between the sesame and placebo periods at p<0.05.
74 芝麻對停經婦女性激素與血脂的影響
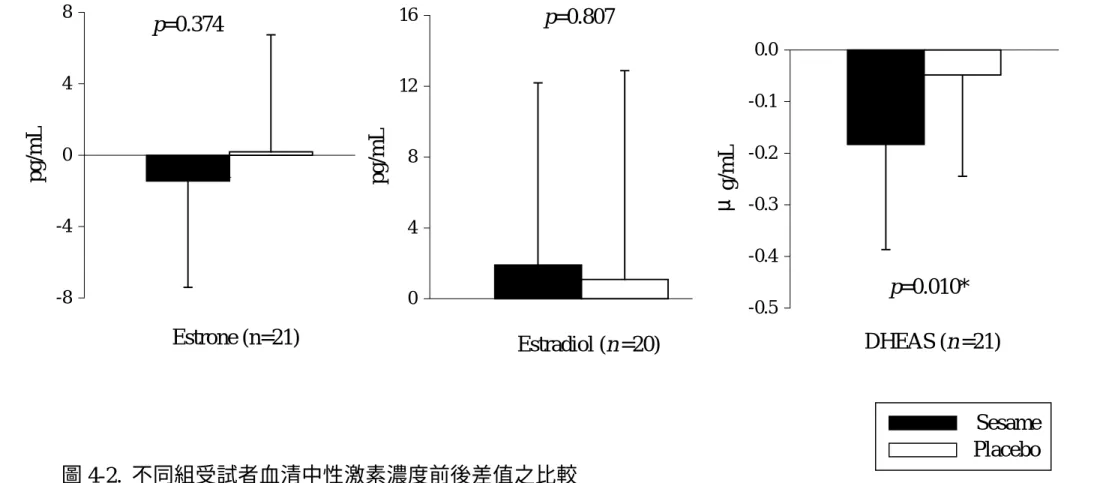
圖 4-2. 不同組受試者血清中性激素濃度前後差值之比較
Figure 4-2. Comparison of the mean differences (±SD) in serum sex hormone between the sesame and placebo periods.
*Mean differences (±SD) are significantly different between the sesame and placebo periods at p<0.05.
Sesame Placebo Estrone (n=21)
-8 -4 0 4 8
pg/mL
1p=0.374
Estradiol (n =20)
0 4 8 12 16
pg/mL
p=0.807
DHEAS (n =21)
-0.5 -0.4 -0.3 -0.2 -0.1 0.0
μ g/mL
p=0.010*
75 第四章 結果
續圖 4-2. 不同組受試者血清中性激素濃度前後差值之比較
Figure 4-2. (Continue) Comparison of the mean differences (±SD) in serum sex hormone between the sesame and placebo periods. *Mean differences (±SD) are significantly different between the sesame and placebo periods at p<0.05.
FSH (n =18) 0
8 16 24 32
mIU/mL
Sesame Placebo
SHBG (n =21)
0 4 8 12 16 20
nmol/L
p=0.028*
76 芝麻對停經婦女性激素與血脂的影響
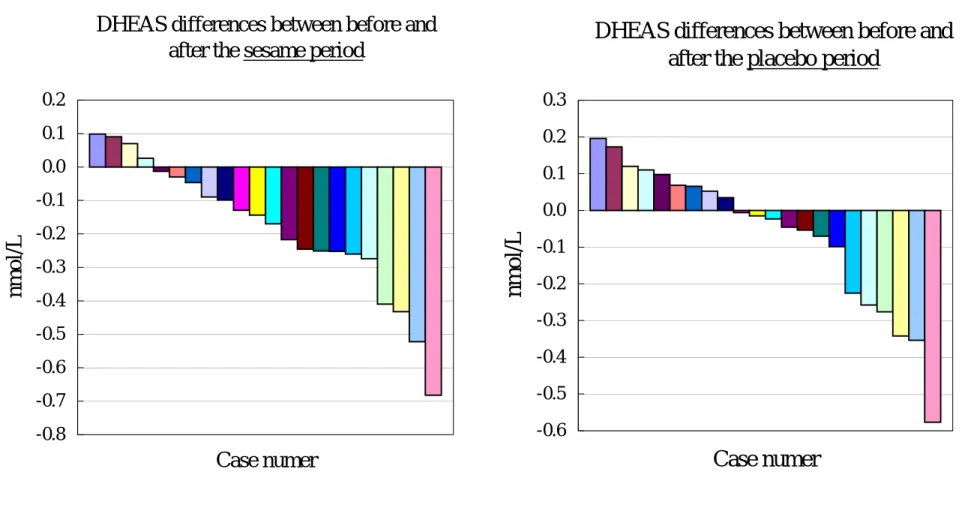
圖 4-3. 每位受試者在食用芝麻或安慰劑前後血清中 DHEAS 濃度差值之變化量
Figure 4-3. Effect of sesame or placebo intakes on the changes of serum DHEAS concentrations in individual subject.
DHEAS differences between before and after the sesame period
-0.8 -0.7 -0.6 -0.5 -0.4 -0.3 -0.2 -0.1 0.0 0.1 0.2
Case numer
nmol/L
DHEAS differences between before and after the placebo period
-0.6 -0.5 -0.4 -0.3 -0.2 -0.1 0.0 0.1 0.2 0.3
Case numer
nmol /L
77 第四章 結果
圖 4-4. 每位受試者在食用芝麻或安慰劑前後血清中 SHBG 濃度差值之變化量
Figure 4-3. Effect of sesame or placebo intakes on the changes of serum SHBG concentrations in individual subject.
SHBG differences between before and after the sesame period
-10 -5 0 5 10 15 20 25 30
Case numer
nmol/L
SHBG differences between before and after the placebo period
-24 -18 -12 -6 0 6 12 18 24
Case numer
nm ol/L
78 芝麻對停經婦女性激素與血脂的影響
表 4-8. 受試者實驗期間血漿總膽固醇與各種脂蛋白膽固醇濃度
1Table 4-8. Plasma total and lipoprotein cholesterol concentrations at baseline and at the end of placebo and sesame treatment periods
1Placebo Sesame
前測 後測 差值2 p 前測 後測 差值2 p
p 3
(mg/dL) (mg/dL) Plasma-C 209.17±35.20 206.75±32.52 -2.43±17.91 0.513 207.51±36.03 195.39±32.93 -12.13±16.38 0.001* 0.072
VLDL-C 11.83±5.01 13.15±6.76 1.32±5.23 0.239 11.99±4.85 12.49±7.56 0.50±5.50 0.666 0.596 LDL-C 123.43±26.88 121.58±28.37 -1.85±14.42 0.536 117.14±37.40 105.25±32.09 -11.88±17.52 0.004* 0.060 HDL2-C 37.88±10.34 37.14±10.57 -0.74±4.89 0.468 37.66±11.67 36.20±11.45 -1.46±4.29 0.108 0.646 HDL3-C 15.60±7.00 15.35±6.77 -0.25±2.59 0.638 14.08±2.10 13.99±1.59 -0.09±1.27 0.741 0.798
1 Values are means ± SD (n=24).
2差值=後測-前測
3 Comparison of changes from baseline between the sesame and placebo periods.
* Values are significantly different between before and after the treatment period at p<0.05.
79 第四章 結果
圖 4-5. 不同組受試者血漿總膽固醇與各種脂蛋白膽固醇濃度前後差值之比較
Figure 4-5. Comparison of the mean differences (±SD) in plasma and lipoproteins cholesterol between the sesame and placebo periods.
Plasma-C
-30 -24 -18 -12 -6 0
mg/dL
VLDL-C
0 2 4 6 8
mg/dL
LDL-C
-32 -24 -16 -8 0
mg/dL
Sesame Placebo p=0.072
p=0.596
p=0.060
80 芝麻對停經婦女性激素與血脂的影響
續圖 4-5. 不同組受試者血漿與各種脂蛋白中膽固醇濃度前後差值之比較
Figure 4-5. (Continue) Comparison of the mean differences (±SD) in plasma and lipoproteins cholesterol between the sesame and placebo periods.
HDL
2-C
-8 -6 -4 -2 0
mg/dL
HDL
3-C
-3 -2 -1 0
mg/dL Sesame
Placebo
p=0.646
p=0.798
81 第四章 結果
表 4-9. 受試者實驗期間血漿與極低密度脂蛋白三酸甘油酯的濃度
1Table 4-9. Plasma and very-low-density-lipoprotein triglyceride at baseline and at the end of placebo and sesame treatment periods
1Placebo Sesame
前測 後測 差值2 p 前測 後測 差值2 p
p 3
(mg/dL) (mg/dL)
Plasma-TG 91.60±30.32 103.34±38.16 11.74±26.01 0.037* 95.17±26.78 98.35±40.83 3.18±36.00 0.669 0.220 VLDL-TG 49.15±21.43 54.71±26.72 5.56±16.64 0.115 52.74±22.75 54.29±30.88 1.55±27.17 0.783 0.515
1 Values are means ± SD (n=24).
2差值=後測-前測
3 Comparison of changes from baseline between the sesame and placebo periods.
* Values are significantly different between before and after the treatment period at p<0.05.
82 芝麻對停經婦女性激素與血脂的影響
圖 4-6. 不同組受試者血漿與極低密度脂蛋白三酸甘油酯濃度前後差值之比較
Figure 4-6. Comparison of the mean differences (±SD) in plasma and very-low-density-lipoprotein triglyceride between the sesame and placebo periods.
Plasma-TG 0
10 20 30 40
mg/dL
VLDL-TG
0 10 20 30
mg/dL
Sesame Placebo p=0.220
p=0.515
83 第四章 結果
表 4-10. 受試者實驗期間 LDL 以銅離子催化氧化反應時 conjugated dienes 形成之 lag time 與 TBARS 產生量之變化情形
1Table 4-10. Lag time of conjugated diene formation and thiobarbituric acid reactive substances (TBARS) production of LDL
oxidized by copper at baseline and at the end of placebo and sesame treatment periods
1Placebo Sesame
前測 後測 差值 p 前測 後測 差值 p
p 3
Lag time (mins) (n=19)
44.96±11.40 47.11±15.20 2.15±19.90 0.643 45.06±8.23 48.94±9.71 3.87±11.16 0.148 0.750 TBARS (nmol/mg protein) (n=24)
氧化 1 hr 21.96±8.78 22.62±12.97 1.01±9.20 0.598 23.78±12.73 18.82±10.92 -5.55±11.80 0.031* 0.031**
氧化 2 hr 60.93±13.82 58.79±20.32 -1.82±12.90 0.497 54.91±19.14 50.77±16.07 -3.84±14.76 0.216 0.637 氧化 3 hr 84.00±19.44 81.18±26.15 -2.47±21.33 0.576 81.99±16.79 74.51±18.06 -7.38±11.05 0.003* 0.329
1 Values are means ± SD.
2差值=後測-前測
3 Comparison of changes from baseline between the sesame and placebo periods.
* Values are significantly different between before and after the treatment period at p<0.05.
** Mean differences (±SD) are significantly different between the sesame and placebo periods at p<0.05.
84 芝麻對停經婦女性激素與血脂的影響
圖 4-7. 不同組受試者 LDL 以銅離子催化氧化反應時 conjugated dienes 形成的 lag time 前後差值之比較
Figure 4-7. Comparison of the mean differences (±SD) in lag time of conjugated diene formation of LDL oxidized by copper between the sesame and placebo periods.
Lag time (n =19)
0 5 10 15 20 25
mins
Sesame
Placebo
p=0.750
85 第四章 結果
圖 4-8. 不同組受試者 LDL 以銅離子催化氧化反應時 TBARS 產生量前後差值之比較
Figure 4-8. Comparison of the mean differences (±SD) in thiobarbituric acid reactive substances (TBARS) production of LDL oxidized by copper between the sesame and placebo periods. *Mean differences (±SD) are significantly different between the sesame and placebo periods at p<0.05.
TBARS (氧化1 hr)
-20 -15 -10 -5 0 5 10 15
nmol/mg protein
TBARS (氧化2 hr)
-20 -15 -10 -5 0
nmol/mg protein
TBARS (氧化3 hr)
-25 -20 -15 -10 -5 0
nmol/mg protein
Sesame Placebo p=0.031*
p=0.637
p=0.329
86 芝麻對停經婦女性激素與血脂的影響
表4-11. 受試者實驗期間血清中α、γ-tocopherol之濃度及與血脂質之比值
1Table 4-11. Serum α and γ-tocopherol concentrations and the ratio of divided by the concentrations of plasma lipids at baseline and at the end of placebo and sesame treatment periods
1Placebo Sesame
前測 後測 差值2 p 前測 後測 差值2 p
p 3
(μg/mL) (μg/mL) α-TOH 7.422±1.94 7.457±1.90 0.035±1.93 0.930 7.345±2.15 8.052±2.51 0.707±2.07 0.115 0.131
γ-TOH 0.673±0.45 0.625±0.52 -0.048±0.35 0.504 0.677±0.56 1.120±0.91 0.443±0.51 0.000* 0.000**
(μmol/mol/10) (μmol/mol/10) α-TOH / total lipids / 10 26.86±5.76 27.03±7.80 0.16±8.23 0.924 26.36±5.90 30.90±10.42 4.54±8.91 0.020* 0.012**
γ-TOH / total lipids / 10 2.42±1.41 2.21±1.63 -0.21±1.31 0.431 2.50±1.91 4.24±3.06 1.74±1.84 0.000* 0.000**
1 Values are means ± SD (n=24).
2差值=後測-前測
3 Comparison of changes from baseline between the sesame and placebo periods.
* Values are significantly different between before and after the treatment period at p<0.05.
** Mean differences (±SD) are significantly different between the sesame and placebo periods at p<0.05.
87 第四章 結果
圖 4-9. 不同組受試者血清中α與γ-tocopherol 濃度前後差值之比較
Figure 4-6. Comparison of the mean differences (±SD) in serum α and γ-tocopherol between the sesame and placebo periods. *Mean differences (±SD) are significantly different between the sesame and placebo periods at p<0.05.
α-tocopherol
0.0 0.5 1.0 1.5 2.0 2.5 3.0
μg/mL
γ-tocopherol
-0.6 -0.4 -0.2 0.0 0.2 0.4 0.6 0.8 1.0
μg/mL
Sesame Placebo
p=0.131 p=0.000*
88 芝麻對停經婦女性激素與血脂的影響
γ-tocopherol/total lipids
-2.0 -1.0 0.0 1.0 2.0 3.0 4.0
μ mo l/mo l/1 0
α-tocopherol/total lipids
0.0 3.0 6.0 9.0 12.0 15.0
μ mol/mol/10
圖4-10. 不同組受試者血清中α、γ-tocopherol與血脂質比值前後差值之比較
Figure 4-10. Comparison of the mean differences (±SD) in serum α-tocopherol / plasma lipids and serum
γ-tocopherol / plasma lipids ratios between the sesame and placebo periods. *Mean differences (±SD) are significantly different between the sesame and placebo periods at p<0.05.
Sesame Placebo p=0.000*
p=0.012*
89 第四章 結果
表4-12. 受試者實驗期間血清中脂肪酸組成之變化
1Table 4-12. The composition of serum fatty acid at baseline and at the end of placebo and sesame treatment periods
1Placebo Sesame
前測 後測 差值2 p 前測 後測 差值2 p p 3
(mol %) (mol %)
C14:0 0.735±0.229 0.717±0.200 -0.018±0.186 0.636 0.713±0.288 0.710±0.347 -0.002±0.168 0.946 0.775 C16:0 22.090±1.640 21.964±1.373 -0.126±1.219 0.619 21.833±1.294 21.309±1.223 -0.525±1.087 0.027* 0.258
C16:1 2.100±0.479 2.156±0.455 0.056±0.283 0.341 2.078±0.449 1.983±0.543 -0.095±0.440 0.303 0.160 C18:0 7.759±0.457 8.030±0.475 0.271±0.455 0.008* 7.745±0.526 7.976±0.670 0.231±0.333 0.003* 0.770
C18:1 19.381±2.201 20.436±2.867 1.056±2.784 0.076 19.425±2.440 19.465±2.490 0.040±2.293 0.933 0.255 C18:2 (n-6) 34.266±3.644 33.025±3.607 -1.241±3.225 0.072 33.824±3.578 35.133±2.627 1.309±2.635 0.023* 0.018**
αC18:3 (n-3) 0.788±0.266 0.871±0.281 0.083±0.334 0.237 0.847±0.269 0.809±0.245 -0.038±0.267 0.494 0.185
C20:0 0.600±0.482 0.455±0.133 -0.145±0.454 0.131 0.515±0.138 0.542±0.331 0.027±0.324 0.691 0.142 C20:3 (n-6) 1.094±0.301 1.059±0.265 -0.035±0.194 0.383 1.125±0.268 1.104±0.341 -0.021±0.199 0.610 0.830
C20:4 (n-6) 4.878±0.942 4.658±1.096 -0.220±0.570 0.072 4.921±1.010 4.543±1.139 -0.378±0.684 0.013* 0.391 C20:5 (n-3) 1.458±0.717 1.488±0.785 0.030±0.542 0.789 1.535±0.642 1.354±0.668 -0.180±0.301 0.007* 0.135 C22:6 (n-3) 4.113±1.875 4.448±2.268 0.335±1.946 0.408 4.675±2.014 4.325±2.204 -0.350±1.278 0.193 0.106
20:4/18:2×10 1.44±0.34 1.43±0.38 -0.02±0.17 0.646 1.47±0.36 1.30±0.36 -0.17±0.23 0.001* 0.008**
20:4/20:3×10 47.45±15.10 46.99±17.50 -0.46±9.76 0.820 46.27±15.45 45.52±19.15 -0.75±10.23 0.723 0.916
1Values are means ± SD (n=24).
2差值=後測-前測
3 Comparison of changes from baseline between the sesame and placebo periods.
* Values are significantly different between before and after the treatment at p<0.05.
** Mean differences (±SD) are significantly different between the sesame and placebo periods at p<0.05.
90 芝麻對停經婦女性激素與血脂的影響
αC18:3 α-linolenic acid (n-3)
-0.4 -0.3 -0.2 -0.1 0.0 0.1 0.2 0.3 0.4 0.5
mo l %
圖 4-11. 不同組受試者血清中脂肪酸組成前後差值之比較
Figure 4-11. Comparison of the mean differences (±SD) in serum fatty acid composition between the sesame and placebo periods. *Mean differences (±SD) are significantly different between the sesame and placebo periods at p<0.05.
C18:2 linoleic acid (n-6) -5
-4 -3 -2 -1 0 1 2 3 4 5
mo l %
p=0.018* p=0.185
Sesame
Placebo
91 第四章 結果
C20:3 Dihomo-γ-linolenic acid (n-6)
-0.3 -0.2 -0.1 0.0
mol %
C20:4 Arachidonic acid (n-6)
-1.2 -1.0 -0.8 -0.6 -0.4 -0.2 0.0
mol %
C20:5 EPA (n-3)
-0.6 -0.4 -0.2 0.0 0.2 0.4 0.6 0.8
mol %
續圖 4-11. 不同組受試者血清中脂肪酸組成前後差值之比較
Figure 4-11. (Continue) Comparison of the mean differences (±SD) in serum fatty acid composition between the sesame and placebo periods.
p=0.830 p=0.391
Sesame Placebo
p=0.135
92 芝麻對停經婦女性激素與血脂的影響
表4-13. 受試者實驗期間尿液中Bicyclo PGE
2之濃度
1Table 4-13. Urinary Bicyclo PGE
2concentrations at baseline and at the end of placebo and sesame treatment periods
1Placebo Sesame
前測 後測 差值2 p 前測 後測 差值2 p
p3
(ng/mg Cr) (ng/mg Cr)
Bicyclo PGE2 38.50±31.12 45.99±26.59 7.49±35.94 0.318 37.03±18.41 56.83±29.92 19.79±36.22 0.014* 0.330
1 Values are means ± SD (n=24).
2差值=後測-前測
3 Comparison of changes from baseline between the sesame and placebo periods.
* Values are significantly different between before and after the treatment period at p<0.05.
93 第四章 結果
圖4-12. 不同組受試者尿液中Bicyclo PGE
2濃度前後差值之比較
Figure 4-12. Comparison of the mean differences (±SD) in urinary Bicyclo PGE
2between the sesame and placebo periods.
Bicyclo PGE
20 15 30 45 60
ng/m g Cr
p=0.330
Sesame
Placebo
94 芝麻對停經婦女性激素與血脂的影響
表4-14. 尿液Bicyclo PGE
2與血清花生四烯酸(C20:4)之比值
1Table 4-14. The urinary Bicyclo PGE
2/ serum arachidonic acid ratio at baseline and at the end of placebo and sesame treatment periods
1Placebo Sesame
前測 後測 差值2 p 前測 後測 差值2 p
p3
(ng/mg Cr/mol %) (ng/mg Cr/mol %)
Bicyclo PGE2 / C20:4 8.247±7.071 10.438±6.913 2.191±8.506 0.220 7.752±4.209 12.941±6.945 5.189±8.557 0.007* 0.324
1 Values are means ± SD (n=24).
2差值=後測-前測
3 Comparison of changes from baseline between the sesame and placebo periods.
* Values are significantly different between before and after the treatment period at p<0.05.
95 第四章 結果
表4-15. 受試者實驗期間尿液中鈣、鈉、鉀、氯排出之濃度
1Table 4-15. Urinary calcium, sodium, potassium and chloride concentrations at baseline and at the end of placebo and sesame treatment periods
1Placebo Sesame
前測 後測 差值2 p 前測 後測 差值2 p
p3
(μmol/mg Cr) (μmol/mg Cr)
Ca 4.484±2.37 4.727±2.02 0.243±2.71 0.665 5.888±2.77 4.322±2.52 -1.566±2.19 0.002* 0.037**
Na 127.76±75.82 141.04±83.94 13.28±85.66 0.455 177.35±105.37 136.80±84.30 -40.54±130.81 0.143 0.138 K 39.83±14.91 53.46±34.64 13.63±36.54 0.081 41.29±16.78 48.57±34.51 7.29±37.61 0.353 0.608 Cl 124.24±76.32 143.28±90.73 19.04±93.39 0.328 172.63±106.28 129.46±72.05 -43.17±120.92 0.094 0.081
1Values are means ± SD (n=24).
2差值=後測-前測
3 Comparison of changes from baseline between the sesame and placebo periods.
* Values are significantly different between before and after the treatment at p<0.05.
** Mean differences (±SD) are significantly different between the sesame and placebo periods at p<0.05.
96 芝麻對停經婦女性激素與血脂的影響
-200 Na -150 -100 -50 0 50 100 150
μ mol/mg Cr
圖4-13. 不同組受試者尿液中鈣、鈉、鉀、氯排出濃度前後差值之比較
Figure 4-13. Comparison of the mean differences (±SD) in urinary calcium, sodium, potassium and chloride between the sesame and placebo periods. *Mean differences (±SD) are significantly different between the sesame and placebo periods at p<0.05.
Ca
-4-3 -2 -1 0 1 2 3 4
μ mol/mg Cr
p=0.037* p=0.138
97 第四章 結果
K
0 5 10 15 20 25 30 35 40 45 50
μ mol/mg Cr
Cl
-200 -150 -100 -50 0 50 100 150
μ mol/mg Cr
續圖 4-13. 不同組受試者尿液中鈣、鈉、鉀、氯排出濃度前後差值之比較
Figure 4-13. (Continue) Comparison of the mean differences (±SD) in urinary calcium, sodium, potassium and chloride between the sesame and placebo periods.
Sesame Placebo p=0.081
p=0.608
98 芝麻對停經婦女性激素與血脂的影響
表4-16. 受試者實驗期間中血糖之濃度
1Table 4-16. Blood sugar concentrations at baseline and at the end of placebo and sesame treatment periods
1Placebo Sesame
前測 後測 差值2 p 前測 後測 差值2 p
p3
(mg/dL) (mg/dL) Blood sugar 104.73±8.38 104.10±8.54 -0.64±6.79 0.650 103.47±10.13 105.39±9.82 1.92±6.92 0.187 0.224
1Values are means ± SD (n=24).
2差值=後測-前測
3 Comparison of changes from baseline between the sesame and placebo periods.
99 第四章 結果
圖 4-14. 不同組受試者血糖濃度前後差值之比較
Figure 4-14. Comparison of the mean differences (±SD) in blood sugar between the sesame and placebo periods.
Blood sugar
-10-7 -4 -1 2 5 8 11