國立臺灣大學生物資源暨農學院動物科學技術學系 碩士論文
Department of Animal Science and Technology College of Bioresources and Agriculture
National Taiwan University Master Thesis
不同能量狀態下肝臟 SIRT1 對動物能量代謝之調控 The role of hepatic SIRT1 on metabolic regulation under
different energy status
劉佳欣 Chia-Hsin Liu
指導教授:陳靜宜 博士 丁詩同 博士 Advisor: Ching-Yi Chen, Ph.D.
Shih-Torng Ding, Ph.D.
中華民國 101 年 7 月
July 2012
謝誌
終於到了完成論文的日子,誠摯地感謝兩位指導老師 陳靜宜博士與 丁詩同博士悉心的教導 與策勵,本篇論文才能得以順利完成。也很感謝口試委員中興大學 陳洵一博士與東海大學 陳珠 亮博士對論文內容詳細審閱及建議,使論文益加完整,特別敬上我的謝意。研究所的兩年期間,由 衷感謝 陳靜宜老師於課業、實驗與人生經歷之開導,讓駑鈍的學生在壓力與挫折中不斷地學習與 成長;不同於陳老師給予指導, 丁詩同老師開啟了我對研究的興趣,其開放的態度也讓我對於研 究內容有更多的發揮空間,並讓我享有許多實驗室資源而無後顧之憂。
接著,感謝台東畜產試驗所共同協助蘭嶼豬的研究計畫,於試驗期間所內不吝嗇地提供相當多 的人力與資源,其中特別感激張之維學長,對於實驗豬隻的悉心照料與大力幫忙,使試驗得以順利 完成。同時,感謝李一泓學長、獸醫系詹德裕同學及文化大學方柏晴同學共同協助豬隻採樣。
實驗室學習期間,一路上受到許多學長姊的幫忙,豈能用三言兩語表達出心中的澎湃與感激。
感謝栢元學長 (阿光) 給予我許多實驗、課業、生活及人生經驗上的幫助,教導我處理事情的途徑 並解決我所有的大小問題,並讓我見識到學長是無所不能的。感謝雅卉學姊 (雅媽) 的提攜及照顧,
建立我的實驗基礎並學習許多實驗技巧,學姊積極、樂觀及穩重的個性是我的定心丸,同時也是我 所努力的目標。感謝虹妏學姊 (小雞) 讓我能夠快速適應實驗室的一切,並提供豐富的經驗讓我在 分生室有任何的事務或實驗問題都可以得到解答。感謝陳博、顏博、雅菁、芳英、裕如、晁瑋、原 佑、筱薇、郁仁、林昀、俊嫻、逸萍、家菁、欣瑜等學長姐們在生活與實驗上的協助,特別是實驗 中提供的技巧與經驗分享使我受益良多。
接著,感謝同窗宜臻、瑞婷、慧卉、幼欣、沛蓁及子萱,一路上有大家的砥礪與照顧,因為有 妳們這兩年的陪伴為我研究生生涯增色不少,謝謝妳們曾經陪我度過低潮的日子,並陪著我越挫越 勇。最後,感謝實驗室的學妹欣瑾、玉惠、孟詞、函臻以及助理湘宇,謝謝妳們在生活上的陪伴與 體諒,也能包容學姊不成熟的個性,讓我在得以順利完成本篇論文。
感謝俊杰多年來的扶持,一路從中興到台大很高興都有你在我身邊,對於我的任何決定都給予 支持,每當我沮喪難過之際總是陪伴在我身邊,也為本篇論文提供了許多勞動力,感謝之情難以言 喻。最後,感謝我父母與哥哥這兩年給予的付出與體諒,讓我在研究所期間不用為了學費、住宿及 飲食等問題而憂心,且父母對於我的行為給了很大的空間與信任,並默默地在背後支持我,作為我 最有力的靠山。我為我的家人感到驕傲,也希望我是他們的驕傲!
回想起研究所期間生活的點滴,經歷了許多報告、作業、研討會及漫長實驗的煎熬,當中辛酸 血淚實在難以言喻,很慶幸當初沒有因為辛苦或害怕而放棄,這些經驗都是難得的回憶與成長的證 明。最後,感謝所有曾經幫助過與鼓勵過我的人,也感謝曾經不看好我的人,沒有你們便無法成就 今日的我,鏤骨銘肌,謹以此論文上我最深的謝意。
中文摘要
Sirtuin 1,又稱之為SIRT1,是屬於Sirtuin哺乳動物蛋白質家族成員之一。SIRT1 與其非脊椎動物同源蛋白Sir2 (silent information regulator 2 gene) 皆為菸鹼醯胺腺 嘌呤二核苷酸依賴型去乙醯酵素,以菸鹼醯胺腺嘌呤二核苷酸 (NAD+) 與蛋白質 上乙醯態之離胺酸為受質,進行去乙醯化作用。先前研究發現,此二種酵素都可 因低能量情況或能量限制時而增加其表現量。後續其他研究發現,哺乳動物之 SIRT1可以藉由調控其目標蛋白而改變身體代謝、神經及免疫功能,進而產生抗老 化與延長壽命之效果。本研究目的在於了解不同代謝能濃度對於豬隻組織中SIRT1 及其相關基因表現之影響,並探討高脂飼糧下對於豬隻與小鼠體內SIRT1與能量代 謝之影響。
在試驗第一部分,使用十週齡蘭嶼豬進行十週的營養試驗,於期間分別餵飼 每公斤2500 (L) 、2700 (M) 及2900 (H) 大卡之飼糧。結果顯示,三組間體重、飼 料轉換率及平均日增重皆無差異。而L組別血液中具有較高之三酸甘油酯、高密度 脂蛋白及血糖,並且在肝臟中發現其具有較高之SIRT1與脂質合成基因表現。L組 別肝臟中合成較多三酸甘油酯,並在血液中觀察到具有較高的血脂現象,於此推 斷其具有較高的能量利用效率。另一部分,使用五月齡蘭嶼豬進行六個月的營養 試驗,於期間分別餵飼每公斤2700 (CON) 與3700 (HFD) 大卡之飼糧。結果顯示,
HFD組具有較高的體重與背脂厚度,但試驗後兩組血脂分析則無出現差異。同時 在肝臟中發現HFD組別具有較高的SIRT1與脂質分解基因表現,其餘基因表現皆無 差異。據此推斷SIRT1在HFD餵飼下具有避免肥胖造成傷害之功能。
為了更加確定SIRT1是否可以保護身體在肥胖初期避免肥胖飼糧下造成之代 謝傷害。此部分利用七週齡小鼠飼食一般飼糧 (CON) 與肥胖飼糧 (HFD) 探討各 時期的結果。結果顯示,在試驗初期 (兩週) 肝臟中SIRT1於HFD組有增加的現象,
但在長期間餵飼之下則沒有顯著差異,然而在年紀較大之動物上發現SIRT1有增加 的現象。體重與血脂分析部分,在第二週時便可發現體重、三酸甘油酯、總膽固 醇與血糖皆有顯著提升的效果。於此試驗推論,SIRT1可能在肥胖初期扮演保護的 角色,隨著年紀增加其作用活性降低或無法抵禦老化造成之影響,因此仍然出現 老化與肥胖現象。
綜觀上述,本研究指出豬隻肝臟中SIRT1表現在能量限制的情況下增加,此點 與其他物種具有相同的結果。高能量飼糧餵飼兩週,小鼠肝臟中SIRT1也有提升的 現象,在此推斷,SIRT1在肥胖初期具有保護的效果。然而,延長餵飼時間SIRT1 的功效則失去保護,其相關機制有待進一步釐清。
關鍵字:SIRT1、能量限制、高脂飼糧、能量代謝、蘭嶼豬、小鼠
Abstract
Sirtuin 1, also called SIRT1, is one member of sirtuin family proteins in mammals.
SIRT1 and its invertebrate homologue, silencing information regulator 2 (Sir2), both are nicotinamide adenine dinucleotide (NAD+) -dependent enzymes that exert deacetylating action on acetyl-Lysine of proteins. Previous studies showed that SIRT1 and Sir2 were up-regulated under low energy conditions or calorie restriction (CR).
Furthermore, increasing SIRT1 expression regulated its target proteins to modulate metabolic, neuronal and immunological functions, and therefore lead to anti-aging and longevity. This study was focused on the link between metabolic energy (ME) level and related gene expressions SIRT1 in various tissues of swine, and in mouse models in response to high fat diet (HFD).
In the first part of this study, 10-week-old Lanyu miniature pigs were fed with diet with various ME levels (2500 (L), 2700 (M) or 2900 (H) kcal/kg) for 10 weeks. There was no difference on body weight, feed conversion ratio and average daily gain among three groups. L group had a higher plasma level of triglyceride (TG), high density high density lipoprotein (HDL) and glucose than H group. Increased mRNA expression of SIRT1 and lipogenic genes were found in liver of L group. And hepatic triglyceride content was no different among three groups. These results suggested that low energy diet induced high efficiency by SIRT1, and fluxed to peripheral tissues for further use.
In the second part of this study, 5-month-old Lanyu miniature pigs were fed with control (CON) or HFD, as 2700 or 3700 (HFD) kcal ME/kg, for 6-month period. HFD pigs had a higher body weight and backfat thickness, but no difference in blood parameters, including TG, total cholesterol, HDL and LDL level between two groups was observed. After 6 month experiment period, Lanyu pig was not induced obesity.
HFD pigs had an increase in hepatic transcript and protein levels of SIRT1 and lipolytic
genes, suggesting a protective role of SIRT1 in HFD-induced metabolic damage of porcine model.
In order to elucidate whether SIRT1 protects mice from HFD-induced metabolic damages in early stage of obesity, the third experiment was designed using 7-week-old mice as an animal model in response to high fat diet (HFD) for various duration. Results showed that SIRT1 mRNA expression increased with advancing age. Compared with CON mice, HFD mice had higher hepatic SIRT1 mRNA expression at 2-week period, while there was no difference after 25-week feeding. In addition, body weight, plasma TG, total cholesterol and glucose level were elevated since 2 week by HFD. These results suggested that SIRT1 might play a protective role in early obesity stage, and its activity and protection decline with advancing age.
Taken together, this study indicated that porcine hepatic SIRT1 expression was induced in CR as well as the rodent model. While in the high energy status induced by HFD-feeding 2 weeks, the hepatic SIRT1 expression of mice was elevated as well.
These results suggest a protective role of SIRT1 in early obesity stage. However, the related mechanism needs further elucidation.
Key Words: SIRT1, calorie restriction, high fat diet, energy metabolism, Lanyu pig, mice
CONTENTS
謝誌 ... i
中文摘要 ... ii
Abstract ... iv
LIST OF FIGURES ... vii
LIST OF TABLES ... viii
LIST OF ABBREVIATIONS ... ix
Chapter 1: Introduction ... 1
I. Energy Intake ... 1
II. Obesity and Metabolic Syndrome ... 5
III. Sirtuin 1 (SIRT1) ... 10
Chapter 2: Materials and Methods ... 15
I. Experimental design and purpose ... 15
II. Animals and diets ... 15
III. Blood parameter analysis ... 16
IV. Sample and collection ... 17
V. Protein concentration ... 17
VI. Triglyceride content in tissue ... 18
VII. Oxygen radical absorbance capacity (ORAC)in tissue ... 18
VIII. Real-time quantitative polymerase chain reaction (PCR) analysis ... 19
IX. Protein expression and quantitation ... 21
X. Statistical analysis ... 22
Chapter 3: Results ... 34
I. ME vs. SIRT1 ... 34
II. HFD in porcine model vs. SIRT1 ... 41
III. HFD-feeding duration in mouse model vs. SIRT1 ... 48
Chapter 4: Discussion ... 55
I. Low ME vs. SIRT1 ... 55
II. HFD vs. SIRT1... 56
III. Age vs. SIRT1 ... 57
References ... 59
LIST OF FIGURES
Fig 1 A schematic representation of oxidative metabolism and substrate level
phosphorylation from glucose, fatty acids and amino acids. ... 2
Fig 2 A schematic model of ROS generation and scavenging in the mitochondria. ... 4
Fig 3 The lipid overview of abdominal fat ... 8
Fig 4 A stoichiometry of the Sir2/SIRT1 reaction ... 12
Fig 5 SIRT1 mediate metabolic response in several tissues ... 14
Fig 6 Growth performance of pigs in experiment 1 ... 36
Fig 7 Blood parameters of pigs in experiment 1 ... 37
Fig 8 SIRT1, glucose- and lipid- related mRNA expression of pigs in experiment 1.... 40
Fig 9 Growth performances and blood parameters of pigs in experiment 2 ... 43
Fig 10 SIRT1 mRNA expression in tissues of pigs in experiment 2 ... 45
Fig 11 Hepatic SIRT1 protein level, lipid- and carbohydrate-metabolic related mRNA expression of pigs in experiment 2 ... 46
Fig 12 Body weight change of mice in experiment 2 ... 50
Fig 13 Blood parameters of mice in experiment 2 ... 51
Fig 14 Hepatic SIRT1 mRNA expression of mice in experiment 2 ... 53
Fig 15 The metabolic mRNA expression of mice in experiment 2 ... 54
LIST OF TABLES
Table 1 Overview of key adipokines on metabolic syndrome ... 7
Table 2 Sirtuin localization and function ... 11
Table 3 Diet composition for porcine in experimental 1 ... 23
Table 4 Diet composition for porcine in experimental 2 ... 24
Table 5 Diet composition for mouse in experimental 2 ... 25
Table 6 Porcine primer sequences of selected genes for real-time RT- PCR analysis ... 26
Table 7 Mouse primer sequences of selected genes for real-time RT- PCR analysis .... 27
Table 8 Composition of extraction buffer ... 28
Table 9 Prescription of sample buffer ... 29
Table 10 Prescription of 10% SDS-polyacryamide gel ... 30
Table 11 Prescription of running buffer ... 31
Table 12 Prescription of blotting buffer ... 32
Table 13 The list of immunostaining antibody ... 33
Table 14 Organ weight of pigs in experiment 1 ... 38
Table 15 Circulating hormone of pigs in experiment 1 ... 39
Table 16 Hepatic triglyceride content of pigs in experiment 1 ... 39
Table 17 Organ weight of pigs in experiment 2 ... 44
Table 18 Hepatic triglyceride content and antioxidative activity of pigs in experiment 2 ... 47
Table 19 Organ weight of mice in experiment 2 ... 52
LIST OF ABBREVIATIONS
ACO acyl-Co A oxidase
BMI body mass index
CON pigs with 2700 kcal/kg diet or mice with chow diet CPT1 carnitine palmitoyl transferase 1
CR calorie restriction
CVD cardiovascular diseases
DGAT diacylgycerol acyltransferase
FAS fatty acid synthase
FFA free fatty acid
G6Pase glucose 6-phosphatase
GK glucokinase
H 2900 kcal/kg
HDL high density lipoprotein
HFD pigs with 3700 kcal/kg diet or mice with high fat diet HMGR 3-hydroxy-3-methyl-glutaryl-Co A reductase
L 2500 kcal/kg
LDL low density lipoprotein
LPK pyruvate kinase in liver
M 2700 kcal/kg
ME metabolic energy
PEPCK phosphoenolpyruvate carboxykinase
PG pituitary gland
SAT subcutaneous adipose tissue
TBP TATA-box binding protein
VAT visceral adipose tissue
The list only shows the important abbreviation.
Chapter 1: Introduction
Obesity is a global public health concern. Body mass index (BMI) is a clinical measurement to evaluate human body condition, and the formula is weight (kg) / hight square (m2). According to World Health Organization (WHO) definition, BMI ≧ 25 kg/m2 is considered as overweight, and BMI ≧ 30 kg/m2 isconsidered as obesity. The BMI value for obesity is changed with species. For example, overweight is BMI ≧ 24 kg/m2, and obesity is BMI ≧ 27 kg/m2 in Taiwan. In addition, the waist circumference, which is associated with abdominal obesity, is another major clinical concern. The goals of waist circumference are less than 40 inch for women and 35 inch for men.
Reports of WHO showed that over 200 million men and nearly 300 million women were obese in 2008. Bureau of Health Promotion, Department of Health, R.O.C.
(Taiwan) revealed that 50% of Taiwan adult men were obese in 2005-2008. Therefore, it is worth paying attention on obesity issue.
I. Energy Intake
Animals cannot survive without food. In other words, food is necessary for life.
The major function of food is to provide energy for metabolism. Carbohydrate and fat are the major energy sources, and they are further converted into simple molecules, such as mono-carbohydrate and fatty acid. Acetyl-Co A is synthesized during catabolism and oxidation, and it can enter the citric acid cycle (TCA cycle) to produce nicotinamide adenine dinucleotide (NADH) and flavin adenine dinucleotide (FADH2). Then, NADH and FADH2 attend electron transport chain (ETC) involve in adenosine triphosphate (ATP) production, which is an energy currency in cell. On the other hand, acetyl-Co A synthesizes fatty acid and triglyceride by fatty acid synthase and acryltransferase to
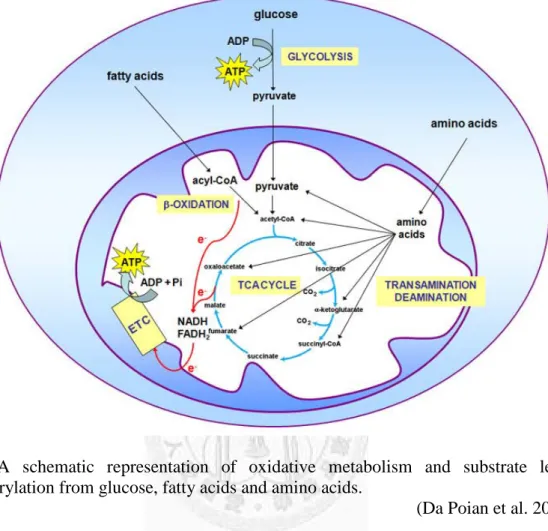
store energy as fat. There was a systemic oxidative metabolism overview about glucose, fatty acids and amino acids (Fig 1).
Fig 1 A schematic representation of oxidative metabolism and substrate level phosphorylation from glucose, fatty acids and amino acids.
(Da Poian et al. 2010)
A. Calorie restriction
Calorie restriction (CR) is a reduction of 10-50 % energy intake without causing malnutrition (Houtkooper et al. 2012). First CR-related experiment shower that CR retarded rat growth, depressed body size and extended life span (McCay et al. 1935).
From this discovery, researchers have focused on the effect of CR. There were many studies showed that CR altered metabolism and caused longevity, in Saccharomyces cerevisiae (Lin et al. 2004), Drosophila (Partridge et al. 2005) and mice (Harper et al.
2006), In human, long term of CR caused a decrease in body weight, blood glucose,
al. 1992; Walford et al. 2002). Furthmore, the rhesus monkey treated with 20-year CR revealed had longer life span and caused fewer diseases, such as cardiovascular disease and diabetes (Colman et al. 2009).
As we all know, mitochondrion is an organelle for ETC and ATP production.
Energy expenditure causes increasing NADH and FADH2 production. NADH and FADH2 are electron donors in ETC, electrons are channelled into the ETC and protons (H+) are exported from the mitochondrial matrix to the cytoplasm by complex protein.
Thereby, the proton gradient generates between proton gradient of matrix and cytoplasm.
Sometimes, electrons leak out of the ETC and generate reactive oxygen species (ROS), and the occurring ratio is 0.2-2% electrons upon ETC (Cadenas 1989; Halliwell and Gutteridge 2007). Superoxide anion (O2˙-), hydrogen peroxide (H2O2) and the hydroxyl
radical (OH˙) are main ROS in cells. Natural antioxidants, such as superoxide dismutase (SOD), glutathione peroxidase (GPx) and catalase, can clear most ROS forming H2O.
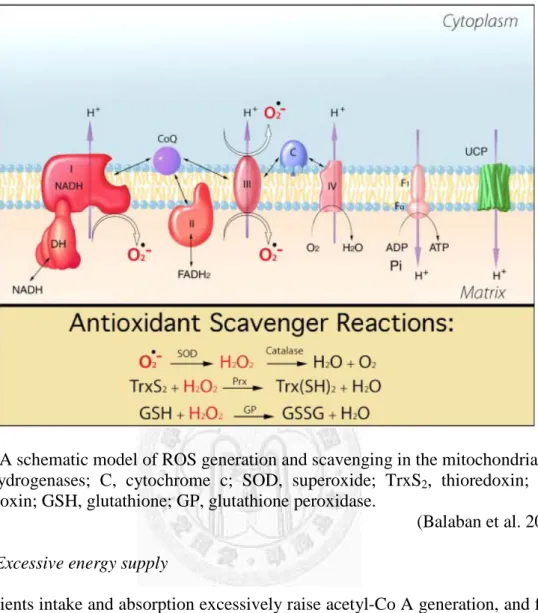
There was a schematic model of ROS generation and scavenging in Fig 2. Some studies indicated that the reason of longevity by CR was reducing oxidative stress. Taking less calories might prolong life by slowing metabolism and reducing oxygen radicals and oxidative damage in organism (Harman 1983; Sohal and Weindruch 1996).
Excessive ROS can impair cell components, including lipids, proteins, and DNA, and even cause cell death (Apel and Hirt 2004). Oxidative stress is an imbalance between ROS production and ability of antioxidant. Excessive food intake increases NADH and FADH2 production abundantly, therefore oxidative stress is elevated.
Oxidative stress plays a core role in the pathogenesis of various diseases (Brownlee 2001). CR reduced H2O2 generation and lowered respiration rate (Bevilacqua et al. 2004;
Bevilacqua et al. 2005) and increased uncoupling proteins (UCP) in mitochondria. The
responses above contribute to the benefit of CR on health.
Fig 2 A schematic model of ROS generation and scavenging in the mitochondria.
DH, dehydrogenases; C, cytochrome c; SOD, superoxide; TrxS2, thioredoxin; Prx, peroxiredoxin; GSH, glutathione; GP, glutathione peroxidase.
(Balaban et al. 2005) B. Excessive energy supply
Nutrients intake and absorption excessively raise acetyl-Co A generation, and fatty acid and triglyceride are synthesized to store energy as fat. Obesity is excessive fat accumulation in body, and overweight is the early stage of obesity. The phenotype of obesity is the hypertropy of lipid droplet, which stores excessive energy in tissue. Lipid usually accumulates in adipose tissues; however, fat accumulation in other tissue, as ectopic fat, occurs in obese condition. Briefly, obesity is an imbalance between intake and energy expenditure.
There was association with obesity, metabolic syndrome and oxidative stress. A study pointed out that increasing oxidative stress from adipose tissue led to early
accumulation but also increases health problems. About obesity-related diseases will be discussed later.
II. Obesity and Metabolic Syndrome
In 1920s, Kilyn physician found some relations between hypertension and high circulating glucose (Kilyn 1923). It was a beginning of gather syndromes on disease.
Metabolic syndrome is defined as metabolic abnormalities, including glucose intolerance, insulin resistance, obesity, dyslipidaemia and hypertension in recent studies.
When risks occurring together, it might develop cardiovascular diseases (CVD) (Isomaa et al. 2001; Lakka et al. 2002). CVD is a class of diseases, which involve the heart or blood vessels, with high death rate. Therefore, metabolic syndrome and CVD have been one of the health concerns recent years. There are various definitions of metabolic syndrome in many organizations, the most mentioned definition was WHO (1999). The criteria were as below:
Obesity
BMI ≧ 30 and/or waist:hip ratio > 0.9 (male) or > 0.85 (female) Insulin resistance (identified by 1 of the following)
Type 2 diabete
Impaired fasting glucose Impaired glucose tolerance Dyslipidaemia
Plasma triglycerides ≥ 150mg/dL
HDL cholesterol ≤ 35 mg/dL (male) or ≤ 39 mg/dL (female) Hypertension
Blood pressure > 140/90 mm-Hg Microabluminuria
Urinary albumin excretion > 20 µg/min The characteristic will be introduced as following.
A. Obesity
The common obesity factor is due to diet with high energy content of poor nutrition, which causes fat accumulation. Although the objective definition of obesity by WHO is BMI ≧ 30 kg/m2. Body fat distribution is more important than BMI. Fat below skin, as subcutaneous adipose tissue (SAT), is different characteristic from visceral adipose tissue (VAT) surrounding abdominal viscera in mesentery and omentum (Marieb and Hoehn 2008; Ibrahim 2010). One of physiological functions of SAT is as a storehouse for energy deposition. SAT has high avidity for excess fatty acids and glycerol to synthesis triglycerides (Freedland 2004). While, the normal physiological function of VAT is around internal organs to prevent impact. Energy deposit in SAT firstly, when the storage capacity of SAT overloads or new adipocyte generates under stress or damage, excess fat was beginning to deposit in areas outside the subcutaneous tissue, such as VAT (Ibrahim 2010).
Abdominal obesity is emphasized in metabolic syndrome. Abdominal fat consists with SAT and VAT. It was suggesting that SAT was one part of abdominal fat, and VAT has a strong association with insulin resistance (Abate et al. 1995; Goodpaster et al. 1997). Moreover, studies found that there was high association between VAT and metabolic abnormalities, such as hyperglycemia, hypertension, insulin resistance and atherogenesis (Mårin et al. 1992; Lebovitz and Banerji 2005). Also, there was negative relation between glucose deposal rate and SAT, indicating SAT playing an important regulated role in obesity-related insulin resistance (Abate et al. 1995). Therefore, VAT is an important consist of abdominal obesity, as center obesity, which has been a popular issue with metabolic syndrome (Fig 3).
Adipose tissue can store energy in oil droplet, and adipocyte can produce adipokines, which are hormones secreted by adipose tissue, and act not specifically on adipose tissue. Adipokine includes plasminogen activator inhibitor-1 (PAI-1)
(Shimomura et al. 1996), tumor necrosis factor-alpha (TNF-a) (Mohamed-Ali et al.
1997; Uysal et al. 1997), resistin (Steppan et al. 2001; Banerjee et al. 2004), leptin (Friedman and Halaas 1998; Unger 2003), adiponectin (Arita et al. 1999; Matsuzawa et al. 2004) and interleukin-6 (IL-6) (Mohamed-Ali et al. 1997). IL-6, TNF-a and resistin from VAT were proved to induce insulin resistance and diabetes (Xu et al. 2003;
Lafontan 2005). Adipokines might be the major factor causing metabolic syndrome and ectopic fat accumulation in liver, pancreas, muscle, heart and kidneys (Table 1). In other hand, adiponectin, also secreted by adipose tissue, improves glucose sensitivity and anti-diabetes, however, the secretion decreased in obesity (Park et al. 2004; Kobayashi and Inoguchi 2005; Lau et al. 2005; Trujillo and Scherer 2005). Although obesity is one risk of CVD, not every obese subject patient has insulin resistance or high risk of diabete and CVD (Abbasi et al. 2002; Després and Lemieux 2006)
Table 1 Overview of key adipokines on metabolic syndrome
(Després 2006)
Fig 3 The lipid overview of abdominal fat Compare with subcutaneous and visceral fat on metabolic syndrome.
(Després and Lemieux 2006)
B. Insulin resistance
Insulin is an important hormone, which is produced by beta cells and secreted into circulatory system regulate energy utilization, such as carbohydrate and lipid. It can stimulate glucose uptake and inhibit lipolysis. Insulin resistance is a condition, which the cells become resistant to insulin, stimulation and therefore can’t use carbohydrate normally. As a result, there are high levels of insulin and glucose in blood. Because glucose deposal is broken down, cells use lipid for energy source instead, and cause hyperlipidemia.
Metabolic syndrome is also named as insulin resistance syndrome, it refers that metabolic syndrome is related to insulin resistance. Bergman et al. indicated that VAT was the major contributor of insulin resistance, and free fatty acids (FFA), the lipolytic products of VAT, and the anatomical position of VAT played an important role (Bergman et al. 2006). Insulin resistance was caused by large amounts of circulating FFA released from VAT, which flow into the portal vein and transported to the liver (Despres et al. 1990). Increasing circulating FFA inhibited insulin functions such as depressing hepatic glucose production and stimulating peripheral glucose uptake, which further stimulated insulin secretion and led to insulin insensitivity (Boden 1997; Boden and Shulman 2002). Overall, it is a vicious circle for insulin resistance.
C. Dyslipidaemia
There is high risk of dyslipidaemia in obese subject. Obese adults usually had increasing triglycerides and low density lipoprotein (LDL) and decreasing high density lipoprotein (HDL) (Evans et al. 1984). Acute hyperinsulinemia decreased triglyceride, FFA, very low density lipoprotein (VLDL) triglyceride and VLDL apo B production in health human (Lewis et al. 1993; Lewis et al. 1995). While chronic hyperinsulinemia increased triglyceride-rich VLDL and apo B production in obesity subject (Vega 2001;
Carr and Brunzell 2004). Triglycerides of VLDL was hydrolysis by lipoprotein lipase and VLDL transformed into LDL (Havel 1984). Triglycerides of VLDL and LDL exchanged for esterified cholesterol with HDL, as reverse cholesterol transport, therefore low HDL sometimes occurred in obese subjects (Evans et al. 1984; Fielding and Fielding 1995).
In addition, FFA stimulated mitochondrial ROS production (Inoguchi et al. 2000;
Subauste and Burant 2007), which could oxidize LDL ((Steinberg 1997). The oxidize LDL has been known as a pathogenic factor in atherosclerosis. Therefore, dyslipidaemia plays an important role for the occurrence of CVD.
III. Sirtuin 1 (SIRT1)
First function of Sir2 (silence information regulator 2) was that it could extend life span in Saccharomyces cerevisiae (Kaeberlein et al. 1999). Further studies revealed that yeast needed Sir2 to prolong longevity within CR (Lin et al. 2000). In invertebrate and vertebrate, Sir2 played an important role in cell survival and metabolism (Kaeberlein et al. 1999; Lin et al. 2000; Tissenbaum and Guarente 2001; Rogina and Helfand 2004;
Wood et al. 2004; Guarente 2005; Wang and Tissenbaum 2006). In mammals, there was a Sir2 homologue, SIRT1, which was also belonged to sirtuin family. The mammal sirtuin family has seven sirtuins proteins (SIRT1-7) that regulate different metabolic and stress response pathways as Table 2.
Table 2 Sirtuin localization and function
Sirtuin Class Localization Activity Targets SIRT1 I Nucleus Deacetylation
PGC-1a, FOXO1, FOXO3, p53, Notch, NF-kB, HIF1a, HIF2a, LBK1, LXR, FXR, SREBP1c, eNOS and more
SIRT2 I Cytosol Deacetylation Tubulin, PEPCK, FOXO1, FOXO3, PAR3
SIRT3 I Mitochondria Deacetylation
LCAD, HMGCS2, GDH, OXPHOS complex, SOD2, IDH2, NDUFA9, ATP5A, GDH, OTC, CypD (PPIF).
ALDH2 and more SIRT4 II Mitochondria ADP-ribosylation GDH
SIRT5 III Mitochondria
Deacetylation, demalonylation, desuccinylation
CPS1 SIRT6 IV Nucleus Deacetylation,
ADP-ribosylation H3K9, H3K56, HIF1a SIRT7 IV Nucleus Unknown p53
(Webster et al. 2011; Houtkooper et al. 2012) A. Characteristics of SIRT1
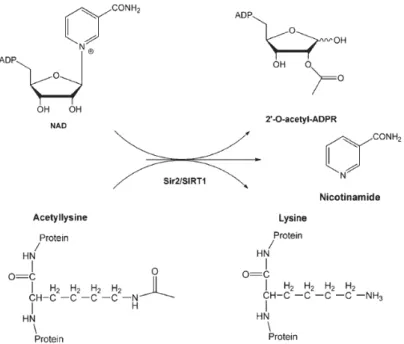
Both SIRT1 and Sir2 are class III histone deacetylases and NAD-dependent deacetylases. The reaction requirs NAD+ and acetyl-lysine of protein as substrates, and the products are 2’-O-acetyl-adenosine diphosphate ribose, nicotinamide and lysine of protein (Imai et al. 2000; Landry et al. 2000; Smith et al. 2000) (Fig 4). The activator and inhibitor for SIRT1 are resverstrol (Howitz et al. 2003) and nicotinamide (Bitterman et al. 2002), respectively.
Fig 4 A stoichiometry of the Sir2/SIRT1 reaction
(Yang and Sauve 2006) B. Regulation of SIRT1 activity
SIRT1 activitys are modulated according to the energy status of animal. SIRT1 was increased in low energy status, such as fasted (Nemoto et al. 2004) and CR (Cohen et al. 2004), and decreased in high energy status (Coste et al. 2008).
There are several transcription factor binding sites in SIRT1 promoter, including forkhead box protein O1 (FOXO1) (Nemoto et al. 2004), cAMP response element-binding (CREB), carbohydrate response element-binding protein (CHREBP) (Noriega et al. 2011) and peroxisome proliferator activated receptors (PPARs) (Han et al. 2010; Hayashida et al. 2010), which regulate SIRT1 expression to respond to the stimulation. FOXO1, PPARalpha, PPARdelta and CREB promote SIRT1 expression (Nemoto et al. 2004; Hayashida et al. 2010; Noriega et al. 2011); in contrast, PPARgamma and CHREBP depresses SIRT1 expression (Han et al. 2010; Noriega et al.
2011).
SIRT1 activity was also regulated by forming complexes with other proteins. The active regulator of SIRT1 (AROS) bound with SIRT1, and positive regulated SIRT1 function and suppressed SIRT1 target p53 (Kim et al. 2007). There were several negative regulators, such as nuclear receptor co-repressor 1 (NCoR1) and silencing mediator of retinoid and thyroid hormone receptors (SMRT). NCoR1, SMRT and SIRT1 generated a complex protein, then bound with PPARgamma to inhibit adipogenesis and promote fat mobilization (Picard et al. 2004). Lys-specific demethylase 1 (LSD1) and SIRT1 coregulated and depressed Notch target genes (Mulligan et al. 2011).
NAD+ is the substrate and cofactor of SIRT1. NAD+ levels were raised in muscle, liver and adipose tissue upon low energy condition and exercise (Cantó et al. 2009;
Cantó et al. 2010). SIRT1 activity was affected by NAD+ content. The physical sources of NAD+ were nicotinic acid and nicotiamide though De no pathway and salvage. The NAD+ synthesis and supplement influenced SIRT1 activity (Imai 2009).
C. SIRT1 in metabolism
In the liver, SIRT1 increased upon fasting, and it deacetylated and activated PPARgamma coactivator 1 alpha (PGC-1a) and FoxO1 to increase gluconeogenesis and inhibit glycolysis (Frescas et al. 2005; Rodgers et al. 2005; Banks et al. 2008).
Hypoxia-inducible factor 1 (HIF1a) suppressed by SIRT1, led to decrease glycolysis and increase oxidative metabolism (Kim et al. 2006). Liver X receptor (LXR) was a factor related to hepatic cholesterol and triglyceride synthesis. SIRT1 deacetylated LXR to increase transcriptional activity and further activated SREBP1c to increase fatty acid synthesis (Li et al. 2007). However, SIRT1 also deacetylated LXR and SREBP1c, and reduced lipogenesis (Ponugoti et al. 2010; Walker et al. 2010). SIRT1 also activate
PPARalpha and its cofactor, PGC-1a, to increase gene expression involved fatty acid uptake and/or beta-oxidation (Purushotham et al. 2009).
In liver SIRT1 increased gluconeogenesis and inhibit glycolysis by deacetylated and activated PGC-1a and FoxO1, and there were similar mechanism in muscle (Frescas et al. 2005; Rodgers et al. 2005; Banks et al. 2008). And further, SIRT1 repressed the UCP2 to reduce glucose-stimulated insulin secretion and body glucose tolerance in beta cells (Bordone et al. 2005; Moynihan et al. 2005). SIRT1 reduced lipolysis in liver, and it also found in other tissue. SIRT1 regulated PGC-1a to induce fatty acid oxidation in muscle (Gerhart-Hines et al. 2007), and SIRT1 inhibited PPAR-gamma to increase fat mobilization and reduce lipogenesis and adipogenesis in adipose tissue (Picard et al.
2004) (Fig 5).
In addition, SIRT1 not only affected metabolism but also affected feeding behavior.
In the brain, SIRT1 increased in the hypothalamus upon fasting and decreased FoxO1 acetylation to modulate the central melanocortin system and decrease satiation (Giannakou and Partridge 2004; Ramadori et al. 2008).
Overall, activating SIRT1 can alters appetite and metabolism to increase energy expenditure and decrease gluconeogenesis, lipogenesis and adipogenesis.
Fig 5 SIRT1 mediate metabolic response in several tissues
(Houtkooper et al. 2012)
Chapter 2: Materials and Methods
I. Experimental design and purpose A. Experiment 1
The purpose of this experiment was focused to the link between metabolic energy (ME) level and SIRT1-regulated gene expressions of various tissues in swine model.
B. Experiment 2
The purpose of this experiment was to examine the effect of high fat diet (HFD) -feeding on SIRT1 gene expression in swine and mouse model.
II. Animals and diets
Lanyu miniature pig, which is distinctive animal of Taiwan, is an indigenous pig breed from Lanyu (Orchid) Island off the south-east coast of Taiwan. The characteristics of Lanyu pigs are a narrow head, long straight snout, small erect ears and coarse dark hairs. The adult body weight is about 70 kg and is categorized as a miniature pig (Jiang et al. 2008).
Experiment 1
Eight-week-old Lanyu miniature pigs were raised in Taitung Animal Propagation Station (TAPS), Livestock Research Institute of Council of Agriculture. The average initial weights were 7.12 ± 0.18 kg. Pigs were randomly divided into three groups (4 gilts and 4 barrows each group) and fed with different diet with three ME levels (2500 (L), 2700 (M) or 2900 (H) kcal/kg), respectively. Feed compositions were provided in Table 3.
In the 10-week experimental period, daily feeding rate was 5 % of body weight, and the weight and body length (crown–rump length) were recorded weekly. Blood sample was collected in the beginning, week 5 and the end of experiment.
A. Experiment 2
Porcine model
Five-month-old Lanyu miniature pigs were raised in TAPS. Initial weight of pigs was 12.61 ± 0.79 kg and the pigs were randomly divided into two groups (4 barrows each group) and were fed with diet with two ME levels (2700 (CON) or 3700 (HFD) kcal/kg), respectively. Feed composition was provided in Table 4.
In 6-month experimental period, pigs were fed ad libitum, and the weight and body length were recorded and blood sample was collected monthly. The backfat thickness was surveyed in the end of experiment (Ultrasound for Ultra Profits, RENCO, Minneapolis, MN, USA).
Mouse model
Five-week-old C57B/6J male mice were purchased from Laboratory Animal Center, Nation Taiwan University, and mice were kept under 12-hour day and 12-hour night conditions. Initial weight of mice was 21.60 ± 0.24 g. Mice were fed with standard chow diet (LabDiet 5001, St. Louis, MO, USA) for 2 weeks for adaptation. Then mice were divided into two groups; control (chow diet) or HFD (TestDiet), respectively for 28-week. Feed and water were free accessed. Feed composition was provided in Table 5.
In the 28-week experimental period, body weight was recorded weekly, blood and tissue samples were collected in the beginning.
III. Blood parameter analysis
Prior to blood sample collection in pigs and mice went fasted for 16 hours and 12 hours, respectively. Plasma and serum were stored at -80 ℃ for further analysis.
Blood parameters were measured by using commercial kits: plasma glucose (GL2603, Rando, Antrim, UK), triglycerides (BXC0272C, Fortress, Antrim, UK), total
cholesterol (BXC0261B, Fortress, Antrim, UK), high density lipoproteins (HDL) (BXC0442A, Fortress, Antrim, UK) and non-esterified fatty acids (FFA) (K612, Bio-vision, Milpitas, CA, USA). Values of low density lipoproteins (LDL) were calculated by total cholesterol minus HDL. The porcine circulating hormones were measured by using commercial kits: leptin (E90084Po, Uscn, Wuhan, China) and insulin (AKRIN-013T, Shibayagi, Gunma, Japan).
All the procedures were followed according to the manufacturer’s instructions. The absorbance was measured by the colorimetric assay (Spectra max190, Molecular Devices, CA, USA). The R2 of standard curve ≥ 0.99 was accepted in each time. All samples were measured in triplicate.
IV. Sample and collection A. Porcine models
In the end of experiment, pigs were slaughtered by electrical stunning and bleeding.
Tissues, including liver, muscle, back fat, visceral fat and pituitary gland, were collected, washed by saline, and snap-frozen into liquid nitrogen and stored at -80 ℃ for further analyses.
B. Mouse models
In the end of experiment, mice were sacrificed with CO2. Tissues, including brain, liver, and adipose tissue, were collected, washed by phosphate buffered saline (PBS;
135mM NaCl, 4.7mM KCl, 10mM Na2HPO4 and 2mM NaH2PO4, pH7.4) , and snap-frozen into liquid nitrogen and stored at -80 ℃ for further analysis.
V. Protein concentration
After appropriate dilution of samples, the protein concentrations were measured by
Braford reagent (B6916, Sigma, St. Louis, MO, USA). The R2 of standard curve ≥ 0.99 was accepted in every time. All samples were measured in triplicate and calculated protein concentrations according to average absorbance.
VI. Triglyceride content in tissue
Tissue (0.1 g) was weighted and homogenized with 1 mL 5% NP-40. Sample was heated up at 85 ℃ in 3 minutes slowly and then was cooled down to room temperature.
The heating procedure was repeated triplicate until the sample became cloudy. Sample was centrifuged (14000 × g for 2 minutes). The supernatant was removed to a new tube for use and diluted 10-fold with water for use.
The tissue triglyceride concentration was measured by commercial kits (BXC0272C, Fortress, Antrim, UK), and the procedure was followed blood sample described above. The formula as below:
Triglyceeide content �𝑚𝑚𝑚𝑚 𝑚𝑚𝑚𝑚 𝑝𝑝𝑝𝑝𝑝𝑝𝑝𝑝𝑝𝑝𝑝𝑝𝑝𝑝� �
= triglyceride concentration �𝑚𝑚𝑚𝑚 𝑑𝑑𝑑𝑑� � ÷ protein content (𝑚𝑚𝑚𝑚 𝑑𝑑𝑑𝑑� )
VII. Oxygen radical absorbance capacity (ORAC)in tissue
Tissue (10 mg) was weighted and homogenized with 1 mL phosphate buffer (PB;
67.5 mM NaHPO4 and 7.5 mM KH2PO4, pH7.4), and the sample was centrifuged (5000 × g at 4 ℃for 10 minutes). The supernatant was removed to a new tube and diluted to appropriate fold with PB before use.
Firstly, 100 µL of β-PE solution (βPE; 3.78 mg β-phycoerythrin (P1286, Sigma, St.
Louis, MO, USA) in 1 litter water) were loaded in black plate. Secondly, 30 µL of PB, 20 µM Trolox (93510, Fluka, St. Louis, MO, USA) or diluted sample were loaded as
blank, control and sample, respectively. Finally, 30 µL of 80 mM 2,2′-Azobis(2-methylpropionamidine) dihydrochloride (AAPH; 440914, Sigma, St.
Louis, MO, USA) were added in each well. The fluorescent microplate reader (BioTek, Synergy H1, Ashton Vale, BRS, USA) was set up 420 nm as excitation and 576 nm as emission. The fluorescence was recorded immediately (0 minute) and every 5 minutes till the value was stable.
The area under curve (AUC) was calculated from initial to final minutes in each line. The relative ORAC value calculation as below:
𝑂𝑂𝑂𝑂𝑂𝑂𝑂𝑂𝑠𝑠𝑠𝑠𝑚𝑚𝑝𝑝𝑠𝑠𝑝𝑝
𝑂𝑂𝑂𝑂𝑂𝑂𝑂𝑂𝑐𝑐𝑝𝑝𝑝𝑝𝑝𝑝𝑝𝑝𝑝𝑝𝑠𝑠 = 𝑁𝑁𝑝𝑝𝑝𝑝 𝑂𝑂𝐴𝐴𝑂𝑂𝑠𝑠𝑠𝑠𝑚𝑚𝑝𝑝𝑠𝑠𝑝𝑝
𝑁𝑁𝑝𝑝𝑝𝑝 𝑂𝑂𝐴𝐴𝑂𝑂𝑐𝑐𝑝𝑝𝑝𝑝𝑝𝑝𝑝𝑝𝑝𝑝𝑠𝑠 = 𝑂𝑂𝐴𝐴𝑂𝑂𝑠𝑠𝑠𝑠𝑚𝑚𝑝𝑝𝑠𝑠𝑝𝑝 − 𝑂𝑂𝐴𝐴𝑂𝑂𝑏𝑏𝑠𝑠𝑠𝑠𝑝𝑝𝑏𝑏 𝑂𝑂𝐴𝐴𝑂𝑂𝑐𝑐𝑝𝑝𝑝𝑝𝑝𝑝𝑝𝑝𝑝𝑝𝑠𝑠 − 𝑂𝑂𝐴𝐴𝑂𝑂𝑏𝑏𝑠𝑠𝑠𝑠𝑝𝑝𝑏𝑏 The ORAC formula as below:
𝑂𝑂𝑂𝑂𝑂𝑂𝑂𝑂𝑠𝑠𝑠𝑠𝑚𝑚𝑝𝑝𝑠𝑠𝑝𝑝 �𝜇𝜇𝑚𝑚𝑝𝑝𝑠𝑠𝑝𝑝 𝑚𝑚 𝑝𝑝𝑝𝑝𝑝𝑝𝑝𝑝𝑝𝑝𝑝𝑝𝑝𝑝� �
= 𝑁𝑁𝑝𝑝𝑝𝑝 𝑂𝑂𝐴𝐴𝑂𝑂𝑠𝑠𝑠𝑠𝑚𝑚𝑝𝑝𝑠𝑠𝑝𝑝
𝑁𝑁𝑝𝑝𝑝𝑝 𝑂𝑂𝐴𝐴𝑂𝑂𝑐𝑐𝑝𝑝𝑝𝑝𝑝𝑝𝑝𝑝𝑝𝑝𝑠𝑠 × 𝑂𝑂𝑂𝑂𝑂𝑂𝑂𝑂𝑐𝑐𝑝𝑝𝑝𝑝𝑝𝑝𝑝𝑝𝑝𝑝𝑠𝑠 (𝜇𝜇𝜇𝜇)÷protein content (𝑚𝑚𝑚𝑚 𝑚𝑚𝑑𝑑� )
VIII. Real-time quantitative polymerase chain reaction (PCR) analysis A. Total RNA extraction and cDNA synthesis
Tissue (0.1-0.2 g) was weighted and homogenized with 1 mL TRIzol (15596-018, Invitrogen, Grand Island, NY, USA) to extracted total RNA according the manufacturer’s instructions. Sample was on ice for 15 minutes and then mixed with 100 µL of 1-bromo-3-chloropropane (BCP; BP151, Molecular research center, California, OH, USA). Next, sample was on ice for 15 minutes and then centrifuged (12000 × g at 4 ℃ for 15 minutes). Following centrifugation, the aqueous phase was removed to a new tube, and gently mixed with 500 µL of isopropanol. The samples were incubated at
-20 ℃ overnight. RNA pellets were precipitated by centrifugation (12000 × g at 4 ℃ for 10 minutes) and washed by 75% ethanol with 0.1% diethyl pyrocarbonate (DEPC;
1609-47-9, Bio Basic, Canada) in deionised water. RNA pellets were air-dried for 10 minutes and dissolved in 0.1% DEPC.
RNA samples contained some DNA, which were digested by DNase-free kit (AM1907, Ambion, Austin, TX, USA). After DNA digestion, RNA samples were reverse-transcribed to complementary DNA (cDNA) with High Capacity cDNA Reverse Transcription (RT) kit (4368813, Applied Biosystems, Foster city, CA, USA).
All the procedures were followed according to the manufacturer’s instructions.
B. Real-time RT- PCR
Real-time quantitative PCR reactions were performed on real-time PCR machine (CFX96, Bio-Rad, Hercules, CA, USA) using DyNAmo Flash SYBR Green qPCR Kit (F415L, Finnzymes, Espoo, Finland ). The PCR program was as below:
Step 1 95.0℃ for 7 min Step 2 95.0℃ for 10 sec
Step 3 Annealing temperature for 30 sec, go to Step 2 and repeat 40 times Step 4 60.0℃ for 10 sec
Step 5 Melting curve, 65 ℃ to 95 ℃ by increasing 0.5℃ per 5 sec.
Primers and related informations were provided in Table 6 and Table 7.
C. Quantitative data analysis of real-time PCR
Value of threshold cycle (Ct) was detected after Real-time PCR. The TATA-box binding protein (TBP) and the beta-actin were used as the reference gene in pig and mouse model, respectively. Relative RNA gene expression was calculated based on the formula: 2-(ΔΔCt).
The calculation as below:
∆∆Ct = ∆𝑂𝑂𝑝𝑝𝑝𝑝𝑝𝑝𝑝𝑝𝑠𝑠𝑝𝑝 − ∆𝑂𝑂𝑝𝑝𝑐𝑐𝑝𝑝𝑝𝑝𝑝𝑝𝑝𝑝𝑝𝑝𝑠𝑠
= �𝑂𝑂𝑝𝑝𝑝𝑝𝑠𝑠𝑝𝑝𝑚𝑚𝑝𝑝𝑝𝑝 − 𝑂𝑂𝑝𝑝𝑝𝑝𝑝𝑝𝑟𝑟𝑝𝑝𝑝𝑝𝑝𝑝𝑝𝑝𝑐𝑐𝑝𝑝 �(𝑝𝑝𝑝𝑝𝑝𝑝𝑠𝑠𝑝𝑝 ) − [𝑂𝑂𝑝𝑝𝑝𝑝𝑠𝑠𝑝𝑝𝑚𝑚𝑝𝑝𝑝𝑝 − 𝑂𝑂𝑝𝑝𝑝𝑝𝑝𝑝𝑟𝑟𝑝𝑝𝑝𝑝𝑝𝑝𝑝𝑝𝑐𝑐𝑝𝑝 ](𝑐𝑐𝑝𝑝𝑝𝑝𝑝𝑝𝑝𝑝𝑝𝑝𝑠𝑠)
IX. Protein expression and quantitation A. Total protein extraction
Tissue (0.1-0.2 g) was weighted, homogenized by liquid nitrogen, and mixed with 1 mL of extraction buffer to extract total protein according the manufacturer’s instructions. Sample was on ice for 15 minutes and centrifuged (14000 × g at 4 ℃ for 30 minutes). The supernatant was collected to a new tube for use. The extraction buffer prescriptions were provided in Table 8.
B. Polyacryamide gel electrophoresis
After protein concentration determination, samples were diluted to appropriate concentration by PBS and denatured at 95 ℃ for 5 minutes with sample buffer.
Samples were loaded in 10% SDS-polyacryamide gel, and the electrophoresis was run in running buffer at 150 V for 90 minutes. The prescriptions of sample buffer, running buffer and 10% SDS-polyacryamide gel were provided in Table 9 - 11.
C. Western blot and immunostaining
Protein was transferred from gel to PVDF membrane in blotting buffer at 400 mA for 1.5 hour. The 5% bovine serum albumin (BSA; A2153, Sigma, St. Louis, MO, USA) in PBST (PBS containing 0.1% Tween-20) was used as a blocking buffer. After blocking for 1 hour, the membrane was incubated with the primary (1st) antibody solution at 4 ℃ for overnight. Then, the membrane was washed with PBST triplicate, 10 minutes each, and then incubated with the 2nd antibody solution at room temperature
for 1 hour. Finally, after washing with PBST triplicate, the membranes were incubated in the chemiluminescence reagent (#WBKLS0500, Millipore, Billerica, MA, USA) with slow shaking, and exposed to the Imaging Systems (BioSpectrum Imaging Systems, UVP, Upland, CA, USA). The prescription of blotting buffer and antibody were provided in Table 12 - 13.
D. Quantitative data analysis of protein expression
Target bands were quantified using the BioSpectrum Imaging Systems (UVP, Upland, CA, USA) and corrected for the intensity of beta-actin in the same sample.
X. Statistical analysis
Data were expressed as mean ± SEM. Results were analyzed by SAS 9.2.
Statistical significance among different experimental groups was determined by Duncan’s multiple range tests. P-value ≤ 0.1 was considered pattern, and the P-value
≤ 0.05 was considered statistically significant.
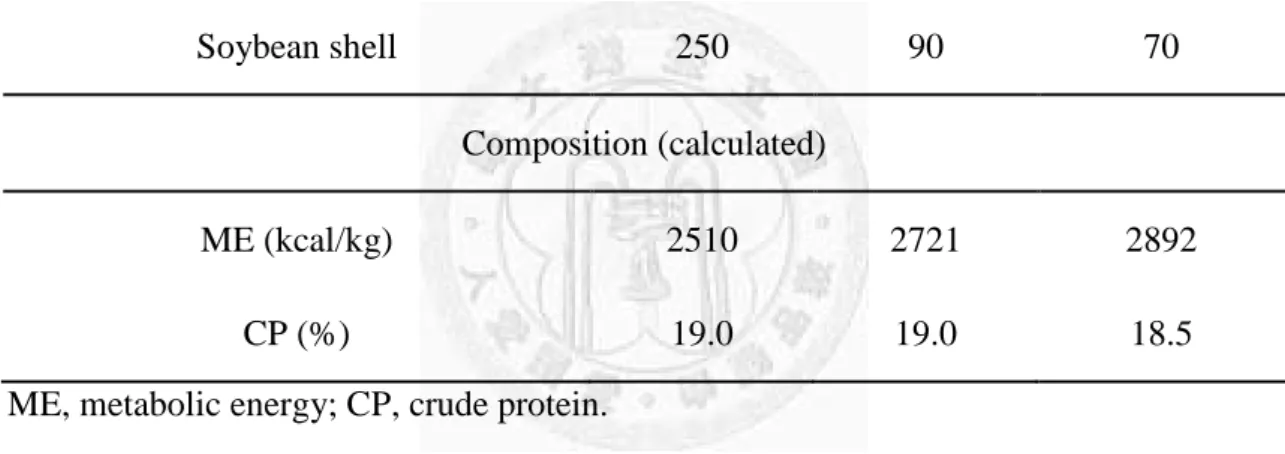
Table 3 Diet composition for porcine in experimental 1
L M H
Ingredient (kg)/1000 kg
Yellow corn 370 495 601.2
Soybean meal 140 153 166
Fish meal 29 26 0
Alfalfa meal 50 105 50
Molasses 50 50 50
Wheat Bran 100 68 17
Soybean shell 250 90 70
Composition (calculated)
ME (kcal/kg) 2510 2721 2892
CP (%) 19.0 19.0 18.5
ME, metabolic energy; CP, crude protein.
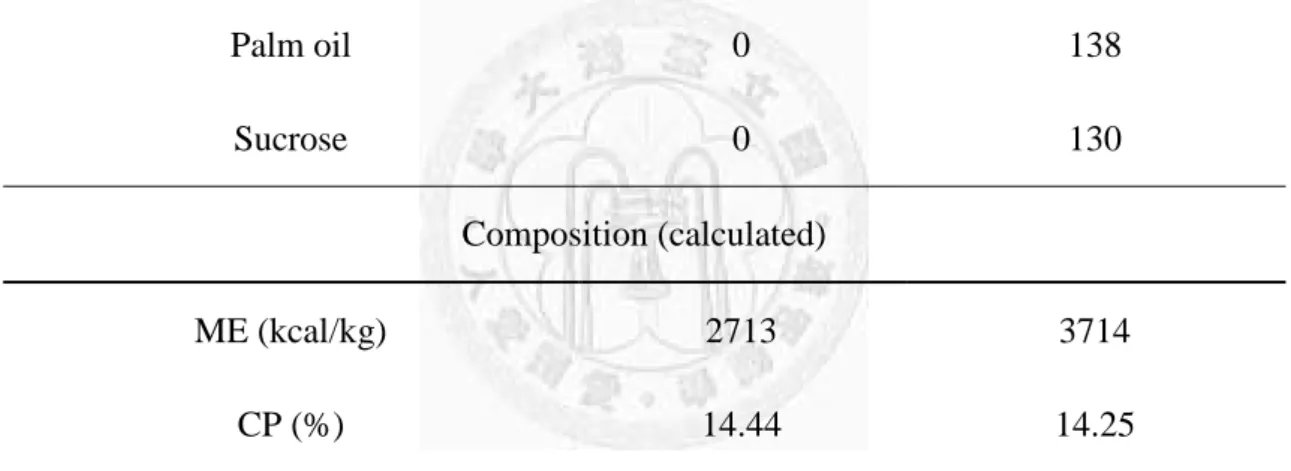
Table 4 Diet composition for porcine in experimental 2
CON HFD
Ingredient (kg) /1000kg
Yellow corn 510 410
Soybean meal 124 245
Alfalfa meal 117.5 0
Molasses 30 30
Wheat bran 97 0
Soybean hull 95 0
Palm oil 0 138
Sucrose 0 130
Composition (calculated)
ME (kcal/kg) 2713 3714
CP (%) 14.44 14.25
ME, metabolic energy; CP, crude protein.
Table 5 Diet composition for mouse in experimental 2
Control* HFD**
Energy from
Protein (%) 28.5 18.3
Fat (%) 13.5 45.7
Carbohydrate (%) 58.0 35.3
Composition
ME (kcal/gm) 3.02 4.65
Protein (%) 23.9 21.3
ME, metabolic energy.
*, LabDiet 5001, St. Louis, MO, USA
**, TestDiet 58V8 DIO Rodent Purified Diet, Richmond, IN, USA.
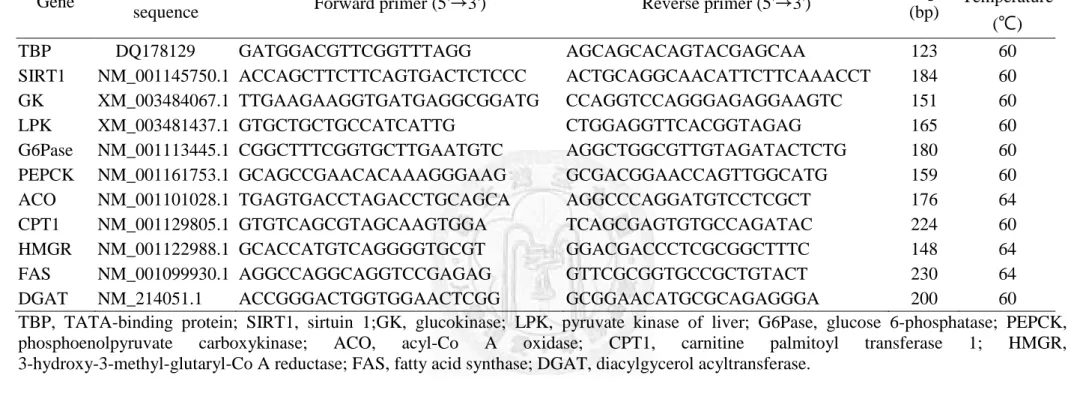
Table 6 Porcine primer sequences of selected genes for real-time RT- PCR analysis
Gene Reference
sequence Forward primer (5'→3') Reverse primer (5'→3') Length
(bp)
Annealing Temperature
(℃)
TBP DQ178129 GATGGACGTTCGGTTTAGG AGCAGCACAGTACGAGCAA 123 60
SIRT1 NM_001145750.1 ACCAGCTTCTTCAGTGACTCTCCC ACTGCAGGCAACATTCTTCAAACCT 184 60
GK XM_003484067.1 TTGAAGAAGGTGATGAGGCGGATG CCAGGTCCAGGGAGAGGAAGTC 151 60
LPK XM_003481437.1 GTGCTGCTGCCATCATTG CTGGAGGTTCACGGTAGAG 165 60
G6Pase NM_001113445.1 CGGCTTTCGGTGCTTGAATGTC AGGCTGGCGTTGTAGATACTCTG 180 60
PEPCK NM_001161753.1 GCAGCCGAACACAAAGGGAAG GCGACGGAACCAGTTGGCATG 159 60
ACO NM_001101028.1 TGAGTGACCTAGACCTGCAGCA AGGCCCAGGATGTCCTCGCT 176 64
CPT1 NM_001129805.1 GTGTCAGCGTAGCAAGTGGA TCAGCGAGTGTGCCAGATAC 224 60
HMGR NM_001122988.1 GCACCATGTCAGGGGTGCGT GGACGACCCTCGCGGCTTTC 148 64
FAS NM_001099930.1 AGGCCAGGCAGGTCCGAGAG GTTCGCGGTGCCGCTGTACT 230 64
DGAT NM_214051.1 ACCGGGACTGGTGGAACTCGG GCGGAACATGCGCAGAGGGA 200 60
TBP, TATA-binding protein; SIRT1, sirtuin 1;GK, glucokinase; LPK, pyruvate kinase of liver; G6Pase, glucose 6-phosphatase; PEPCK, phosphoenolpyruvate carboxykinase; ACO, acyl-Co A oxidase; CPT1, carnitine palmitoyl transferase 1; HMGR, 3-hydroxy-3-methyl-glutaryl-Co A reductase; FAS, fatty acid synthase; DGAT, diacylgycerol acyltransferase.
Table 7 Mouse primer sequences of selected genes for real-time RT- PCR analysis
Gene Reference
sequence Forward primer (5'→3') Reverse primer (5'→3') Length
(bp)
Annealed Temperature
(℃)
beta-actin NM_007393.3 CATGTACGTAGCCATCCAGG CTCTCAGCTGTGGTGGTGAA 225 60
SIRT1 NM_019812.2 TTGGCACCGATCCTCGAAC CCCAGCTCCAGTCAGAACTAT 209 60
CPT1 NM_013495.2 GGTCTCAAGTAATGGGTGC GAATACCAAACGGAGTTGC 102 62
G6Pase GCCTTCTATGTCCTCTTTCCC AACAGAATCCACTTGAAGACAGA 62
PEPCK NM_028994.2 TTGGAGAGAATGCTCGTGTG TGGAGAACAGCTGACTGGTG 150 62
SIRT1, sirtuin 1; CPT1, carnitine palmitoyl transferase 1, G6Pase, glucose 6-phosphatase;PEPCK, phosphoenolpyruvate carboxykinase.
Table 8 Composition of extraction buffer
1X extraction buffer
RIPA buffer (#9806, Cell signaling) 8 mL
Proteinase inhibitor
(04693116001, Roche, Basel, Switzerland )
1 mL
Phosphatase inhibitor
(04906845001, Roche, Basel, Switzerland)
1 mL
Total volume 10 mL
Proteinase inhibitor / phosphatase inhibitor, 1 tablet dissolved in 10 mL of each ddH2O and diluted 10-fold with RIPA buffer for use.
Table 9 Prescription of sample buffer
4X sample buffer
1 M Tris-HCl 20.0 mL
2- Mercaptoethanol 10.0 mL
100% Glycerol 20 mL
SDS
(17-1313-01, GE, Piscataway , NJ, USA)
4.0 gm
Bromophenol blue 20.0 mg
ddH2O 20.0 mL
Total volume 50 mL
4X sample buffer were adjusting the pH value to 6.8.
Table 10 Prescription of 10% SDS-polyacryamide gel
Separation gel Stacking gel
percentage 10% 4%
30% Acrylamide/Bis Solution
(#161-0154, Bio-Rad, Hercules, CA, USA)
6.7 mL 0.66 mL
1.5 M Tris, pH8.8 5.0 mL -
1.5 M Tris, pH6.8 - 1.24 mL
10% SDS
(17-1313-01, GE, Piscataway , NJ, USA)
0.2 mL 0.05 mL
5% APS
(A3678, Sigma, St. Louis, MO, USA)
0.1 mL 0.1 mL
TEMED
(T9281, Sigma, St. Louis, MO, USA)
10 µL 50 µL
ddH2O 7.99 mL 2.9 mL
Total volume 20 mL 5 mL
Table 11 Prescription of running buffer
5X running buffer Tris
(17-1321-01, GE, Piscataway , NJ, USA)
30.3 mL
Glycine
(17-1323-01, GE, Piscataway , NJ, USA)
142.6 gm
Total volume 1000 mL
5X running buffer were adjusting the pH value to 8.3.
1X running buffer: 5 mL 10% SDS, 100 mL 5X running buffer and 395 mL ddH2O
Table 12 Prescription of blotting buffer
10X blotting buffer Tris
(17-1321-01, GE, Piscataway , NJ, USA)
60.6 gm
Glycine
(17-1323-01, GE, Piscataway , NJ, USA)
288 gm
total volume 2000 mL
10X blotting buffer were adjusting the pH value to 8.3.
1X blotting buffer: 100 mL 10X blotting, 200 mL methanol, 700 mL ddH2O
Table 13 The list of immunostaining antibody
Name
Molecular weight
(kDa)
Host source
1st SIRT1 (#8469, Cell signaling) 120 Mouse
1st beta-actin (Santa cruze) ~43 Mouse
2nd Goat anti-mouse IgG (Abcam, Cambridge, MA, USA) - Diluted factors were according the manufacturer’s instructions.
Chapter 3: Results
I. ME vs. SIRT1
A. The effect of different ME levels on growth performance and blood parameters
In experiment 1, we compared the effect of three ME levels (2500 (L), 2700 (M) or 2900 (H) kcal/kg) on growth performance and energy metabolism during 10-week experimental period. Daily feeding rate was 5 % of body weight, so the energy intake amounts were increased with higher energy group. Weight curve was similar among three groups, and there was no difference among three groups at the end of experiment (Fig 6A). In addition, there was no difference in feed conversion ratio, average daily gain and BMI among three groups (Fig 6B - 6D). Organ weight was recorded at the end of experiment. Liver weight was not different among three treatments. In addition, a similar result of heart, and spleen weight were observed among treatments (Table 14).
Blood parameters, including triglyceride, total cholesterol, HDL and LDL, were analyzed in the initial and at the end of experiment. Lipid profile was similar in the initial of experiment, but L group tended to have a higher level of triglyceride and HDL (P < 0.1) than H group after 10-week experimental period (Fig 7). In addition, there was a higher insulin concentration in L pigs compared with H pigs (P < 0.05), while leptin was not different among three groups (Table 15).
B. The effect of different ME levels on SIRT1 gene expression in tissues
SIRT1 gene expression in liver, subcutaneous adipose tissue, visceral adipose tissue, muscle and pituitary gland, were analyzed. L pigs had higher SIRT1 expression in the liver than H pigs (P < 0.1), whereas no differences were observed in other tissues (Fig 8A).
C. The effect of different ME levels on hepatic energy metabolism
L pigs also had higher diacylgycerol acyltransferase (DGAT) expression than other groups (P < 0.1). Transcript abundances of acyl-Co A oxidase (ACO), carnitine palmitoyl transferase 1 (CPT1), fatty acid synthase (FAS) and 3-hydroxy-3-methyl-glutaryl-Co A reductase (HMGR) were not different among three treatments (Fig 8B).There was no difference in hepatic triglyceride content among three groups. (Table 16)
L group had higher pyruvate kinase (LPK) expression in the liver than H group (P<0.1), and L pigs trended to have higher phosphoenolpyruvate carboxykinase (PEPCK) gene expression (P=0.1861). Glucokinase (GK) and glucose 6-phosphatase (G6Pase) expression were not different among three groups (Fig 8C).
Experimantal period (week)
kg
0 2 4 6 8 10 12
0 5 10 15 20 25
L M H
gain weight (g) / feed (g)
L M H
0 10 20
30 L
M H
kg / day
L M H
0.00 0.05 0.10 0.15 0.20
0.25 L
M H
kg/m2
L M H
0 20 40
60 L
M H
A B
C D
Fig 6 Growth performance of pigs in experiment 1
A, body weight. B, feed conversion ratio (weight gain / total feed intake). C, average daily gain (body weight gain / average daily feed intake). D, BMI (body weight / body length (crown–rump length) square). All results are expressed as mean ± SEM. N=8 per group. Metabolic energy of diet is 2500 Kcal/kg for L treatment, 2700 Kcal/kg for M treatment, and 2900 Kcal/kg for H treatment.
mg/dl
Triglyceride Tot
al c hole
sterol
HDL LD
L
Glucose 0
50 100 150
200 L
M H
a a b a
ab b
a b b
Fig 7 Blood parameters of pigs in experiment 1
Plasma triglycerides, total cholesterol, HDL, LDL and glucose were measured at the end of experiment. All results are expressed as mean ± SEM. Different lowercase letters indicate a significant difference at P < 0.1 and N=8 per group. Metabolic energy of diet is 2500 Kcal/kg for L treatment, 2700 Kcal/kg for M treatment, and 2900 Kcal/kg for H treatment.
Table 14 Organ weight of pigs in experiment 1
L M H
Heart (g) 73.5 ± 5.6 68.8 ± 2.9 79.8 ± 3.6 Liver (g) 391.0 ± 20.7 359.5 ± 7.1 401.3 ± 17.7 Spleen (g) 34.0 ± 2.7 32.3 ± 1.1 38.3 ± 2.8 Kidneys (g) 81.0 ± 2.8a 71.5 ± 3.4b 74.3 ± 3.6ab All results are expressed as mean ± SEM. Different lowercase letters indicate a significant difference at P < 0.1 and N=4 per group. Metabolic energy of diet is 2500 Kcal/kg for L treatment, 2700 Kcal/kg for M treatment, and 2900 Kcal/kg for H treatment.
Table 15 Circulating hormone of pigs in experiment 1
L M H
Insulin (ng/mL) 3.6 ± 0.9a 1.9 ± 0.3b 1.5 ± 0.3b Leptin (ng/mL) 1.7 ± 0.3 2.3 ± 0.4 1.4 ± 0.3 All results are expressed as mean ± SEM. Different lowercase letters indicate a significant difference at P < 0.05. N=5 per group in insulin assay, N=8 per group in leptin assay. Metabolic energy of diet is 2500 Kcal/kg for L treatment, 2700 Kcal/kg for M treatment, and 2900 Kcal/kg for H treatment.
Table 16 Hepatic triglyceride content of pigs in experiment 1
L M H
Triglyceride (mg / mg protein) 0.6 ± 0.1 0.8 ± 0.0 0.8 ± 0.2 All results are expressed as mean ± SEM. N=4 per group. Metabolic energy of diet is 2500 Kcal/kg for L treatment, 2700 Kcal/kg for M treatment, and 2900 Kcal/kg for H treatment.
Relative RNA expression
LIVER SAT VAT MUS
CLE
PG 0
2 4 6 8
10 L
M H
a
ab b
A
Relative RNA expression
ACO CPT1
HMGR FAS DGAT 0
5 10 15
20 L
M H
a
b b Relative RNA expression
GK LPK
G6Pase
PEPCK 0
2 4 6
8 L
M
a H
ab
b
B C
Fig 8 SIRT1, glucose- and lipid- related mRNA expression of pigs in experiment 1 A, SIRT1 mRNA expression in liver, SAT, VAT, muscle and PG. B, hepatic lipid metabolic mRNA expression C, hepatic glucose metabolic mRNA expression. Gene expression was normalized to reference gene (TBP) and expressed relative to H group.
All results are expressed as mean ± SEM. Different lowercase letters indicate a significant difference at P < 0.1. N=4 per group. Metabolic energy of diet is 2500 Kcal/kg for L treatment, 2700 Kcal/kg for M treatment, and 2900 Kcal/kg for H treatment.
II. HFD in porcine model vs. SIRT1
A. The effect of HFD on growth performance and blood parameters
In experiment 2, we had fed HFD (3700 kcal/kg) or CON (2700 kcal/kg) with pigs for 6 months. In the beginning of experiment, body weight was similar between treatments. Body weight of HFD group was higher than CON pigs after 3-month experiment (P < 0.1) (Fig 9A), and average daily gain was higher in HFD pigs than CON pigs did (P < 0.1) (Fig 9B) HFD pigs also had a thicker back fat than CON pigs did (P < 0.05) (Fig 9C). In addition, HFD pigs had a larger spleen weight than CON pigs did (Table 17). Whereas, heart, lung and kidneys, were not different between two treatments.
In the beginning of experiment, plasma lipid profiles were similar between CON and HFD pigs. Unexpectedly, HFD did not affect the blood lipid profile after 6-month experiment (Fig 9D).
B. The effect of HFD on SIRT1 gene expression in tissues
To confirm whether SIRT1 expression was regulated by HFD, SIRT1 gene expression was detected in energy metabolic related-tissues, including liver, muscle and pituitary gland. HFD pigs had an increase in hepatic mRNA expression of SIRT1 as compared with CON pigs (P < 0.05) (Fig 10), and hepatic SIRT1 protein level of HFD group was higher than CON group (P < 0.05) (Fig 11A-B).
C. The effect of HFD on hepatic carbohydrate and lipid metabolism
HFD treatment increased CPT1 and ACO gene expression in the liver as compared with CON (P < 0.1). HMGR was slightly elevated in HFD group (P=0.1863). While, there were no difference on gene expression of FAS and DGAT between treatments (Fig 10C). Hepatic triglyceride content revealed that hepatic fat accumulation was not
changed by HFD treatment (Table 18). GK, LPK, G6Pase and PEPCK, were not different between two groups (Fig 10D).
D. The effect of HFD on hepatic antioxidative capacity
The results revealed that the hepatic antioxidative capacity was not different between two treatments (Table 18).