Corporate governance and cash holdings: A quantile regression approach
Tsung-Han Kuan
a, Chu-Shiu Li
b,⁎ , Chwen-Chi Liu
caDepartment of Economics, Feng Chia University, Taichung, 40724 Taiwan
bDepartment of International Business, Asia University, Taichung, 41354 Taiwan
cDepartment of Risk Management and Insurance, Feng Chia University, Taichung, 40724 Taiwan
a r t i c l e i n f o a b s t r a c t
Article history:
Received 15 March 2011
Received in revised form 24 February 2012 Accepted 20 April 2012
Available online 27 April 2012
This study investigates the role of ownership and control structure of firms when determining their cash holdings and focuses mainly on the association between excess control rights and cash holdings. Using a sample of Taiwanese publicly listed companies from 1997 to 2009, this study shows that the relationship between excess control rights and cash holdings depends on each firm's characteristics in terms of quantile regression. Fewer excess control rights affect cash holdings positively in low cash holding firms but negatively in high cash holding firms.
Additional analysis reveals that when a family member serves as the CEO in low cash holding firms, the amount of cash holding is greater than if the CEO is an outsider. However, family members holding the position of CEO affect cash holdings negatively in high cash holding firms. These results suggest that firms with less cash holdings stockpile more cash reserves to take advantage of investment opportunities. The objective of corporate governance for firms with more cash reserves is to ensure that firms decrease levels of cash to avoid agency problems.
© 2012 Elsevier Inc. All rights reserved.
JEL classification:
G32 G34 D92
Keywords:
Corporate governance Agency theory Cash holding
Separation of control and cash flow rights Quantile regression
1. Introduction
Corporate cash holding policies play an important role in a firm's financial policy. Empirical literature regarding corporate governance focuses a great deal of attention on the determinants of corporate cash holdings and the existence of an optimal level of cash holding (Chen, 2008; Chen & Chuang, 2008; Harford, Mansi, & Maxwell, 2008; Pinkowitz, Stulz, & Williamson, 2003).
However, there is little research regarding the association between cash holdings and corporate governance, especially among firms with different levels of cash holdings.
The amount of cash holding raises concerns about the agency cost of cash flow, and thus determining the optimal level of cash holding is difficult. For low cash holding firms, managers require large amounts of capital to keep investment opportunities with high return potential (Myers & Rajan, 1998). The objective of effective corporate governance for these firms is to ensure that they maintain appropriate levels of cash (Harford et al., 2008). In contrast, the internal capital of high cash holding firms is sufficient enough for them to take advantage of profitable investment opportunities. Excess cash in high cash holding firms enables managers to pursue their own interests by spending on unnecessary expenses and unprofitable investments (Jensen, 1986;
Jensen & Meckling, 1976). Effective corporate governance in these kinds of firms may create minority shareholder protections and therefore mitigate the agency problem of free cash flows by decreasing the level of cash holdings. This implies that corporate governance plays different roles in explaining corporate cash policy.
⁎ Corresponding author.
E-mail addresses:kuanth@mail.fcu.edu.tw(T.-H. Kuan),csli@asia.edu.tw(C.-S. Li),liuc@fcu.edu.tw(C.-C. Liu).
1059-0560/$– see front matter © 2012 Elsevier Inc. All rights reserved.
doi:10.1016/j.iref.2012.04.006
Contents lists available atSciVerse ScienceDirect
International Review of Economics and Finance
j o u r n a l h o m e p a g e : w w w . e l s e v i e r . c o m / l o c a t e / i r e f
The aim of this study is to investigate the impact of corporate governance on cash holdings in Taiwanese publicly listed firms.
Observing the cash holding policies of Taiwanese firms is interesting because their average cash holdings exceed the average cash ratio of firms in most developed countries, including Germany, Spain, Portugal, South Korea, and Hong Kong (Chang &
Noorbakhsh, 2006; Kalcheva & Lin, 2007). Additionally, there is a large divergence in the levels of cash holdings among Taiwanese firms (Kuan, Li, and Chu, 2011).
Firms in Taiwan tend to have a concentrated ownership structure.Yeh, Lee, and Woidtke (2001) study the structure of corporate ownership in Taiwan, and find that 76% of Taiwanese firms are controlled by families and the average cash flow rights of the largest family is only 26%. Effective control of a Taiwanese firm only requires the control of 15% of the cash flow rights.
Using pyramid shareholdings to appoint relatives or close friends as directors and supervisors is a common Taiwanese practice (Claessens, Djankov, & Lang, 2000; La Porta, Lopez-De-Silanes, & Shleifer, 1999; Yeh, 2005; Yeh & Woidtke, 2005).Shyu and Lee (2009)find that among Taiwanese listed firms, 71% have average board members controlled by a family group. The conflict of interest between majority and minority shareholders is high when the majority shareholder's level of control is large enough to influence a firm's decision-making process (Chen & Ho, 2009). The controlling shareholders in Taiwan take advantage of the board through relative dominance and influence the strategic direction of a vote by gaining a board seat.
By examining the role of corporate governance in cash holding decisions among firms with different levels of cash holdings in Taiwan, this study focuses on the separation of control and cash flow rights (hereafter referred to as excess control rights).
Control rights refer to controlling shareholder's ability to influence the way a firm is run, while the cash flow rights represent the controlling shareholder's share of the firm's losses or profits from their decision-making activities. The level of the excess control rights can be viewed as a proxy for the principal–agent type of conflicts (Bebchuk, Kraakman, & Triantis, 1999; Shyu &
Lee, 2009).
There are two reasons to analyze this separation. First, when shareholder ownership goes beyond a certain point, the large shareholders gain dominant control and have incentive to expropriate wealth from minority shareholders (Shleifer & Vishny, 1997). Wealth expropriation incentive becomes stronger as manager cash flow rights deviate from their control rights (Anderson
& Reeb, 2003). In the model proposed byBebchuk et al. (1999), the agency costs that result from a firm's inefficient choices increase as the degree of separation between voting rights and cash flow rights increases. Studies byClaessens, Djankov, Fan, and Lang (2002), andLa Porta et al. (1999)show that the separation of control rights and cash flow rights provides the controlling shareholders with both the ability and incentive to expropriate wealth from the firm. In general, larger voting rights entrench the controlling shareholders and give them the capacity to expropriate wealth from the firm, while lower cash flow rights reduce the controlling shareholders' share of firm losses from the expropriation activities. Cash holdings are the most liquid asset that can be expropriated among corporate wealth.
Second, concentrated corporate ownership structure is prevalent around the world, frequently occurring within a family, and Taiwan is no exception (Anderson, Mansi, & Reeb, 2003; Claessens et al., 2002). The conflict of interest between majority and minority shareholders within these family firms is high when the majority shareholder's level of control is large enough to influence a firm's decision-making process.Yeh et al. (2001)argue that the family-controlled shareholders may force the firm to adopt policies that fit their personal interests rather than those of the minority shareholders. Therefore, this study observes how the excess control rights influence the way a firm with high concentrated ownership makes cash decisions.
Using a sample of Taiwanese publicly listed companies in the Taiwan Economic Journal (TEJ) database from 1997 to 2009, this paper examines the effects of excess control rights on corporate cash policy among firms with different levels of cash holdings.
Prior studies measure control rights by focusing on firms with differential voting rights (Chong, 2009; Claessens et al., 2002; Du &
Dai, 2005; Fan & Wong, 2002; Marchica & Mura, 2005). The models in this study develop two indexes of excess control rights. One focuses on the difference between voting and cash flow rights, and the other observes the difference between seat control and cash flow rights. Additionally, the empirical distributions of the dependent variable“cash holdings” are highly skewed to the right; quantile regression is more robust to depart from normality and skewed tails (Mata & Machado, 1996). Therefore, this study applies the quantile regression method to investigate the impact of excess control rights on corporate cash policies.
Empirical findings indicate that there are fewer agency conflict problems in low cash holding firms where less excess control rights affect cash holdings positively; however, in high cash holding firms, excess control rights affect the cash holdings negatively. Specifically, the significantly positive effects in high cash holding firms are stronger than the significantly negative effects in low cash holding firms. Using seat control rights as a control rights measure obtains similar results. Furthermore, founding families can exert further influence on the corporate cash policy by holding the CEO position. When family members in low cash holding firms hold the CEO position, cash holding is higher compared to firms with outside CEOs. However, family members holding the CEO position affects cash holdings negatively in high cash holding firms.
The rest of the paper is organized as follows.Section 2includes theories and empirical hypotheses on the determination of corporate cash holdings.Section 3presents the empirical design and variable descriptions.Section 4reports analysis results, and Section 5offers a conclusion.
2. Theories and empirical hypothesis
Current literature on corporate cash holdings emphasizes three theories: the trade-off theory, the financial hierarchy theory, and the agency theory. The trade-off theory of cash holdings argues that firms have two motives to hold cash: transaction and precaution. The former suggests that firms that are likely to incur high transaction costs hold more liquid assets (Keynes, 1936), while the latter suggests that firms hold cash to better cope with adverse shocks when access to capital markets is costly. From the
precautionary and transaction motive viewpoint, firms accumulate cash to meet their unanticipated contingencies if the costs of other financing resources are high (Bernstein, 1994; Han & Qiu, 2007).
The financial hierarchy theory of cash holdings suggests that raising external financing is more costly in the presence of asymmetric information between firms and external investors (Myers & Majluf, 1984). Therefore, managers try to minimize the costs associated with external financing in imperfect capital markets and find it optimal to maintain sufficient internal financial flexibility. Financial flexibility enables managers to have sufficient financial slack so that financing is quickly available for good investments. In other words, managers tend to hold large cash reserves to help cope with unexpected adversity, during which access to capital markets is costly (Kim, Mauer, & Sherman, 1998).
To maintain a corporate competitive advantage, shareholders are thus in a trade-off position between facing the agency problem of excess cash and losing the opportunities of higher returns. Typically, the agency costs that result from the firm's inefficient choices when dealing with excess cash increase with the excess control rights (Bebchuk et al., 1999). Studies by Claessens et al. (2002)andLa Porta et al. (1999)show that excess control rights provide the controlling shareholders with both the ability and incentive to expropriate wealth from the firm. Therefore, if conflicts of interest between controlling shareholders and minority shareholders are less likely to occur, shareholders can allow firms to hold higher level of cash to invest in valuable projects and avoid costly external financing. Consequently, according to the trade-off theory and financial hierarchy theory, this study expects low cash holding firms with less excess control rights to maintain a higher level of cash holdings.
Hypothesis 1. The less the excess control rights, the higher the cash holdings held in low cash holding firms.
Alternatively, the disadvantage of having financial flexibility is that when the shareholders' control of managers is less effective, excess cash holdings may force managers to overinvest and therefore expropriate the interests of shareholders (Dittmar, Mahrt-Smith, & Servaes, 2003; Easterbrook, 1984; Jensen, 1986). Ineffective control of managers by shareholders mainly comes from more excess control rights (Shleifer and Vishny, 1997). Agency literature suggests that aligning the interests of controlling and minority shareholders mitigates the agency problem of free cash flows. This, in turn, implies that effective corporate governance can mitigate this problem by decreasing the level of cash holdings. Therefore, the impact of effective corporate governance on cash holdings will be negative for firms with large cash holdings. Accordingly, this study expects a positive relationship between the excess control rights and cash holdings for high cash holding firms.
Hypothesis 2. The fewer the excess control rights, the lower the cash holdings held in high cash holding firms.
Traditional finance theory asserts that managers have sufficient financial leeway so that financing is quickly available for good investments (Jensen, 1986; Myers & Majluf, 1984). Family-controlled firms typically concern themselves with the family legacy, and minority shareholders monitor them less. Therefore, a family member as CEO in a family-controlled firm has more incentive to reserve a large cash flow, which is not only for future investment opportunities, but is also for flexibility in capital market discipline. The study expects there to be a positive relationship between family CEO and cash holdings in low cash holding firms.
Hypothesis 3. Family members holding the CEO position affects cash holdings positively in low cash holding firms.
In contrast, excess cash in high cash holding firms enables managers to pursue their own interests, spending on unnecessary expenses and unprofitable investments (Jensen, 1986; Jensen & Meckling, 1976). Therefore, family CEO in high cash holding firms mitigates the agency problem of free cash flows by decreasing the level of cash holdings. This implies that when family members hold the CEO position in high cash holding firms, cash holding is lower than firms with outsiders as CEOs.
Hypothesis 4. Family members holding the CEO position affects cash holdings negatively in high cash holding firms.
3. Methodology and data description 3.1. Research methodology
This study relates effective corporate governance to the cash policy in firms with different levels of cash holdings, and explores the possible decision-making factors that can explain the cash policy. General regression methods, such as OLS or the fixed-effect estimator, focus only on the central tendency of the distribution, which does not allow for the possibility that the impact of explanatory variables can be different for different level of cash holdings. The innovation of this study is that it investigates the impact of the excess control rights variables on different distributions of firm cash holdings by quantile regression. An additional advantage of using quantile regression is that it can mitigate some statistical problems, such as sensitivity to outliers and non- Gaussian error distribution (Barnes & Hughes, 2002). This study estimates the coefficients at five quantiles, namely the 10th, 25th, 50th, 75th, and 90th quantiles, using the same list of governance and control variables. It is expected that different effects of the explanatory variables at the different quantiles are reflected in the size, sign, and significance of estimated coefficients of the different variables.
Since cash holdings and corporate governance determinations are simultaneous, modeling the relationship between the two can be problematic if there is no proper treatment for the endogeneity which occurs. FollowingHarford et al. (2008), this study
examines whether the lagged value of the firm's cash holdings and governance variables is related to a firm's future cash holdings.
Additionally, this study employs the general regression method to compare the results of quantile regressions. The Hausman specification test enables the differentiation between random and fixed effects models by testing for correlation between explanation variables and the individual random effects. The results of Hausman test (P-value = 0) suggest the adoption of a fixed effects model. Consequently, this analysis reports fixed effects estimation to control for the endogenous problem and provides a comparison of the results of quantile regressions.
3.1.1. Cash holding
The dependent variable, cash holdings, is the ratio of cash and cash equivalents to the net assets of cash, which is similar to the definitions byHarford et al. (2008). Independent variables measure the efficacy of corporate governance in firms with different levels of cash holdings and include excess control rights and other governance variables. The following defines the independent variables within each classification.
3.1.2. Excess control rights
Two indexes measure the excess control rights: Separation1 and Separation2. Separation1 is the difference between voting and cash flow rights, while Separation2 is the difference between seat control and cash flow rights.
This study constructs the voting rights of Separation1 followingLa Porta et al.'s (1999)concept and method, adding together the direct and indirect voting rights of controlling shareholders in a firm's control chain. The direct voting right is the shares registered in the names of controlling shareholders or their family members, while the indirect voting right is the shares held by the entities the controlling shareholders control. The detailed calculations of voting right are as follows:
Suppose that a controlling shareholder owns 15% of the stock in publicly traded Firm B. The same shareholder has 30% in Firm A, which in turn has 20% of the stock in Firm B. The controlling shareholder's voting rights in Firm B are 35%, which is the sum of 15%
(the direct voting rights) and 20% (the indirect voting rights through Firm A).
Cash flow rights also contain the direct and indirect ownership of controlling shareholders. The direct cash flow right is the shares of a company registered in the names of ultimate owners or their family members. The indirect cash flow right is the shares of a firm held by other entities the controlling shareholders control. The company holds the entities’ shares; thus, the indirect cash flow right is the product of the two ownership stakes along the chain. The following procedure illustrates the detailed calculations of cash flow rights using the aforementioned example:
The controlling shareholder holds 15% in direct cashflow rights in Firm B. In contrast, the indirect cash flow rights through Firm A for the same shareholder are 6%, which equals the products of 30% and 20%. Therefore, the sum of cashflow rights in Firm B is 21%.
For Separation2, seat control rights are considered another proxy of control rights. The controlling shareholders can be directors or supervisors of a firm in their name or in the names of other entities they own. The seat control rights are thus defined as the number of board seats held by controlling shareholders through a direct or indirect way divided by the total number of board seats.
Suppose Firm B has 15 directors and 3 supervisors. Among them, 12 directors and 2 supervisors directly or indirectly come from a controlling shareholder. Thus, the seat control rights of the controlling shareholder in Firm B are 77.78% (14/18).
This study measures separation by two kinds of control rights to provide a complete characterization of control patterns in Taiwanese companies. Through the use of cross-shareholdings and pyramids, controlling shareholders usually enjoy control rights by comparative advantage in shareholdings. In addition, controlling shareholders usually assign relatives or representatives to the board in order to increase their influence over the board through relative dominance in board voting.
3.1.3. Governance variables
The governance variables include institutional ownership, pledge rate, and three types of board structure variables in addition to the separation of control and cash flow rights. Institution ownership is the ratio of shares that institutions own in the firm divided by the total number of outstanding shares. Pledge is the percentage of ownership-in-pledge of director and supervisor shareholdings, and represents the proportion of shareholdings that directors use as collateral for their personal borrowing.
Consistent with research regarding cash holdings (Chen & Chuang, 2008; Harford et al., 2008), this study employs four board structure variables: Board Size, Board Independence, Chair Duality, and FamilyCEO. Board Size is the number of directors and Board Independence is the ratio of independent directors and supervisors to the total number of directors and supervisors. Chair Duality equals one if the chairman of the board is also the general manager; otherwise, it equals zero. FamilyCEO is a dummy variable that has a value of 1 when the CEO belongs to the family and takes a value of 0 when the CEO is not a member of the family.
3.1.4. Control variables
Given that cash holdings are firm-specific, this study includes control variables to control for firm-specific effects. Following Harford et al. (2008), control variables in this study include firm size, leverage, Market-to-Book ratio, the ratio of cash flow to total assets, the ratio of net working capital to total assets, the ratio of R&D to sales, the ratio of capital expenditures to assets, dividend dummy, and rating indicator. The Taiwan Credit Risk Index (TCRI) in the Corporate Governance database of the TEJ is the rating indicator, which measures the credit risk of a firm. This index takes on values from one to ten, where one indicates the lowest credit risk level.
Size is the logarithm of total assets and leverage is the ratio of total debts to total assets. The proxy of growth opportunities, or the Market-to-Book ratio, is the market value of equity to its book value. The Cash Flow ratio is the ratio of the operating income (loss) to the non-cash assets. The proxy for liquidity, or the net Working Capital ratio, is the ratio of net working capital (current assets minus current liabilities) to the non-cash assets. R&D is the ratio of research and development expenditures to sales. The Capital Expenditure ratio is the value of capital expenditures to non-cash assets, where capital expenditures are the sum of changes in fixed assets and depreciation. Finally, the Dividend equals one if firms pay cash dividends in a given year, and equals zero, otherwise.
3.2. Data description
This study uses Taiwan's corporate governance data in the TEJ database from 1997 to 2009. FollowingHarford et al. (2008), the analysis excludes financial services industries (ISIC codes 2801–2899, 5801–5899, 6001–6099, 6801–6899 and 8701–8799). The final sample consists of 1216 firms over the sample period, that is, a total of 9792 firm–year observations.
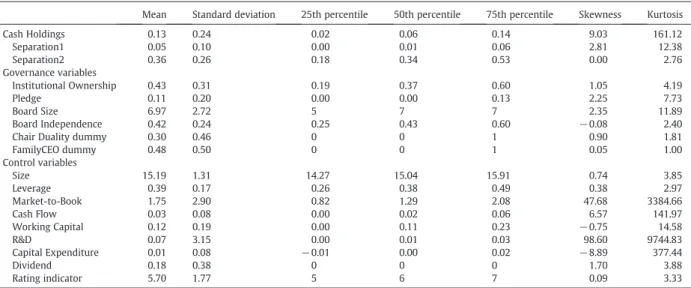
Table 1presents summary statistics. InTable 1, cash holdings have a mean of 13% and a median of 6% out of the total net assets.
Furthermore, cash holdings are significantly skewed to the right, meaning that they have long right tails. The distribution of cash holding raises the efficiency of quantile regression. The average Separation1 is 5% and the average Separation2 is 36%. For publicly traded companies in Taiwan, the average institutional shareholdings are 43% and the percentage of ownership-in-pledge to director and supervisor shareholdings is 11%. In terms of the board structure characteristics in Taiwan, firms have about 7 directors with about 42% independent directors and supervisors on the board. Founding families on average hold 48% of the firms with family members serving as CEO.
Table 2presents univariate comparisons of corporate governance variables by cash-to-assets quartile. This study addresses whether the characteristics of firms which hold high cash holdings, such as those firms in the fourth quartile, differ from those with low cash holdings, such as those in the first quartile. It also tests the hypothesis that the fourth-quartile firms differ significantly from the first-quartile firms using a t-test.
The univariate relation between cash and Separation1 is not monotonic, and Separation1 is about 5% in each quartile.
Separation2 decreases monotonically with cash holdings. The average level of Separation2 decreases over the first three quartiles, and then falls to lowest level in the high cash holding firms. Moreover, the average Separation2 in low cash holding firms is significantly higher than that in high cash holding firms.
For publicly traded firms in Taiwan, the average percentage of ownership-in-pledge decreases monotonically with cash holdings. Pledge rate is 17.2% for low cash holding firms, which is significantly higher than that for high cash holding firms.
Director or supervisor shareholdings in pledge for loans and credits are more common in the low cash holding firms than in the high cash holding firms. On average, there are 34.5% independent directors and supervisors in low cash holding firms, which is
Table 1
Descriptive statistics.
Mean Standard deviation 25th percentile 50th percentile 75th percentile Skewness Kurtosis
Cash Holdings 0.13 0.24 0.02 0.06 0.14 9.03 161.12
Separation1 0.05 0.10 0.00 0.01 0.06 2.81 12.38
Separation2 0.36 0.26 0.18 0.34 0.53 0.00 2.76
Governance variables
Institutional Ownership 0.43 0.31 0.19 0.37 0.60 1.05 4.19
Pledge 0.11 0.20 0.00 0.00 0.13 2.25 7.73
Board Size 6.97 2.72 5 7 7 2.35 11.89
Board Independence 0.42 0.24 0.25 0.43 0.60 −0.08 2.40
Chair Duality dummy 0.30 0.46 0 0 1 0.90 1.81
FamilyCEO dummy 0.48 0.50 0 0 1 0.05 1.00
Control variables
Size 15.19 1.31 14.27 15.04 15.91 0.74 3.85
Leverage 0.39 0.17 0.26 0.38 0.49 0.38 2.97
Market-to-Book 1.75 2.90 0.82 1.29 2.08 47.68 3384.66
Cash Flow 0.03 0.08 0.00 0.02 0.06 6.57 141.97
Working Capital 0.12 0.19 0.00 0.11 0.23 −0.75 14.58
R&D 0.07 3.15 0.00 0.01 0.03 98.60 9744.83
Capital Expenditure 0.01 0.08 −0.01 0.00 0.02 −8.89 377.44
Dividend 0.18 0.38 0 0 0 1.70 3.88
Rating indicator 5.70 1.77 5 6 7 0.09 3.33
significantly lower than in high cash holding firms. Furthermore, low cash holding firms have a larger Board Size, significantly bigger than those of high cash holding firms. The average ratio of founding families as CEO in high cash holding firms is significantly higher than that for low cash holding firms.
4. Empirical analysis
The presence of excess control rights noticeably impacts corporate cash holding decisions (Kuan, Li, & Chu, 2011). To clearly identify the effect of the excess control rights on the different levels of cash holdings, this study performs quantile regressions for the different cash endowment firms.Tables 3 and 4list the empirical results of Separation1 and Separation2 on corporate cash policy, respectively.
Table 2
Firm characteristics by cash holding quartiles.
First quartile Second quartile Third quartile Fourth quartile p-value of Wilcoxon test (fourth quantile−first quantile)
Separation1 0.054 0.052 0.051 0.055 0.893
(0.097) (0.092) (0.091) (0.089)
Separation2 0.409 0.347 0.333 0.322 b0.01
(0.261) (0.258) (0.246) (0.242)
Institutional Ownership 0.445 0.411 0.426 0.454 0.478
(0.305) (0.298) (0.300) (0.324)
Pledge 0.172 0.110 0.078 0.057 b0.01
(0.247) (0.195) (0.165) (0.137)
Board Size 7.428 6.862 6.737 6.890 b0.01
(3.475) (2.528) (2.271) (2.347)
Board Independence 0.345 0.404 0.444 0.473 b0.01
(0.237) (0.228) (0.227) (0.217)
Chair Duality dummy 0.299 0.269 0.310 0.315 0.337
(0.458) (0.444) (0.463) (0.465)
FamilyCEO dummy 0.471 0.478 0.478 0.498 b0.05
(0.499) (0.500) (0.500) (0.500)
Notes: Standard deviations are reported in parentheses. The t-statistic is for a difference of means test from the first to the fourth quartile.
Table 3
Regression results with cash holdings and separation of voting rights and cash flow rights (Separation1).
Dependent variable: cash holdings
Fixed effect Quantile regressions
10th quant 25th quant 50th quant 75th quant 90th quant
Separation1(t− 1) −0.018 −0.007** −0.009** −0.003 0.019** 0.026**
(0.040) (0.003) (0.003) (0.004) (0.009) (0.014)
Cash Holdings(t− 1) 0.334*** 0.241*** 0.484*** 0.755*** 1.012*** 1.224***
(0.009) (0.002) (0.001) (0.002) (0.004) (0.006)
Governance variables
Institution Ownership(t− 1) −0.005 −0.001 0.000 0.002* 0.005* 0.007*
(0.010) (0.001) (0.001) (0.001) (0.003) (0.005)
Pledge(t− 1) −0.029*** −0.002* −0.004*** −0.005** −0.004 −0.016***
(0.011) (0.001) (0.001) (0.002) (0.004) (0.007)
Board Size(t− 1) 0.001 0.000 0.000 0.000 −0.001** −0.001***
(0.001) (0.000) (0.000) (0.000) (0.000) (0.000)
Board Independence(t− 1) 0.015 0.007*** 0.006*** 0.009*** 0.017*** 0.015***
(0.012) (0.001) (0.001) (0.002) (0.004) (0.006)
Chair Duality dummy(t− 1) 0.014*** 0.000 −0.001* 0.000 0.001 −0.002
(0.005) (0.001) (0.001) (0.001) (0.002) (0.003)
Control variablesa Yes Yes Yes Yes Yes Yes
Intercept 0.221*** 0.025*** 0.025*** 0.041*** 0.063*** 0.145***
(0.068) (0.005) (0.005) (0.007) (0.015) (0.025)
Pseudo R2 Within R2 = 0.313 0.143 0.247 0.378 0.491 0.568
Between R2= 0.682 Overall R2= 0.489
Note: The numbers in the parentheses are bootstrap standard errors (quantile) and standard errors (fixed effect). ***, **, and * indicate significance at the 1%, 5%, and 10% levels, respectively. 1000 bootstrap replications are used in the quantile regressions. Standard deviations are reported in parentheses.
a Control variables include size, leverage, market to book, cash flow, working capital, dividend, R & D, capital expenditure, and rating indicator.
4.1. Causal effects of the excess control rights on cash holdings
Table 3presents the results of empirical research of Separation1 on corporate cash policy. The first column inTable 3lists the fixed-effect estimates. The fixed-effect results suggest that pledge rate and CEO duality are associated with cash holding level while Separation1 is statistically insignificant. However, the fixed-effect estimator focuses only on the central tendency of the distribution, but does not show the impact of explanatory variables on corporate cash policy for high and low cash holding firms.
Therefore, this study employs the conditional quantile estimates reported inTable 3(columns 2–6).
The principal variable, Separation1, is significantly negative in relation to cash holdings at lower levels (10th and 25th quantiles), but becomes significantly positive at the two highest quantiles (75th and 90th) of the distribution. The negative sign for low cash holding firms supports hypothesisHypothesis 1that the fewer the excess control rights, the higher the proportion of cash holdings in corporate assets. This evidence, consistent with the trade-off theory and financial hierarchy theory, suggests that when the conflicts of interest between controlling shareholders and minority shareholders are not severe, low cash holding firms have a strong desire to hold more cash to avoid the higher costs of external financing.
Alternatively, for high cash holding firms, the positive sign of Separation1 supports hypothesisHypothesis 2that the fewer the excess control rights, the lower the levels of cash holdings in firms. This evidence, consistent with the agency theory of free cash flow, suggests that lower agency conflicts between controlling shareholders and minority shareholders reduce the level of cash holdings to mitigate the agency problem of free cash flows.
Furthermore, the significantly positive effects on the upper quantiles are stronger than the significantly negative effects on the lower quantiles. Stronger significant effects in the high cash holding firms imply that the agency theory of free cash flows dominates the financial hierarchy theory when explaining corporate cash policy.
As for other corporate governance variables, Board Independence does not significantly influence cash holdings from the fixed-effect results. However, the quantile estimated coefficients for all quantiles are significant.
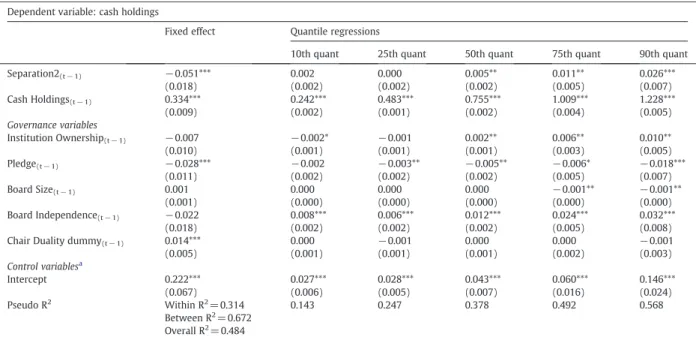
Next, this study uses Separation2 as a proxy for the excess control rights and cash flow rights.Table 4shows the empirical results. In the results of the fixed-effect model, Separation2 is significantly and positively related to the levels of cash holdings.
However, the quantile estimated coefficients of Separation2 for the 50th, 75th, and 90th quantiles are significantly positive, while those for the 10th and 25th quantiles are insignificant. Moreover, quantile causal effects of Separation2 are stronger in the upper quantiles than in the lower quantiles.
When using seat control rights as the control right proxy, the causal effect on corporate cash holdings becomes insignificant in low cash holding firms. However, for high cash holding firms, minority shareholders mitigate the agency problem of free cash flows by lowering the level of cash holdings. The findings inTable 4are consistent with those inTable 3and demonstrate that the agency theory of free cash flow mainly explains corporate cash policy.
Table 4
Regression results with cash holdings and separation of seat control rights and cash flow rights (Separation2).
Dependent variable: cash holdings
Fixed effect Quantile regressions
10th quant 25th quant 50th quant 75th quant 90th quant
Separation2(t− 1) −0.051*** 0.002 0.000 0.005** 0.011** 0.026***
(0.018) (0.002) (0.002) (0.002) (0.005) (0.007)
Cash Holdings(t− 1) 0.334*** 0.242*** 0.483*** 0.755*** 1.009*** 1.228***
(0.009) (0.002) (0.001) (0.002) (0.004) (0.005)
Governance variables
Institution Ownership(t− 1) −0.007 −0.002* −0.001 0.002** 0.006** 0.010**
(0.010) (0.001) (0.001) (0.001) (0.003) (0.005)
Pledge(t− 1) −0.028*** −0.002 −0.003** −0.005** −0.006* −0.018***
(0.011) (0.002) (0.002) (0.002) (0.005) (0.007)
Board Size(t− 1) 0.001 0.000 0.000 0.000 −0.001** −0.001**
(0.001) (0.000) (0.000) (0.000) (0.000) (0.000)
Board Independence(t− 1) −0.022 0.008*** 0.006*** 0.012*** 0.024*** 0.032***
(0.018) (0.002) (0.002) (0.002) (0.005) (0.008)
Chair Duality dummy(t− 1) 0.014*** 0.000 −0.001 0.000 0.000 −0.001
(0.005) (0.001) (0.001) (0.001) (0.002) (0.003)
Control variablesa
Intercept 0.222*** 0.027*** 0.028*** 0.043*** 0.060*** 0.146***
(0.067) (0.006) (0.005) (0.007) (0.016) (0.024)
Pseudo R2 Within R2= 0.314 0.143 0.247 0.378 0.492 0.568
Between R2= 0.672 Overall R2= 0.484
Note: The numbers in the parentheses are bootstrap standard errors (quantile) and standard errors (fixed effect). ***, **, and * indicate significance at the 1%, 5%, and 10% levels, respectively. 1000 bootstrap replications are used in the quantile regressions. Standard deviations are reported in parentheses.
a Control variables include size, leverage, market to book, cash flow, working capital, dividend, R & D, capital expenditure, and rating indicator.
The quantile estimated coefficients on Board Independence show a similar significantly positive relationship between independent board and cash holdings inTable 3. Pledge affects cash holdings in the fixed-effect model, but only in high cash holding firms (25th, 50th, 75th and 90th).
4.2. Comparison offirms with various pairs of quantiles
In order to check the significance of the differences with regard to the coefficients of Separation1 and Separation2 across different cash holding quantiles, this study employs a bootstrap procedure which is extended to construct a joint distribution to test various pairs of quantiles (Chuang, Kuan, & Lin, 2009; Li, Sun, & Zou, 2009).Tables 5 and 6illustrate the F-tests and the associated p-values for the equality of quantile slope coefficients across the various pairs of quantiles with regard to the coefficients of Separation1 and Separation2, respectively. Following previous studies, these tests are based on the bootstrap standard errors using 1000 replications. The results of F-tests reject the null hypothesis of the equality coefficients of Separation1 for pairs of quantiles: (10th, 90th), (10th, 75th), (25th, 75th), and (50th, 75th), as shown inTable 5. These results indicate that the impacts of Separation1 on cash policies differ between high cash holding and low cash holding firms. In contrast,Table 6indicates that although coefficients in the 10th and 25th quantiles become insignificant, the F-tests suggest significant differences across lower and upper quantiles, with the exception of (10th, 25th) and (10th, 50th).
Finally, this study plots the estimated coefficients of Separation1 against the various quantiles (solid line) and their 95%
confidence intervals (in shaded area), together with the fixed-effect estimate (dashed line) inFig. 1. The fixed-effect estimate of Separation1 is negative but insignificantly different from zero. This suggests no causality in mean of cash holdings and excess control rights. The quantile regression estimates of Separation1 vary with quantiles and show an interesting pattern. First, quantile regression estimates are significantly negative at lower quantiles but significantly positive in upper quantiles. With Separation1 on the vertical axis and Cash Holdings on the horizontal axis, the quantile causal effects between cash holdings and Separation1 exhibit symmetrical V-shape relations. Second, quantile causal effects are stronger in upper quantiles.
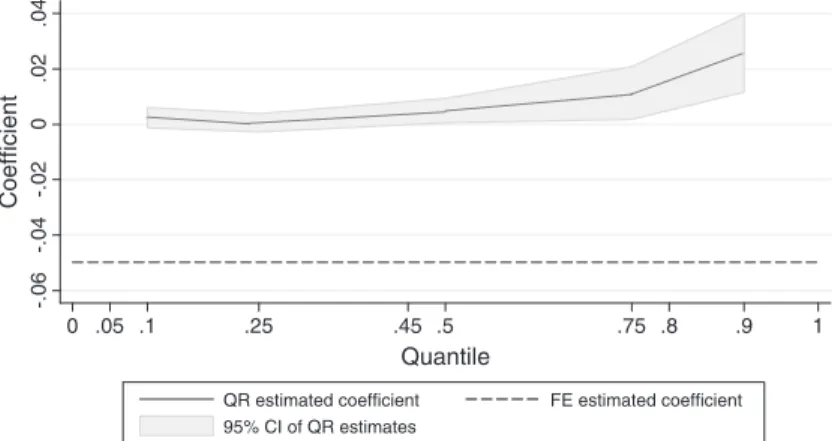
With Separation2 on the vertical axis and Cash Holdings on the horizontal axis, the quantile causal effects of Separation2 on cash holdings still exhibit a symmetrical V-shape (as shown inFig. 2). Similarly, quantile effects of Separation2 on cash holdings are stronger in upper quantiles.
Table 5
Interquantile comparison of the coefficient of Separation1.
Quantile regressions
10th quant 25th quant 50th quant 75th quant 90th quant
10th quant 0.11 0.76 4.96** 2.76*
(0.741) (0.385) (0.026) (0.097)
25th quant 0.51 4.66** 2.42
(0.473) (0.031) (0.120)
50th quant 4.39** 2.26
(0.036) (0.133)
75th quant 0.20
(0.651) Note: This table reports the F-tests and the associated p-values (parentheses) for the equality of quantile slope coefficients of Separation1 across the various pairs of quantiles. **, and * indicate significance at the 1%, 5%, and 10% levels, respectively. 1000 bootstrap replications are used in the quantile regressions.
Table 6
Interquantile comparison of the coefficient of Separation2.
Quantile regressions
10th quant 25th quant 50th quant 75th quant 90th quant
10th quant 0.98 0.99 3.59* 7.31***
(0.323) (0.320) (0.058) (0.007)
25th quant 4.25** 5.36** 9.97***
(0.039) (0.021) (0.002)
50th quant 2.76* 7.14***
(0.097) (0.008)
75th quant 4.45**
(0.035) Note: This table reports the F-tests and the associated p-values (parentheses) for the equality of quantile slope coefficients of Separation2 across the various pairs of quantiles. ***, **, and * indicate significance at the 1%, 5%, and 10% levels, respectively. 1000 bootstrap replications are used in the quantile regressions.
4.3. The effect of founding family CEO on cash holding
Chen and Chuang (2008)andAnderson et al. (2003)suggest that firm founders and founding family members as CEOs have differing impacts on corporate financial policy. Therefore, this paper explores the influence of founding family CEO among firms with different levels of cash holdings. To investigate the impact of CEO affiliation on different distributions of firm cash holdings, this study further adds dummy variables for founding family CEO to the quantile models.
Table 7presents the results of FamilyCEO on corporate cash policy. The first column inTable 7 displays the fixed-effect estimates and indicates that a family member as CEO is positively related to cash holding levels. Specifically, the results of quantile estimates in columns 2–6 ofTable 7 also reveal that a family member as CEO is associated with cash holding level. More importantly, this study finds that having a family member be CEO is significantly positive in relation to cash holdings at lower levels (10th quantile) of cash holdings, but becomes significantly negative at the two highest quantiles (75th and 90th) of the distribution. The positive sign for low cash holding firms supports hypothesisHypothesis 3that family members holding CEO positions affects cash holdings positively in low cash holding firms. This evidence, consistent with the trade-off theory and financial hierarchy theory, suggests that firms with family members as CEO hold more cash to avoid the higher costs of external financing. Alternatively, for high cash holding firms, the negative sign of FamilyCEO supports hypothesis Hypothesis 2and indicates that firms with family members as CEO reduce the level of cash holdings to mitigate the agency problem of free cash flows.
Table 8presents the empirical results of FamilyCEO on corporate cash policy when using seat control rights as another control rights measure. The empirical findings of the relation between a family member as CEO and cash holding are the same as those in Table 7.
5. Discussion and conclusion
This study investigates the role of ownership and control structure in firms by determining their cash holdings and focuses mainly on the association between the excess control rights and cash holdings. Prior research points to conflicts of interest
-.020.02.04.06Coefficient
0 .05 .1 .25 .5 .75 .85 .9 1
Quantile
QR estimated coefficient FE estimated coefficient 95% CI of QR estimates
Fig. 1. Quantile and fixed-effect estimates of the effects of Separation1 on cash holdings.
-.06-.04-.020.02.04Coefficient
0 .05 .1 .25 .45 .5 .75 .8 .9 1
Quantile
QR estimated coefficient FE estimated coefficient 95% CI of QR estimates
Fig. 2. Quantile and fixed-effect estimates of the effects of Separation2 on cash holdings.
between controlling and minority shareholders which arise from excess control rights, but the effects of this kind of agency conflict on cash policy are ambiguous. For example,Jensen (1986)argues that controlling shareholders may have incentives to hold large cash balances, which enable them to pursue their own objectives at the expense of shareholders. He suggests that Table 7
The effects of family CEO on cash holdings using voting rights as control right variable.
Dependent variable: cash holdings
Fixed effect Quantile regressions
10th quant 25th quant 50th quant 75th quant 90th quant
Separation1(t− 1) −0.017 −0.007** −0.006*** −0.003 0.021** 0.026*
(0.040) (0.003) (0.001) (0.004) (0.009) (0.015)
Cash Holdings(t− 1) 0.334*** 0.24*** 0.483** 0.752*** 1.010*** 1.229***
(0.009) (0.002) (0.003) (0.002) (0.004) (0.006)
Governance variables
Institution Ownership(t− 1) −0.005 −0.001 0.000 0.002 0.004 0.004
(0.010) (0.001) (0.001) (0.001) (0.003) (0.005)
Pledge(t− 1) −0.029*** −0.002 −0.004** −0.005** −0.005 −0.016**
(0.011) (0.001) (0.001) (0.002) (0.005) (0.008)
Board Size(t− 1) 0.001 −0.001 0.000 0.000 −0.001** −0.001**
(0.001) (0.000) (0.000) (0.000) (0.000) (0.001)
Board Independence(t− 1) 0.015 0.007*** 0.006*** 0.008*** 0.017*** 0.014**
(0.012) (0.001) (0.001) (0.002) (0.004) (0.006)
Chair Duality dummy(t− 1) 0.014*** −0.001 −0.001 0.000 0.000 0.000
(0.005) (0.001) (0.001) (0.001) (0.002) (0.003)
FamilyCEO dummy(t− 1) 0.016*** 0.002** 0.000 −0.001 −0.004** −0.011***
(0.005) (0.001) (0.001) (0.001) (0.002) (0.003)
Control variablesa Yes Yes Yes Yes Yes Yes
Intercept 0.214*** 0.026*** 0.026*** 0.042*** 0.065*** 0.148***
(0.069) (0.005) (0.005) (0.007) (0.016) (0.027)
Pseudo R2 Within R2= 0.314 0.143 0.247 0.377 0.491 0.567
Between R2= 0.678 Overall R2= 0.488
Note: The numbers in the parentheses are bootstrap standard errors (quantile) and standard errors (fixed effect). ***, **, and * indicate significance at the 1%, 5%, and 10% levels, respectively. 1000 bootstrap replications are used in the quantile regressions. Standard deviations are reported in parentheses.
a Control variables include size, leverage, market to book, cash flow, working capital, dividend, R & D, capital expenditure, and rating indicator.
Table 8
The effects of family CEO on cash holdings using seat control rights as control right variable.
Dependent variable: cash holdings
Fixed effect Quantile regressions
10th quant 25th quant 50th quant 75th quant 90th quant
Separation2(t− 1) −0.051*** 0.003 0.001*** 0.005** 0.010** 0.024***
(0.018) (0.002) (0.002) (0.004) (0.009) (0.015)
Cash Holdings(t− 1) 0.334*** 0.240*** 0.483** 0.753*** 1.008*** 1.227***
(0.009) (0.002) (0.001) (0.002) (0.004) (0.006)
Governance variables
Institution Ownership(t− 1) −0.008 −0.002 −0.001 0.002 0.006* 0.004*
(0.010) (0.001) (0.001) (0.001) (0.003) (0.005)
Pledge(t− 1)) −0.028** −0.0017 −0.004** −0.005** −0.007** −0.019***
(0.011) (0.002) (0.002) (0.002) (0.005) (0.008)
Board Size(t− 1) 0.001 −0.001 −0.001 −0.001 −0.001** −0.001**
(0.001) (0.000) (0.000) (0.000) (0.000) (0.001)
Board Independence(t− 1) −0.022 0.008*** 0.006*** 0.012*** 0.022*** 0.014***
(0.018) (0.002) (0.002) (0.002) (0.004) (0.006)
Chair Duality dummy(t− 1) 0.014*** −0.001 −0.001 0.000 0.000 0.000
(0.005) (0.001) (0.001) (0.001) (0.002) (0.003)
FamilyCEO dummy(t− 1) 0.006** 0.002*** 0.000 −0.001 −0.004** −0.009***
(0.005) (0.001) (0.001) (0.001) (0.002) (0.003)
Control variablesa Yes Yes Yes Yes Yes Yes
Intercept 0.214*** 0.0266*** 0.026*** 0.043*** 0.065*** 0.149***
(0.069) (0.006) (0.006) (0.007) (0.016) (0.027)
Pseudo R2 Within R2= 0.314 0.143 0.247 0.377 0.491 0.567
Between R2= 0.668 Overall R2= 0.483
Note: The numbers in the parentheses are bootstrap standard errors (quantile) and standard errors (fixed effect). ***, **, and * indicate significance at the 1%, 5%, and 10% levels, respectively. 1000 bootstrap replications are used in the quantile regressions. Standard deviations are reported in parentheses.
a Control variables include size, leverage, market to book, cash flow, working capital, dividend, R & D, capital expenditure, and rating indicator.
when there is greater agency conflict between controlling and minority shareholders, entrenched managers tend to hold more cash. Therefore, the impact of excess control rights is likely to be positive on cash holdings. However,Harford et al. (2008)find that controlling shareholders may choose to hold more cash to pursue private benefits and thus the relationship between cash holdings and managerial ownership can become negative at higher levels of managerial ownership. This, in turn, implies that the relationship between excess control rights and cash holdings depends on the characteristics of individual firms. This paper, however, distinguishes the relation between cash holding decisions and agency conflicts of firms by using a quantile regression model of cash holdings.
The results shown inTable 3suggest that the excess control rights exert a significant influence on cash holding decisions.
Moreover, the results provide explanations for the inconsistent relationship between the excess control rights and cash holdings.
Less excess control rights can cause firms to hold higher or lower levels of cash, depending on the levels of cash holdings they own. When the levels of cash holdings they own are low, additional excess control rights reduce cash holdings. This is support for the notion that when the interests of managers and shareholders are aligned, shareholders allow firms to hold more cash in order to take advantage of further investment opportunities. This finding is in line with the trade-off theory, which places more emphasis on the costs arising from foregone investment opportunities. According to this approach, firms accumulate cash to meet their unanticipated contingencies and to finance their investments if the costs of other funding sources are prohibitively high.
In contrast, the estimated coefficient of Separation1 is positive and statistically significant in high cash holding firms. This, in turn, can provide some explanation for the positive impact of excess control rights on cash holdings at somewhat higher levels.
This result suggests that higher levels of agency conflicts give controlling shareholders more direct control over the firm, increasing their ability to resist outside pressure. Consequently, this evidence supports the agency hypothesis, in which entrenched managers who are relatively free of external discipline choose to hold more cash to pursue their own interests without risking replacement.
Additional analysis reveals that when a family member serves as CEO in low cash holding firms, the cash holding is higher than if an outsider is CEO. However, family members holding the CEO position affects cash holdings negatively in high cash holding firms. These results are in line with the conclusions ofKuan et al. (2011), which show a positive relation between cash holdings and family control.
Investigating only Taiwanese publicly listed firms undeniably has its limitations, the most notable being the generalization of the findings. Therefore, in the future, this study can be further extended to examine how the excess control rights affect corporate cash policy across firms with different levels of cash in East Asian countries, especially as controlling shareholders in East Asia usually enjoy control rights that far exceed their cash flow rights. Future studies along the same line as this study using data from other East Asian countries should eventually provide us with more general conclusions. Despite the limitations, however, the overall findings of this study show strong evidence of a difference in cash decision-making processes among different levels of cash holding firms.
References
Anderson, R., Mansi, S., & Reeb, D. (2003). Founding family ownership and the agency cost of debt. Journal of Financial Economics, 68, 263–285.
Anderson, R., & Reeb, D. (2003). Founding-family ownership and firm performance: Evidence from the S&P 500. Journal of Finance, 58(3), 1301–1328.
Barnes, M. L., & Hughes, A. W. (2002). A quantile regression analysis of the cross section of stock market returns. Working Paper 02–2. Federal Reserve Bank of Boston.
Bebchuk, L. A., Kraakman, R. H., & Triantis, G. G. (1999). Stock pyramids, cross-ownership, and the dual class equity: The creation and agency costs of separating control from cash flow rights. NBER Working Paper, No. W6951.
Bernstein, D. (1994). Imperfect information and agency cost models: Further empirical tests. International Review of Economics and Finance, 3, 183–193.
Chang, K., & Noorbakhsh, A. (2006). Corporate cash holdings, foreign direct investment, and corporate governance. Global Finance Journal, 16, 302–316.
Chen, Y. R. (2008). Corporate governance and cash holdings: Listed new economy versus old economy firms. Corporate Governance: An International Review, 16, 430–442.
Chen, Y. R., & Chuang, W. T. (2008). Alignment or entrenchment corporate governance and cash holdings in growing firms. Journal of Business Research, 62, 1200–1206.
Chen, Y. R., & Ho, C. Y. (2009). The impact of family control and board characteristics on corporate policies. Journal of Management, 26, 1–16.
Chong, B. S. (2009). The impact of divergence in voting and cash-flow rights on the use of bank debt. Pacific-Basin Finance Journal, 18, 158–174.
Chuang, C. C., Kuan, C. M., & Lin, H. Y. (2009). Causality in quantiles and dynamic stock return-volume relations. Journal of Banking and Finance, 33, 1351–1360.
Claessens, S., Djankov, S., Fan, J., & Lang, L. (2002). Disentangling the incentive and entrenchment effects of large shareholdings. Journal of Finance, 57, 2741–2771.
Claessens, S., Djankov, S., & Lang, L. (2000). The separation of ownership and control in East Asian corporations. Journal of Financial Economics, 58, 81–112.
Dittmar, A., Mahrt-Smith, J., & Servaes, H. (2003). International corporate governance and corporate cash holdings. Journal of Financial and Quantitative Analysis, 38, 111–133.
Du, J., & Dai, Y. (2005). Ultimate corporate ownership structures and capital structures: Evidence from East Asian economies. Corporate Governance: An International Review, 13, 60–71.
Easterbrook, F. H. (1984). Two agency-cost explanations of dividends. The American Economic Review, 74, 650–659.
Fan, P. H., & Wong, T. J. (2002). Corporate ownership structure and the informativeness of accounting earnings in East Asia. Journal of Accounting and Economics, 33, 401–425.
Han, S., & Qiu, J. (2007). Corporate precautionary cash holdings. Journal of Corporate Finance, 13, 43–57.
Harford, J., Mansi, A., & Maxwell, W. F. (2008). Corporate governance and firm cash holdings in the US. Journal of Financial Economics, 87, 535–555.
Jensen, M. C. (1986). Agency costs of free cash flow, corporate finance and takeovers. The American Economic Review, 76, 323–331.
Jensen, M. C., & Meckling, W. H. (1976). Theory of the firm: Managerial behavior, agency costs and ownership structure. Journal of Financial Economics, 3, 305–360.
Kalcheva, L., & Lin, K. V. (2007). International evidence on cash holdings and expected managerial agency problems. Review of Financial Studies, 20, 1087–1112.
Keynes, J. M. (1936). The general theory of employment, interest and money. London: Harcourt Brace.
Kim, C. S., Mauer, D. C., & Sherman, A. E. (1998). The determinants of corporate liquidity: Theory and evidence. Journal of Financial and Quantitative Analysis, 33(3), 335–359.
Kuan, T. H., Li, C. S., & Chu, S. H. (2011). Cash holdings and corporate governance in family-controlled firms. Journal of Business Research, 64, 757–764.
La Porta, R., Lopez-De-Silanes, F., & Shleifer, A. (1999). Corporate ownership around the world. Journal of Finance, 54, 471–517.
Li, T., Sun, L., & Zou, L. (2009). State ownership and corporate performance: A quantile regression analysis of Chinese listed companies. China Economic Review, 20, 703–716.
Marchica, M. T., & Mura, R. (2005). Direct and ultimate ownership structures in UK: An intertemporal perspective over the last decade. Corporate Governance: An International Review, 13, 26–45.
Mata, J., & Machado, J. A. F. (1996). Firm start-up size: A conditional quantile approach. European Economic Review, 40, 1305–1323.
Myers, S. C., & Majluf, N. S. (1984). Corporate financing and investment decisions when firms have information that investors do not have. Journal of Financial Economics, 13, 187–221.
Myers, S. C., & Rajan, R. G. (1998). The paradox of liquidity. Quarterly Journal of Economics, 113, 733–771.
Pinkowitz, L., Stulz, R. M., & Williamson, R. (2003). Do firms in countries with poor protection of investor rights hold more cash? NBER Working Paper, No. W10188.
Shleifer, A., & Vishny, R. (1997). A survey of corporate governance. Journal of Finance, 52, 737–783.
Shyu, Y. W., & Lee, C. I. (2009). Excess control rights and debt maturity structure in family-controlled firms. Corporate Governance: An International Review, 17, 611–628.
Yeh, Y. H. (2005). Do controlling shareholders enhance corporate value? Corporate Governance: An International Review, 13, 313–325.
Yeh, Y., Lee, T., & Woidtke, T. (2001). Family control and corporate governance: Evidence from Taiwan. International Review of Finance, 2, 21–48.
Yeh, Y. H., & Woidtke, T. (2005). Commitment or entrenchment? Controlling shareholders and board composition. Journal of Banking and Finance, 29, 1857–1885.