• 沒有找到結果。

Social connections and happiness among the elder population of Taiwan

N/A
N/A
Protected

Academic year: 2021

Share "Social connections and happiness among the elder population of Taiwan"

Copied!
19
0
0

加載中.... (立即查看全文)

全文

(1)

Social Connections and Happiness Among the Elder Population of Taiwan Abstract

Objectives: The purpose of this study was to examine the association between social connections and happiness among members of the elder population of Taiwan.

Methods: Longitudinal panel data collected in three waves from 1999 to 2007 that selected from national samples of Taiwanese older people were used for the analysis (n=4,731 persons). Happiness was defined as a dichotomous variable. Social

connection variables included living arrangements, contacts with

children/grandchildren/parents/relatives/friends, telephone contacts, providing

instrumental and informational support, receiving instrumental and emotional support, and social participation. We controlled for the variables demographics, physical and mental health, economic satisfaction, and lifestyle. A generalized linear model (GLM) was applied in the analysis. Results: Happiness remained stable over time. Receiving more emotional support and participating in social events were related to happiness at the beginning, while the effect of social participation was offset over time. Living arrangements, telephone contacts, providing social support, and receiving

instrumental support were not significant. Conclusion: The quality of social relationships experienced is possibly more important than the quantity of social interaction for older people, and having social relationships outside the informal social network may increase happiness.

Key Words: happiness, older people, social support, social connection, social

participation

(2)

Introduction

Social connections, which have been found to be related to happiness, can be defined as having a network of associates, maintaining contact with others,

experiencing social support, and enjoying a resource of social capital (Cooper, Bebbington, Livingston, 2011; Cooper et al., 2011). The type of social network and the distance between social ties are both significantly related to happiness (Fowler, 2008; Litwin and Shiovitz-Ezra, 2011). Individuals who participate in social groups, or who work or volunteer (Waldinger and Schulz, 2010; Borgonovi, 2008) are more likely to be happy than their peers who do neither. A U-shaped relationship is found between age and happiness (Blanchflower and Oswald, 2008; deRee and Alessie, 2011), indicating that feelings of happiness is greater in elderhood than in one’s younger years. Even so, older people usually maintain smaller social networks and need more support from family than younger adults do.

In the Western society, the individualization is emphasized, and the isolation of older people is one of the elder issues in social care. Compared with the Western culture, in a family-centered culture such as that observed in Taiwan, older people have traditionally relied on support from family on the financial support and the caregiving. Modernization has meant a decrease in family size, and older generations no longer necessarily live with their grown children or other relatives. In addition, the concept of social participation in one’s old age is a new phenomenon in Taiwan, where the concept of successful aging has been promoted only in recent years.

Nevertheless, more and more elders are interested in social participation activities

than previous generations had been. Thus, we are interested in whether social

interaction within families remains the primary source of happiness for elders,

whether social connection with family and friends and the support from them is

(3)

associated with happiness, and whether an active lifestyle in the form of social participation is more related to happiness than previously perceived.

Other factors related to happiness include religiosity and attending religious services (Cooper et al., 2011; Lewis, Maltby, Day, 2005; Stavrova, Fetchenhauer, Schlösser, 2013), participating in daily activities (Oerlemans, Bakker, Veenhoven, 2011), enjoying good physical health (Bishop, Martin, Poon, 2006; Bishop, Martin, MacDonald, Poon, 2010), and choosing a healthy lifestyle, such as not smoking, not drinking alcohol or only moderate drinking, and exercising on a regular basis

(Nyqvist, Finnäs, Jakobsson, Koskinen, 2008; Peiró, 2006; Shahab and West, 2009;

Zander, Passmore, Mason, Rissel,2013). These factors are also important predictors of feelings of subjective well-being among older people.

In this study, we examined the effects of social contacts, giving and receiving social support, social participation, and a healthy lifestyle in relation to happiness, using data from a longitudinal panel data among Taiwanese older people. This study is expected to provide implications for the social care policy for all the aging

societies.

Method

Data and Samples

As noted above, the data used in this study were taken from the Taiwan

Longitudinal Study on Aging (TLSA), which has followed a nationally representative sample of elders who were aged 60 years old or more, since 1989. The initial sample consisted of 4,049 people. A supplemental sample of 2,462 participants was added in the 1996 panel that encompassed the population ranging in age from50 to 66 years.

Six waves of face-to-face interviews were conducted in 1989, 1993, 1996, 1999,

2003, and 2007. The data used in this study were the three waves surveyed in 1999,

(4)

2003, and 2007. In total, the samples numbered 4,731 persons and included 14,193 observations.

Measures

Dependent variable: Happiness

The item happiness is from the Center for Epidemiologic Studies depression scale (Kohout, Berkman, Evans, Cornoni-Huntley, 1993) and was used in asking the participants how often they had felt happy in the past week, with responses ranging from never, seldom, often, and always (scored from 0 to 3). The scores were recoded as 0 (unhappy, indicating never or seldom happy) or 1 (happy, indicating often or always happy).

Social connection variables

Social connection variables included living arrangement, social contacts, social support, and social participation.

1. Living arrangement (alone or with others).

2. Social contacts were measured as having a spouse (yes/no); living with children, parents (including in-laws), or grandchildren (yes/no); meeting with children, parents (in-laws), grandchildren, other relatives, neighbors, or friends every week(yes/no); making telephone contact with family (children, parents, or sisters/brothers) every week.

3. Social support included receiving emotional support, receiving instrumental support, providing instrumental support, and providing informational support.

Receiving emotional support was defined as how participants rated the willingness of their families, relatives, or friends to listen to them, how their contacts

demonstrated caring about the participants, and how satisfied they felt with the

care received from members in their social networks. Responses ranged from the

(5)

lowest level, “not at all” or “very unsatisfied” to the highest level, “very much” or

“very satisfied”; the score for each item ranged from 1 to 5, with 1 corresponding to the lowest level and 5, the highest. Total scores ranged from 3 to 15. Receiving instrumental support was defined as participants’ assessment concerning how much they could rely on families, relatives, or friends when they were ill, or whether anyone could help them when they needed to go shopping or to doctor’s appointments. Each item was answered with yes/no and scored 1/0, with total scores ranging from 0 to 2. Providing instrumental support was defined as whether participants helped care for grandchildren, provided support to families with activities of daily living (ADLs),or instrumental ADLs. Each item was answered yes/no and scored 1/0, with total scores ranging from 0 to 3.Providing

informational support was defined as how much help participants offered to their families, relatives, or friends. Responses ranged from “not much” to “very much”

(with scores ranging from 1 to 3), and how often family members would consult participants’ opinions, with responses ranging from “never” to “all the time” (with scores ranging from 1 to 3). Total scores for each of these two items ranged from 2 to 6.

4. Social participation was defined as whether participants engaged in any volunteer service, worked, or engaged in social communities and was answered with yes/no.

Demographic variables

Demographic variables included age, sex (female/male), marital status (having a

spouse or not), urbanization (living in urban, town, or rural area), education level (in

years), and economic satisfaction. Responses ranged from “very unsatisfied” to “very

satisfied”; scores ranged from 1 to 5.

(6)

Health related variables

1. Disease numbers: the cumulative number of the morbidity from the following diseases was surveyed: hypertension, diabetes mellitus, heart diseases, stroke, cancer, respiratory diseases, arthritis, gastric diseases, liver and gall bladder diseases, and kidney diseases. The score ranged from 0 to 10.

2. Basic physical function score: The basic physical function indicated the difficulty- level scores of the six items of ADLs: bathing, dressing, eating, transferring, walking indoors, and toileting; which ranged from “no difficulty” to “unable to do so”; scores ranged from 0 to 3 for each item, and total scores of the ADLs ranged from 0 to 18.

3. Advanced physical function: Advanced physical function was measured by the eight items of the Nagi scale (Nagi, 1976). These included assessing the difficulty level of standing for 15 minutes, stooping, reaching overhead, grasping with fingers, lifting or carrying 25 pounds, running for 20–30 meters, walking 200–300 meters, and climbing stairs. Each item’s response ranged from “no difficulty” to

“unable to do so”; scores ranged from 0 to 3. The total score ranged from 0 to 24.

Psychological health and well-being

Depressive symptoms were measured using the eight items from the Center for Epidemiologic Studies depression scale (Kohout et al., 1993), including “my appetite was poor,” “everything I did was an effort,” “my sleep was restless,” “felt depressed,”

“felt lonely,” “people were unfriendly,” “felt sad,” and “could not get going.”

Responses ranged from “rarely or none of the time” to “most or all of the time”;

scores for each ranged from0 to 3, and total scores ranged from 0 to 24.

Stress was defined as the stress level experienced as a result of five items:

health, financial status, work, family’s health/finances/work/marriage, and

(7)

relationships with families. Responses for each item ranged from “no stress” to

“heavy stress”; scores for each ranged from0 to 2, and total scores ranged from 0 to 10.

Life satisfaction was measured using the Life Satisfaction Rating (LSR) (Neugarten, Havighurst, Tobin, 1961), which rated the following 12 items of life satisfaction: “is your life better than that of most others,” “are you satisfied with your life,” “are you interested in the things you are engaged,” “are the recent years the best days of your life,” “would you like to change your past life,” “do you expect

something good to happen in the future,” “should your life be better than it is now,”

“are you bored with most things you do,” “do you feel old and tired,” “does most of your life meet your expectation,” “do you feel you are living in a safe environment,”

and “are you satisfied with your living environment.” Each item was rated as yes/no (1/0), and total scores ranged from 0 to 12.

Health behaviors

The participants were asked if they smoked (no/yes), drank alcohol (no/yes), and exercised regularly (yes/no). Regular exercise was defined as doing exercise at least three times per week.

Spirituality

Spirituality was measured by religious activity, religious prayer, and belief in an afterlife. Religious activity was defined as whether participants prayed or worshiped at home, read scriptures, attended church or temple, or listened to or watched religious radio/television programs. Responses for each item ranged from “never” to “always”;

scores ranged from 1 to 4. Total scores ranged from 4 to 16. Religious prayer was measured by how often respondents prayed to calm down when they faced

difficulties, when making major decisions, or when trying to overcome difficulties.

(8)

Responses for each item ranged from “never” to “often”; with scores ranging from 1 to 4.Total scores ranged from 4 to 16. Belief in an afterlife was used to measure belief in the following: the existence of heaven and hell, the existence of the soul after death, death is not the end but rather the process to heaven, and the world after death is better than the one experienced here on earth. Responses for each item ranged from

“not believing at all” to “believing completely”; scores ranged from 1 to 4. Total scores ranged from 4 to 16.

Analysis

The analysis included descriptive analysis, correlation, and a generalized linear model (GLM) for the repeated measures of the longitudinal data. The GLM was defined as a logistic model; thus, the odds ratios of the independent variables to happiness were estimated. A time-linear model was assumed.

Results

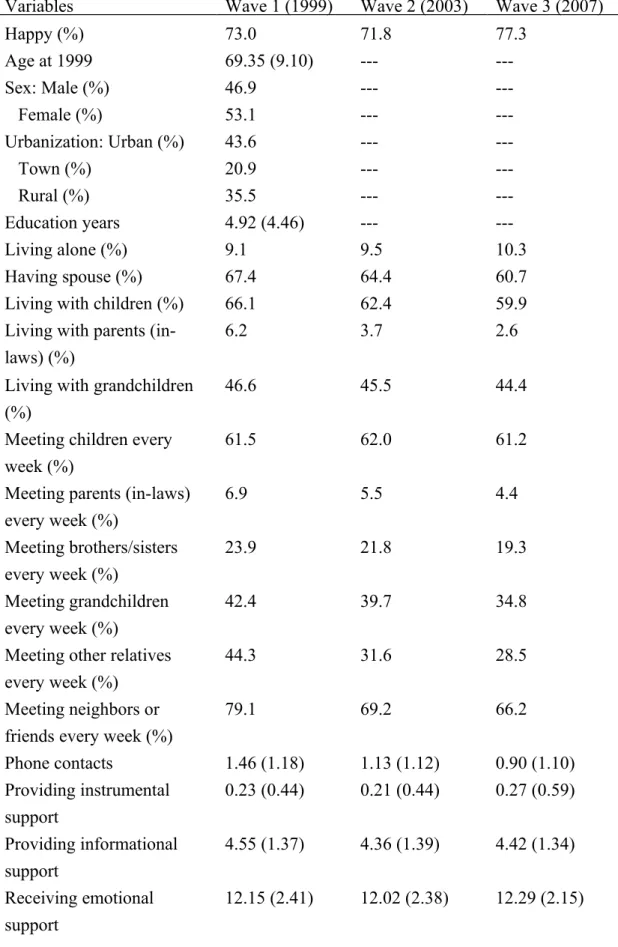
Table 1 shows the descriptive statistics of the samples. The mean age at the baseline was 69.35 years old. The percentage of males was 46.9% and females, 53.1%. The percentage who reported being “happy” ranged from 71.8% to 77.3%

across the three waves of panel data. About 10% lived alone. The percentages of those who met with children, grandchildren, parents, or relatives ranged from 4% to 45%, and 66% to 80% of the respondents met with neighbors or friends every week.

Telephone contacts with family members were 1.46 times per week in the average at the baseline and declined little across the waves. Providing instrumental and

informational social support, and receiving emotional support were stable, but receiving instrumental support increased across the waves when they became older.

The percentage of social participation was 58.3% in 1999, but by 2007, had declined

to 47.8%.

(9)

By examining the correlations of happiness with other factors, we found that living with children, parents, or grandchildren, and smoking were not significant.

Thus, these four variables were excluded from the model in the following analysis.

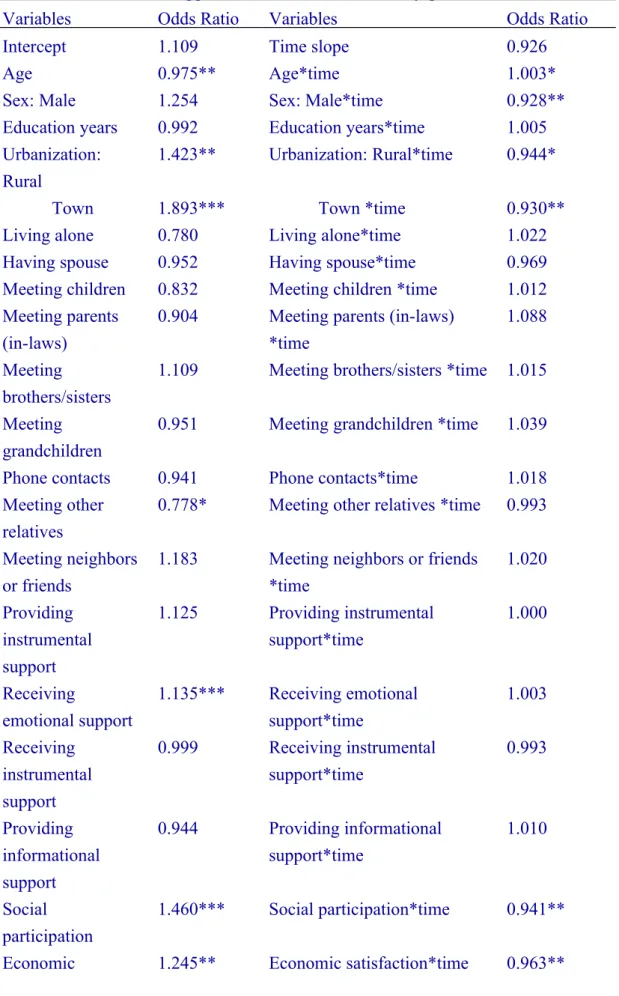
Table 2 shows the result of the GLM in predicting happiness using social connection factors and other variables. The upper part of the table indicates the estimated

parameters of the predictors on the intercept, and the lower part indicates the parameters of the predictors on the time slope. The parameters are shown in odds ratios of being happy.

Among the social connection factors, participants who met less often with relatives (OR=0.778), received more emotional support (OR=1.135), or engaged in social participation (OR=1.460), were more likely to be happy at the beginning (on the intercept). Living arrangements, marital status, telephone contacts, providing instrumental or informational support, and receiving instrumental support were not significant. In addition, participants who were being younger, lived in an urban setting (other than a rural area or in town), had higher economic satisfaction, had fewer depressive symptoms, had less stress, regularly exercised, had higher life satisfaction, and a weaker belief in an afterlife were more likely to be happy at the beginning (on the intercept). Basic and advance physical function or disease numbers were not significantly related to happiness.

As time went by, the time slope was not significant. Being older, female, or

living in an urban area increased the possibility of happiness over time. However, the

effects of social participation (OR=0.941), economic satisfaction (OR=0.963), or

regular exercise (OR=0.051) reduced the degree of happiness over time (i.e., the odds

ratios were less than 1 on the time slope). The other social connection factors and the

remainder of the variables were not significant on the time slope.

(10)

Discussion

This study examined the relationship of happiness and social connection factors using longitudinal panel data gathered from a select group of the elder population of Taiwan. In general, happiness was found to be stable over time. While both receiving more emotional support and social participation were related to happiness at the beginning, the effect of social participation was found to be offset over time. Living arrangement, marital status, telephone contacts, providing social support, and receiving instrumental support were not significant at either the intercept or the time slope. Better economic satisfaction was related to happiness at the intercept; however, the effect was somewhat offset over time. The significant factors emotional support, economic satisfaction, and social participation all correspond to the pleasant life, the good life, and the meaningful life, the three components of happiness (Seligman, 2003). Our findings thus support Seligman’s concept of happiness and also indicate that happiness is not based on the interactions of social networks; rather, it is derived from social support received and participants’ social engagement outside the family.

Living arrangement and social interaction with family members were not

significantly related to happiness. In a family-centered culture, such as in Taiwan, it is customary for older people to live with their families. Family thus functions as a physical security net for caregiving arrangements, as well a financial security net for elders. Yet it may be that feeling secure is not the same thing as feeling happy. In addition, living together with family members does not guarantee elders will receive a good quality of supports in the social interactions. Receiving emotional support was found to be related to happiness, indicating happiness is correlated more with the aspect of emotional support instead of those of instrumental support or caregiving.

This finding implies elders need not only instrumental care in their daily lives or

(11)

assistance or disability or disease care, but also that the quality may be more

important than the quantity of social interactions. Sincere emotional care means more to elders’ happiness. The current policy and culture in Taiwan is more focused on the instrumental care level and long-term care services for elders, but the emotional affect is not a primary issue in such a rapidly aging population. Building a caring,

harmonious culture within households and in the elder population within society should be promoted.

Consistent with previous research (Waldinger et al., 2010; Borgonovi, 2008), social participation was found to be related to happiness. Surprisingly, contacts with family or relatives did not increase happiness. In this study, meeting with other relatives was even related to lower possibility of happiness. It is possible that we can choose our friends but not our family or relatives. The interpersonal quality of social contacts may be the core to happiness, but not the size or numbers of social contacts.

Social participation may increase personal dignity, mastery feeling, connection with a social network, and a meaningful life for older people. With household size

decreasing over the past few decades and the size of social networks declining as well than the time when they were younger, encouraging elders to participate in social groups or social activities is an essential strategy for successful aging. Society would do well to provide increased opportunities for older people to participate in social activities, reduce the age discrimination for older workers and older volunteers, and encourage community-based social connectivity activities to prevent social isolation of older people.

It is interesting to note that while physical health variables were not significantly related to happiness, perhaps previous research did not control for the social

connection factors related to happiness. In addition, doing regular exercise may

(12)

increase the possibility of happiness, and a life with less stress more likely leads to happiness. The most important criterion found for experiencing happiness is to lead a healthier lifestyle, such as doing regular exercise and coping more effectively with stress. Doing regular exercise and living a less stressful life have been found to be related to physical health (Zander et al., 2013), and now we find they also are related to happiness. We should encourage people to live a healthy lifestyle, not just to improve their physical health but also for the positive psychological benefits.—

feeling happy—doing so will convey. In addition, life satisfaction was positively related to happiness in this study. Life satisfaction is an evaluation of the current and past life, which reflects not only the objective situation but also the subjective evaluation in many dimensions in the life. Happiness is a component of subjective wellbeing (Bishop et al., 2010). If the older people have positive subjective wellbeing with their life, they were more likely to be happy.

This study has some limitations. First, the analysis was produced using

secondary data, and only available variables were used in the model. The measure of happiness was derived from only one item of CES-D and not from multiple indicators.

The measures of social connection only included living arrangements, marital status, social contacts, social support, and social participation. Other social connection variables, such as social capital and the quality of family interactions were

unavailable. Second, the TLSA data were collected every three or four years. Changes between waves were not observed. However, we have applied three repeated,

measured waves of data to examine the relationship between happiness and social

connection factors in this study and observed that a dynamic relationship regarding

happiness occurred over time.

(13)

Social connections were related to happiness, particularly emotional social support and social participation. Experiencing a higher quality in one’s social relationships may be more important than the quantity of social interactions, and the social relationships outside the informal social network may increase the social support, reduce the loneliness and improve their dignity when they connect with the society, and thus increase their happiness. For older people who have only limited social networks, we suggest that providing social participation opportunities embedded with good emotional support in the community will raise older people’s levels of positive psychology and happiness.

References

Bishop, A. J., Martin, P., MacDonald, M., Poon, L., for the Georgia Centenarian Study. (2010). Predicting happiness among centenarians. Gerontology, 56, 88- 92.

Bishop, A. J., Martin, P., Poon, L. (2006). Happiness and congruence in older

adulthood: a structural model of life satisfaction. Aging and Mental Health, 10, 445-453.

Blanchflower, D. G., Oswald, A. J. (2008). Is well-being U-shaped over the life cycle? Social Science & Medicine, 66, 1733-1749.

Borgonovi, F. (2008). Doing well by doing good. The relationship between formal volunteering and self-reported health and happiness. Social Science &

Medicine, 66, 2321-2334.

Cooper, C., Bebbington, P., King, M., Jenkins, R., Farrell, M., Brugha, T., et al.

(2011). Happiness across age groups: results from the 2007 National Psychiatric Morbidity Survey. International Journal of Geriatric Psychiatry, 26, 608-614.

Cooper, C., Bebbington, P., Livingston, G. (2011). Cognitive impairment and

(14)

happiness in old people in low and middle income countries: results from the 10/66 study. Journal of Affect Disorders, 130, 198-204.

deRee, J., Alessie, R. (2011). Life satisfaction and age: dealing with under

identification in age-period-cohort models. Social Science & Medicine, 73, 177- 182.

Fowler, J.H. (2008). Dynamci spread of happiness in a larger social network:

longitudinal analysis over 20 years in the Framingham Heart Study. British Medical Journal, 337, a2338. Doi: 10.1136/bmj.a2338.

Kohout, F. J., Berkman, L. F., Evans, D. A., Cornoni-Huntley, J. (1993). Two shorter forms of the CES-D (Center for Epidemiological Studies Depression)

depression symptoms index. Journal of Aging and Health, 5, 179-93.

Lewis, C. A., Maltby, J., Day, L. (2005). Religious orientation, religious coping and happiness among UK adults. Personality and Individual Differences, 38, 1193- 1202.

Litwin, H. L., Shiovitz-Ezra, S. (2011). Social network type and subjective well-being in a national sample of older Americans. The Gerontologist, 51, 379-388.

Nagi, S. Z. (1976). An epidemiology of disability among adults in the United States.

The Milbank Memorial Fund Quaterly, Health and Society, 54, 439-67.

Neugarten, B. L., Havighurst, R. J., Tobin, S. S.(1961). The measurement of life satisfaction. Journal of Gerontology, 16, 134-143.

Nyqvist, F., Finnäs, F., Jakobsson, G., Koskinen, S. (2008). The effect of social capital on health: the case of two language groups in Finland. Health & Place, 14, 347-360.

Oerlemans ,W. M., Bakker, A. B., Veenhoven, R. (2011). Finding the key to happy

aging: a day reconstruction study of happiness. Journal of Gerontology Series B

(15)

Psychology Sciences & Social Sciences, 66, 665-674.

Peiró, A. (2006). Happiness, satisfaction and socio-economic conditions: some international evidence. Journal of Socio-Economics, 35, 348-365.

Seligman, M. E. P. (2003). Positive psychology: Fundamental assumptions.

Psychologist, 16, 126–127.

Shahab, L., West, R. (2009). Do ex-smokers report feeling happier following cessation? Evidence form a cross-sectional survey. Nicotine & Tobacco Research, 11, 553-557.

Stavrova, O., Fetchenhauer, D., Schlösser, T. (2013). Why are religious people happy? The effect of the social norm of religiosity across countries. Social Science Research, 42, 90-105.

Waldinger, R. J., Schulz, M. S. (2010). What’s love go to do with it? Social functioning, perceived health, and daily happiness in married octogenarians.

Psycholology and Aging, 5, 422-431.

Zander, A., Passmore, E., Mason, C., Rissel, C. (2013). Joy, exercise, enjoyment,

getting out: a qualitative study of older people’s experience of cycling in

Sydney, Australia. Journal of Environmental Public Health,2013, ID 547453,

http://dx.doi.org/10.1155/2013/547453

(16)

Table 1. Descriptive analysis of the sample characteristics, 1999-2007 (Mean SD or

%)

Variables Wave 1 (1999) Wave 2 (2003) Wave 3 (2007)

Happy (%) 73.0 71.8 77.3

Age at 1999 69.35 (9.10) --- ---

Sex: Male (%) 46.9 --- ---

Female (%) 53.1 --- ---

Urbanization: Urban (%) 43.6 --- ---

Town (%) 20.9 --- ---

Rural (%) 35.5 --- ---

Education years 4.92 (4.46) --- ---

Living alone (%) 9.1 9.5 10.3

Having spouse (%) 67.4 64.4 60.7

Living with children (%) 66.1 62.4 59.9

Living with parents (in- laws) (%)

6.2 3.7 2.6

Living with grandchildren (%)

46.6 45.5 44.4

Meeting children every week (%)

61.5 62.0 61.2

Meeting parents (in-laws) every week (%)

6.9 5.5 4.4

Meeting brothers/sisters every week (%)

23.9 21.8 19.3

Meeting grandchildren every week (%)

42.4 39.7 34.8

Meeting other relatives every week (%)

44.3 31.6 28.5

Meeting neighbors or friends every week (%)

79.1 69.2 66.2

Phone contacts 1.46 (1.18) 1.13 (1.12) 0.90 (1.10)

Providing instrumental support

0.23 (0.44) 0.21 (0.44) 0.27 (0.59)

Providing informational support

4.55 (1.37) 4.36 (1.39) 4.42 (1.34)

Receiving emotional support

12.15 (2.41) 12.02 (2.38) 12.29 (2.15)

(17)

Receiving instrumental support

1.80 (0.48) 1.84 (0.43) 4.55 (1.37)

Social participation (%) 58.3 49.6 47.8

Disease numbers 1.42 (1.37) 1.64 (1.49) 1.75 (1.50)

Basic physical function 0.76 (2.98) 1.07 (3.65) 1.56 (4.37) Advanced physical function 3.96 (5.94) 4.97 (6.51) 5.55 (6.98)

CESD 8 score 3.54 (4.92) 3.34 (4.58) 3.74 (4.83)

Stress 1.75 (2.02) 1.66 (1.93) 1.56 (1.85)

Smoking (%) 24.1 19.1 15.3

Drinking (%) 24.1 23.5 24.0

Regular exercise (%) 51.4 57.3 58.9

Life satisfaction 7.01 (2.07) 7.07 (1.98) 7.09 (2.12) Economic satisfaction 3.14 (0.95) 3.13 (0.98) 3.16 (0.95) Religion activity 4.33 (3.07) 4.20 (3.00) 4.01 (3.14)

Religion prayer 3.25 (3.14) 2.99 (3.09) 2.67 (2.93)

After-death belief 4.86 (2.71) 4.59 (3.75) 4.46 (4.12)

Note: N=4731. The missing cases were listwise deleted in the table.

(18)

Table 2.Association of happiness and social connection by generalized linear model

Variables Odds Ratio Variables Odds Ratio

Intercept 1.109 Time slope 0.926

Age 0.975** Age*time 1.003*

Sex: Male 1.254 Sex: Male*time 0.928**

Education years 0.992 Education years*time 1.005

Urbanization:

Rural

1.423** Urbanization: Rural*time 0.944*

Town 1.893*** Town *time 0.930**

Living alone 0.780 Living alone*time 1.022

Having spouse 0.952 Having spouse*time 0.969

Meeting children 0.832 Meeting children *time 1.012 Meeting parents

(in-laws)

0.904 Meeting parents (in-laws)

*time

1.088

Meeting brothers/sisters

1.109 Meeting brothers/sisters *time 1.015

Meeting grandchildren

0.951 Meeting grandchildren *time 1.039

Phone contacts 0.941 Phone contacts*time 1.018

Meeting other relatives

0.778* Meeting other relatives *time 0.993

Meeting neighbors or friends

1.183 Meeting neighbors or friends

*time

1.020

Providing instrumental support

1.125 Providing instrumental support*time

1.000

Receiving

emotional support

1.135*** Receiving emotional support*time

1.003

Receiving instrumental support

0.999 Receiving instrumental support*time

0.993

Providing informational support

0.944 Providing informational support*time

1.010

Social participation

1.460*** Social participation*time 0.941**

Economic 1.245** Economic satisfaction*time 0.963**

(19)

satisfaction

Disease numbers 1.000 Disease numbers*time 1.001

Basic physical function

0.968 Basic physical function*time 1.006

Advanced physical function

1.005 Advance physical function*time

0.995

CESD 8 score 0.919*** CESD 8 score*time 0.995

Stress 0.901** Stress*time 0.996

Drinking 0.925 Drinking *time 1.035

Regular exercise 1.431*** Regular exercise *time 0.051*

Life satisfaction 1.119*** Life satisfaction*time 1.003 Religion activity 1.033 Religion activity*time 0.999 After-death belief 0.970* After-death belief*time 1.003 Note: Observations=6,959. Person Chi-square: 6970.868 (df=6897), Log Likelihood = -3177.308, AIC=6479.749, BIC=6903.179. *p<0.05. **p<0.01,

**p<0.001.

數據

Table 1. Descriptive analysis of the sample characteristics, 1999-2007 (Mean SD or
Table 2.Association of happiness and social connection by generalized linear model

參考文獻

相關文件

In view of the large quantity of information that can be obtained on the Internet and from the social media, while teachers need to develop skills in selecting suitable

形成 形成 形成 研究問題 研究問題 研究問題 研究問題 形成問題 形成問題 形成問題 形成問題 的步驟及 的步驟及 的步驟及 的步驟及 注意事項 注意事項 注意事項

The differential mode of association: Understanding of traditional Chinese social structure and the behaviors of the Chinese people. Introduction to Leadership: Concepts

 Schools can administer APASO-II scales/subscales at diff erent times of the school year to achieve different purpose s, e.g. to assess the effectiveness of an intervention progra m

 Schools can administer APASO-II scales/subscales at diff erent times of the school year to achieve different purpose s, e.g.. to assess the effectiveness of an intervention progra

The elderly health centres provide people aged 65 or above with comprehensive primary healthcare services which include health assessments, physical check-ups, counselling,

It costs &gt;1TB memory to simply save the raw  graph data (without attributes, labels nor content).. This can cause problems for

They are: Booklet (6) – Healthy Community, exploring the communicable and non- communicable diseases and how they affect community health so that students are able to