doi:10.6342/NTU202003239
國立臺灣大學社會科學院經濟學系 碩士論文
Department of Economics College of Social Science National Taiwan University
Master Thesis
新冠肺炎疫情對於電影產業之影響:以韓國為例 The impact of COVID-19 on motion picture industry:
Evidence from South Korea
林琪峰 Chi-Feng Lin
指導教授:馮勃翰 博士
Advisor: Po-han Fong, Ph.D.
中華民國 109 年 8 月
August 2020
目 錄
口試委員會審定書………i
中文摘要………... ii
English Abstract……….. iii
Chapter 1 Introduction……….. 1
Chapter 2 COVID-19 in South Korea………...4
Chapter 3 Motion Picture Industry in South Korea………...9
Chapter 4 Data……….20
4.1 Daily Box-office……….20
4.2 Number of Infections of COVID-19………..22
Chapter 5 Analysis………..31
5.1 Empirical Framework……….31
5.2 Estimation………34
5.3 Discussion………36
Chapter 6 Concluding Remarks………..51
Reference………53
doi:10.6342/NTU202003239
中文摘要
2019 年底新冠肺炎(COVID-19) 疫情的爆發重創全球經濟。本文著眼於疫情 對於電影產業的衝擊,並以韓國資料進行實證分析。在雙重差分(Difference-in- Differences)模型的的基礎上,調整其固有的模型設定,以研究疫情爆發與電影票 房營收間的動態關係。研究範圍包含區域性與全國性的影響。分析結果發現,疫 情對於票房的影響隨著週次遞移,無論是區域性影響或全國性,均呈現加劇的走 勢。細究其背後的原因,推論可能包含人均票價收入的下降、舊片重放及電影轉 換流通方式造成的消費者觀影意願下降。
關鍵字:實證研究、電影產業、新冠肺炎、外生衝擊、文化產業、韓國
ii
English Abstract
The pandemic of COVID-19 is a great shock on economic activities. To study the impact on industries, I developed an econometric model for studying about the dy- namic effect of the outbreak of COVID-19 on the motion picture industry in South Korea. The box-office performance and the outbreak of both regional and national are investigated. Through regression analysis, I found a pattern of negative growth on the impact using daily data in the industry. The result is connected to the strategies of produce companies (change in release platform) and multiplexes(price, seat distance policies and screen allocation).
Keywords: empirical study, motion picture industry, COVID-19, external shock, cultural industry, South Korea
doi:10.6342/NTU202003239
1 Introduction
The outbreak of coronavirus disease 2019 (COVID-19) paralyzed the economy of the world. World Bank stated that it is the worst downturn, the deepest reces- sion after the Second World War. Over 5% of the economy is forecast to shrink in this year. The economies in U.S., Euro Area and Japan were anticipated to each shrink by 6.1%, 9.1% and 6.1%. From the perspective of per capita output, re- ported in Global Economic Prospects by World Bank, June 2020, largest proportion of economies underwent, or is still facing declines ever since 1870. Worse still, the adversity is not seemed to terminate, and the chance of recovery is still dim. ”This is a deeply sobering outlook,” said Ceyla Pazarbasioglu, World Bank Group Vice
President for Equitable Growth, Finance and Institutions, ”with the crisis likely to leave long-lasting scars and pose major global challenges.” At the time of writing,
hundreds of thousands of new cases are still reported everyday, with thousands of deaths.12
The pandemic led to not only the decline in economies, but also the change in life styles. Stay home and reduce the unnecessary outing was strongly suggested.
Some cities like Wuhan, Hubei province in China even implemented strong lockdown policy. Residents could not leave home without permission, and all routes leave the city were closed. Physical distancing, more widely known as social distancing, was recommended by WHO again after the pandemic of SARS in 2003. Indoor leisure activities, which are unnecessary and meanwhile, having high likelihood to violate
1COVID-19 to Plunge Global Economy into Worst Recession since World War II, World Bank, 8
June 2020.
2Coronavirus disease(COVID-19) Situation Report-183, World Health Organization, 21 July 2020.
1
distancing principle, thus experienced a hard time under this circumstance. Films, one of the major indoor leisure, experienced great decline. It is expected that there could be a loss of at least 5 billion USD on the motion picture industry, reported by Guardian, with the world’s largest cinema chain AMC showed a 30% drop in the shares in fortnights.3 Many countries ordered all cinemas (partially for Japan) to stop operating. Several films cancelled or delayed the theatrical releases, and some turned to VOD or other online stream platforms. Filming schedule and productions are also postponed or suspended.4
In spite of the situation, South Korea, the fifth large film market5 of the world and the first country suffered from a major COVID-19 outbreak in February out of China, is the only country whose government never forced the multiplexes to close the door during the pandemic. It aroused my interest and curiosity to move to have a deeper look to this phenomena. Furthermore, while Korea is the origin of Hallyu, which means the Korean wave, the culture goods market is seldom mentioned in empirical frameworks. With detailed and thorough open data, it is a great oppor- tunity to study about the Korean film market.
In this study, I considered the outbreak of COVID-19 as a exogenous shock on both demand side and supply side. External demand and/or supply shocks are an often-discussed topic. By simulation, Bloom (2009) estimated the uncertainty shocks generate pause of investment and hiring if firms have non-convex adjust- ment costs. Based on Bloom’s study, Bachmann et al. (2013) used the numbers of
3Cinema bullish in the face of coronavirus despite projected $5 bn loss, Guardian, 6 March 2020.
4Guardian, op. cit.
5Resource: UIS.Stat , The top 5 are: India, China, U.S., Mexico and South Korea.
doi:10.6342/NTU202003239 business survey in German and U.S. to examine such effects and found consistent
results. Kilian (2009), on the other hand, studied about fluctuations of oil price and suggested that specify the determinant of oil price, particularly whether it is a structural shock that may have effect on other factors is important. Most of the existing literatures focused on macro data or oil prices, and to my knowledge, none of them was conducted on cultural industry. My attempt in this study is to develop the model for examining the dynamic effect of the situation of virus on box-office performance.
The remaining contents are structured as follows: In the following Section 2, I would briefly introduce the situation of COVID-19 in South Korea. In Section 3, I would provide background information for the motion picture industry in South Korea. Descriptions of the dataset would be provided in Section 4. The estimation and some further discussion of the results is in Section 5, and the conclusive remarks with suggestion for further studies is put in Section 6.
3
2 COVID-19 in South Korea
The first case was reported in Jan. 20th, which is later by several days than Japan and one day earlier than Taiwan. The situation of virus may firstly seemed to be not serious. Only a few cases, mainly imported, were reported. Number of Infected (NOI) kept growing at a relatively slow rate. There may be sustained transmission, but without public alert. Some people regard it as an omen of potential pandemic and attempt to make a lifestyle change. However, there was not a widely shared concern about the seriousness of the virus at that time in South Korea. The major did not consider the possibility of widespread, and no strong and strict policies were implemented to fight against the disease.
Nonetheless, such situation did not last for a long period. Daegu Shincheonji Church of Jesus,6 a secretive religious group, held meetings on Feb. 9th and 16th.
Unfortunately, there were participants who had visited Wuhan before their gather- ings, and some participants attended these activities even if they have respiratory symptoms. As soon as first confirmed case related to the Church reported on Feb.
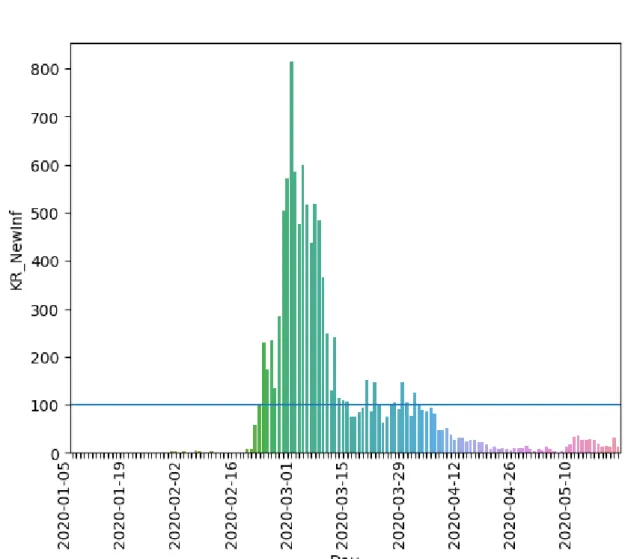
18th., the infections rocketed in the late February. Regional NoI in Daegu and North GyeongSang Province, in particular, grew at a dramatically high speed. Soon after the upsurges, the Korean government declares a state of emergency on Feb. 23rd.
Since that most patients could not find their source of infection, Korean government decided to document precise data of the movement of infected down to minute-level through smartphone GPS data, closed-circuit television and any other available ap- proaches. During the outbreak of Middle East Respiratory Syndrome (MERS) in 2015, the virus transmission mostly happened in hospital. Nevertheless, the Korean
6대구신천지교회.
doi:10.6342/NTU202003239 government at that time did not disclose the list of hospitals where infected patients
had visited or been admitted. It is said to be one of the main reason that cause South Korean to encounter the largest outbreak of MERS outside of the Middle East region. Learning from the experience of MERS,7 the authorities made quick response to the disease.
Besides the disclosure of transport information, Korean government set up drive- through/walk-through virus test centres, which made rapid and wide detection pos- sible. Based on the test results, physicians could diagnose and make fast response (quarantine) to the patients’ health condition. With such effective strategies, even though once reported to have the highest NoI outside of China,8 Korea overcame the panic and urgent situation brought by the community-acquired infections of Daegu Shincheonji Church of Jesus. Distancing policies on the other hand, were officially ordered on Mar. 22nd. The late decision may show that in late February and early March, the situation of virus made the country a severe crisis, so that the administrator have to make response to such circumstance before thinking preven- tive policies.
During the duration of the data, the new reported cases decreased to less than 100 after the first day of April.9 Compared to the peak on February 29th, which has more than 800 new cases reported, this showed a sign that the situation of virus
7South Korea learned its successful Covid-19 strategy from a previous coronavirus outbreak: MERS,
Bulletin of the Atomic Scientists, 20 March 2020.
8Coronavirus: Why did infections shoot up in South Korea? BBC, 25 February 2020.
9This record was not broken until Jul. 24th. Though 113 cases newly reported on Jul. 25th., 86 of
them were imported cases.
5
is successfully controlled. At that time, Taiwan, Singapore and South Korea were praised for their management of the outbreak while none of them enforced strict lockdown policies.10 This is looked upon as an encouraging result and a model of other countries suffered from skyrocketing new cases.
Guard should never be dropped, otherwise here come the waves. South Korea government relaxed social distancing rules since May 6. Public facilities and busi- ness gradually started to reopen. The administrator eased the strict guideline, and moved on to ”daily life quarantine,” which includes wearing masks, avoiding crowds, disinfecting hands frequently and refraining from going out unnecessarily. Never- theless, a male who visited three clubs at Itaewon, a night-life district with plenty of clubs and bar lounges in Seoul, was publicized on May 2nd without wearing masks confirmed positive on May 6th. Later on 8th, it is publicized that the male vis- ited Itaewon, but it was already too late to prevent community-acquired infections happening. Hundreds of positive cases reported linked to Itaewon nightclubs. Even though the government suggested that all visitors of Itaewon should take examina- tion regardless of symptoms, the virus may have already been widespread. The news brought Koreans into a panic. The possibility of failure (incompleteness) on contact tracing, which resulted from social conservative attitude toward sexual diversity and was mentioned by a professor in Seoul National University,11 further caused Koreans suffered from fear of infections. Since then, though no large outbreak as
10Encouraging Outlook—In Taiwan, Singapore And South Korea Life Is Continuing Without Lock-
downs, Forbes, 1 April 2020.
11What South Korea’s Nightclub Coronavirus Outbreak Can Teach Other Countries as They Reopen,
TIME, 12 May 2020.
doi:10.6342/NTU202003239 the one of Daegu Shincheonji Church of Jesus happened, cluster transmission and
community-acquired transmission often occurs in South Korea.
7
Figure 2.1: Daily New Cases.
doi:10.6342/NTU202003239
3 Motion Picture Industry in South Korea
In 2019, it is estimated that the market value of motion picture industry chain in South Korea has exceeded 6 trillion Korean won, roughly 5 billion USD.12The direct sales, on the other hand, is 2.5 trillion Korean won, including theatrical revenues, sales of digital contents like VOD, and oversea export incomes. The value and percentage is show in the following Figure 3.1. Meanwhile, the total viewers in 2019 is 226.68 million, with 5 films surpassing 10 millions counts of view. Three of them are U.S. Films from Disney, and the rest are both from one of the leading local entertainment company CJ ENM. One is Extreme Job, the representative lunar new year film, and the other one is Parasite, the worldwide famous and award-winning movie. The top 10 viewed films are listed in Table 3.1. The Korean motion picture industry have a great propensity in 2019 such that both the market size and the total viewers both the historical records.
Nationality and Monthly Variation
Although the number of imported films are much beyond the quantity of local films, Korean audiences are fond of local films and foreign films almost equally from the prospective of viewers. Some argued that the ”patriotic propaganda” explained this result, while no quantitative analysis is conducted to confirm this viewpoint. Table 3.2, or graphically demonstrated in Figure 3.2, showed the detailed monthly released films and viewers with the total amount and the local/non-local sectors separately.
12The number is calculated by applying average annual growth rate 4.9% on the survey result in
2018 (5.9 trillion). Most numbers and tables in this subsection could be found in 2019 년 한국 영 화산업 결산. Full contents are available on the website of KOFIC.
9
The greatest difference in viewers fall in July. Roughly 85% of the visitors of the cinemas are for foreign films. This is likely driven by the summer vacation peak in foreign countries, with U.S. included.13 August has the most total viewers in summation throughout the year, and the average daily sales reaches the summit on Aug. 15th, the Liberation Day of Korea. Holidays play important roles in the analysis of motion picture industry, and it is left to be further explained later in this section.
Genre
The viewers and revenues of each genre in 2019 are shown in Table 3.3. Although roughly one-third of released films are romance films, it seems that Koreans are not fond of them as the producers or distributors expected. The top 6 genres of films are action, drama, comedy, animation, adventure and crime films. More than 85%
of the viewers chose among these types of films, and they took an account of 85%
of the theatrical revenues of the industry. Besides, the seven genres from the top have higher per film revenue (Revenue divided by number of released) in general.
The two exceptions are dramas and musicals for having relatively large or small base number. One thing more worth mention is that action films, comedies and adventure films all have a higher revenue ratio than viewer ratio. This shall imply that there are price difference between genre of films. Films with higher average ticket price may be more often played in rounds or places with higher demand, such as afternoon rounds or city centre multiplexes.
13There is no official duration of the summer vacation in South Korea, but most schools have their
summer break from the latter half of July to the whole August.
doi:10.6342/NTU202003239
Regional Difference
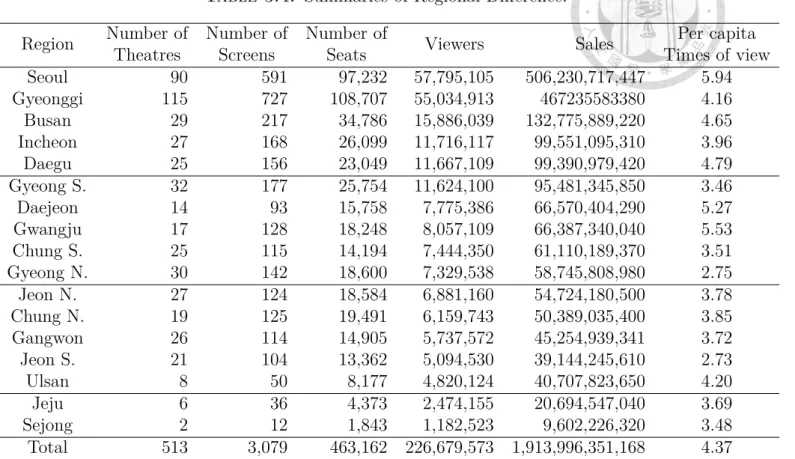
Seoul and Gyeonggi Province are the two largest market in South Korea, which take an account of over 49% of the tickets sold, and more than half of the box-office revenues. Both of them have larger capacity as well. Gyeonggi Province, the region that has most population in South Korea, have 115 theatres, more than 700 screens and roughly a hundred thousand of available seat. Seoul follows behind for having smaller area and number of theatres, but the number of viewers, and the revenues are more in Seoul. Busan being the second largest city takes the third place in all indexes above, but the gap between Busan and the first two are relatively large.
From the perspective of per capita times of view, Metropolitans like Seoul, Gwangju and Daejeon takes the first to the third place for having more accessible theatres than other regions.
Holiday Effects
The box-office performance differs a lot throughout an year. Figure 3.3 shows the daily market size in 2019. Besides the weekday effects, we may observe that there are several peaks which are extraordinarily higher than days before or after. That is the amplification effect of national holidays. Based on ”Regulations on holidays of government,”14 obligatory holidays of government bureaus, departments and agen- cies are: (Italic words are the explanation added by the author, not in the original legal document.)
• Sundays;
14which is 관공서의 공휴일에 관한 규정 in Korean. The name and rules of holidays are listed in
Article 2 and Article 3 of it.
11
• The March 1 Independence Movement Day, Independence Day (August 15th), National Foundation Day of Korea (October 3rd), and Hangul (the Korean alphabet) Day (October 9th. It is added in the amendment in 2012.12.28, and Previously Constitution Day, Jul. 17th. It was abolished in 2007.);
• The first day of January;
• The preceding Seollal (Korean New Year’s Day), Seollal, and the day following Seollal (the last day of December, and the first and second days of January according to the lunar calendar);
• (Previously Arbour Day, April 5th. It was taken out from the list in 2005.)
• Buddha’s Birthday (the eighth day of April according to the lunar calendar);
• The fifth day of May (Children’s Day);
• The sixth day of June (Memorial Day);
• The day preceding Chuseok (Korean Thanksgiving Day), Chuseok, and the day following Chuseok (14th, 15th, and 16th days of August according to the lunar calendar);
• The 25th day of December (Christmas Day);
• Election days for elections on the termination of terms of office referred to in Article 34 of the Public Official Election Act;
• Other days the Government designates from time to time.
Besides, if Children’s Day or any one of the day in Seollal Holidays or Chuseok overlaps with another statutory holiday, there will be an alternative statutory holi-
doi:10.6342/NTU202003239 day on the next non-statutory holiday. The case that Children’s Day falls on Satur-
day applies as well. I hence added three binary variables to identify the substitute holidays after Seollal, Chuseok and Children’s Day for each. The total market size of holidays, weekends and working days are listed in the following Table 3.5.
13
Figure 3.1: Direct Sales of Korean Film Industry. Numbers in the parentheses are the values in trillion won.
Figure 3.2: Number of Released Films in each month in 2019. The lower bars stand for local films while others are foreign films.
doi:10.6342/NTU202003239 Table3.1:Top10ViewedFilmsin2019.Allfilmslistedabovearelaunchedin2019.Theaccumulatedresultsincludedtheviewers andrevenuesin2020.Frozen2andASHFALLarenaturallystillonscreeninthetheatresin2020,whiletheincreaseinotherfilmslisted abovemostlycameformthe”Oldfilmreplay”policyimplementedbymultiplexesandtheatres.Particularly,Frozen2isstillonscreen (andtheonlyfilmwatchedfordays)duringtheseveresituationofvirusinDaegu. RankKoreanTitleEnglishTitleReleasedAgeNationalityMax.ViewersAcc.RevenueAcc. Distributor Screenin2019Viewersin2019Revenue 1극한직업ExtremeJob01-2315↑Korea1,97816,265,61816,266,240139,651,845,516139,655,052,516CJENM 2어벤져스:엔드게임Avengers:EndGame04-2412↑U.S.2,83513,934,59213,977,602122,182,694,160122,492,181,020Disney 3겨울왕국2Frozen211-21AllU.S.2,64813,369,08713,747,792111,596,444,720114,810,421,450Disney 4알라딘Aladdin05-23AllU.S.1,31112,552,28312,555,894106,955,138,359106,983,620,359Disney 5기생충Parasite05-3015↑Korea1,94810,085,27510,312,75585,883,963,64587,457,794,695CJENM 6엑시트EXIT07-3112↑Korea1,6609,426,0119,426,13179,232,012,16279,232,932,162CJENM 7스파이더맨: 파프롬홈
Spider-Man: FarFromHome07-0212↑U.S.2,1428,021,1458,023,32669,010,000,10069,825,366,300Sony 8백두산ASHFALL12-1912↑Korea1,9716,290,8068,252,66952,908,739,07069,825,366,300CJENM DexterStudio 9캡틴마블CaptainMarvel03-0612↑U.S.2,1005,802,8105,802,81051,507,488,72351,507,488,723Disney 10조커Joker10-0215↑U.S.1,4185,247,8745,255,30845,381,075,45045,443,092,130Warner
15
Table3.2:MonthlyReleasedFilmsandViewers. Month
KoreanFilmsForeignFilmsAllFilms HolidaysReleasedOnScreenViewers VD A ReleasedOnScreenViewers VF A
ReleasedOnScreenViewers (RD)(SD)(VD)(RF)(SF)(VF)RD+RFSD+SFA=VD+VF Jan.3613011,950,8230.659992396,171,6200.34113536918,122,4431 Feb.2210617,228,7520.773812085,048,9810.22710331422,277,7333 Mar.281326,267,6050.427962398,404,0880.57312437114,617,6931 Apr.411432,871,9730.21510429210,466,9900.78514543513,338,9630 May421618,614,2350.477922939,448,2220.52313445418,062,4572 June321379,943,5950.43510931512,901,9870.56514145222,845,5821 July431383,340,7430.15210428418,575,7250.84814742221,916,4680 Aug.5116417,981,4010.7251112626,804,7200.27516242624,786,1211 Sep.3817411,964,6890.8121052432,768,9530.18814341714,733,4623 Oct.512096,800,8940.4581362888,057,4890.54218749714,858,3832 Nov.522386,874,0320.37010131911,726,6520.63015355718,600,6840 Dec.6621011,783,6240.52510030910,681,7800.47516651922,465,6041 Total502115,622,3660.5101,238111,057,2070.4901,740226,679,573
doi:10.6342/NTU202003239 Table 3.3: Viewers and Revenues of each genre.
Rank Genre Released Viewer Viewer
Revenue Revenue Per Film
Ratio Ratio Revenue
1 Action 132 53,875,393 0.238 468,854,864,301 0.245 3,551,930,790
2 Drama 345 32,385,926 0.143 268,830,941,208 0.140 779,220,119
3 Comedy 55 31,376,884 0.138 265,901,680,924 0.139 4,834,576,017 4 Animation 93 30,172,518 0.133 245,130,832,345 0.128 2,635,815,402 5 Adventure 10 25,112,606 0.111 214,033,809,809 0.112 21,403,380,981 6 Crime 31 21,339,793 0.094 182,592,206,710 0.095 5,890,071,184 7 History 4 7,363,442 0.032 61,535,266,599 0.032 15,383,816,650
8 Horror 82 5,791,607 0.026 48,311,580,592 0.025 589,165,617
9 Romance 646 5,364,182 0.024 44,352,484,238 0.023 68,657,096
10 Mystery 22 4,933,614 0.022 40,637,256,402 0.021 1,847,148,018 11 Fantasy 13 2,234,840 0.010 18,875,685,405 0.010 1,451,975,800 12 Thriller 29 2,010,782 0.009 16,391,568,035 0.009 565,226,484
13 War 22 1,169,021 0.005 9,094,259,400 0.005 413,375,427
14 Documentary 68 880,555 0.004 6,802,172,898 0.004 100,031,954
15 Musical 2 736,675 0.003 6,149,493,690 0.003 3,074,746,845
16 SF 25 581,115 0.003 5,031,422,670 0.003 201,256,907
17 Family 9 457,051 0.002 3,633,452,282 0.002 403,716,920
18 Performance 17 418,647 0.002 4,202,111,100 0.002 247,183,006 All Others 340 474,922 0.002 3,635,262,560 0.002 10,691,949
Total 1,945 226,679,573 1 1,913,996,351,168 1 984,059,821
17
Table 3.4: Summaries of Regional Difference.
Region Number of Number of Number of
Viewers Sales Per capita
Theatres Screens Seats Times of view
Seoul 90 591 97,232 57,795,105 506,230,717,447 5.94
Gyeonggi 115 727 108,707 55,034,913 467235583380 4.16
Busan 29 217 34,786 15,886,039 132,775,889,220 4.65
Incheon 27 168 26,099 11,716,117 99,551,095,310 3.96
Daegu 25 156 23,049 11,667,109 99,390,979,420 4.79
Gyeong S. 32 177 25,754 11,624,100 95,481,345,850 3.46
Daejeon 14 93 15,758 7,775,386 66,570,404,290 5.27
Gwangju 17 128 18,248 8,057,109 66,387,340,040 5.53
Chung S. 25 115 14,194 7,444,350 61,110,189,370 3.51
Gyeong N. 30 142 18,600 7,329,538 58,745,808,980 2.75
Jeon N. 27 124 18,584 6,881,160 54,724,180,500 3.78
Chung N. 19 125 19,491 6,159,743 50,389,035,400 3.85
Gangwon 26 114 14,905 5,737,572 45,254,939,341 3.72
Jeon S. 21 104 13,362 5,094,530 39,144,245,610 2.73
Ulsan 8 50 8,177 4,820,124 40,707,823,650 4.20
Jeju 6 36 4,373 2,474,155 20,694,547,040 3.69
Sejong 2 12 1,843 1,182,523 9,602,226,320 3.48
Total 513 3,079 463,162 226,679,573 1,913,996,351,168 4.37
Figure 3.3: Daily Market Size in 2019.
doi:10.6342/NTU202003239 Table 3.5: Market Size of Holidays and Workdays in 2019.
Holiday Date Daily Market Size
(in billion KRW) Relative Size
Solar New Year 0101 10.3 3.32
Seollal 0204-0206 9.9 3.19
Independence Movement Day 0301 7.8 2.52
Buddha’s Birthday 0512 6.5 2.10
Children’s Day 0505 10.3 3.32
Memorial Day 0606 13.5 4.35
Liberation Day 0815 14.6 4.71
Korean Thanksgiving Day 0912-0914 12.0 3.87
National Foundation Day 1003 10.7 3.45
Hangul Day 1009 7.2 2.32
Christmas 1225 17.4 5.61
Normal Monday-Thursday 3.1 1
Normal Friday 4.8 1.55
Normal Saturday 9.0 2.90
Normal Sunday 8.1 2.61
19
4 Data
The data is constituted of two main parts: the daily box-office in South Korea, which are collected separately from KOBIS (Korea Box-office Information System)15 website, and the number infected with COVID-19 (NoI).
4.1 Daily Box-office
All cinemas are legally obligated to install a device that regularly collect and send the data to the system in South Korea, and Korean Film Council16 provides daily film statistics through the website of KOBIS, which includes daily domestic box- office, number of viewers, number of screens and accumulated data for top 200 films everyday since 2003.17
Dataset for estimation
The main dataset is made up of the downloaded spreadsheet which are generated automatically by KOBIS. The main reason is that additional information from other database would be included into the file, director, official tag of genre, production and distribution company for instance, and it is not directly accessible on the web- page of box-office performance. Besides, I collected both national data and regional data to measure people’s attitude toward the infection in their neighbourhood. Vari- ables and basic summary statistics of national variable are listed in Table. 4.1 below.
15영화관입장권통합전산망. http://www.kobis.or.kr/kobis/business/main/main.do
16영화진흥위원회 . https://www.kofic.or.kr/kofic/business/main/main.do
17The earliest accessible record is from 2003. However, the automatic data sender system is legalized
from 2011, and the records before are based on Korean Almanac (한국영화연감).
doi:10.6342/NTU202003239 Revenue, Log-revenue, Viewer and Log-viewer over time are shown in the following
Figure 4.1 to 4.4. It is clearly demonstrated that the market size of the industry has a downward trend. Particularly, compared to the result shown in Table 3.5, which says that the independence day (Mar. 1st) on average has a greater average box-office revenue, in this period of time we could find that the statement does not hold any more.
Overlook: Motion Picture Market Under COVID-19
In early May, KOFIC released an official report about the situation of domestic market and their future expectations. Compared to the same time period in 2019, the sales of cinemas have decreased by 246.7 billions Korean won in the first quarter of 2020. It is consistent to my data. The top 3 multiplexes chains also reported 24 and 81 billions of deficit in February and March. However, the numbers should not be naively all considered as the impact of the virus. Table 4.2 below shows the weekly market size in 2019 and 2020. We could see that even before the outbreak in Korea (Week 1 to Week 3) or the cluster transmission at Daegu (before Week 8), the total sales in 2020 are less than in 2019. The big difference between Week 4 and Week 6 is the holiday effect, and thus, it is not supposed to be mixed up with the effect of outbreak. This panel again showed that it is necessary to develop a dynamic model to capture the impact on motion picture industry with situation of virus and underlying seasonality.
21
4.2 Number of Infections of COVID-19
I collected NoI for each region from ”Coronavirus Disease-19, Republic of Korea,”18 and ”CoronaBoard.”19 Daily NoI of the whole South Korea and the top three cities (Seoul, Busan and Daegu) are shown in the following Figure 4.5.
As shown in the figures above, NoI showed different patterns in regions, which may indicate the location of cluster of community acquired transmission. The regional difference in the situation of virus could drive the regional box-office to distinct results. Beside national effect of the outbreak on the revenues, I further concerned how would the regional outbreak have impact on the regional revenues.
Nonetheless, people may care about their surroundings, not only the cities they lived in. Here, I considered two possible cases to define the ”nearby” regions: Tra- ditional Regions on Korean peninsula are usually divided by natural barriers, espe- cially Taebaek Mountains. They are still used in Koreans’ lives. For instance, in the bus terminal of Seoul, buses bounded for Gwangju, Mokpo or Yeosu would be listed under the category ”Honam Line.” Universities and highways like Yeungnam (Yeongnam) University, Honam Highway Express are also named after the name of the traditional regions. On the other hand, geographically adjacent regions enhanced the probability of transmission through (mass) transportation. Residents may be afraid of spread of virus from surrounding areas. Under certain circumstances, the authorities may enforce the lockdown as the case in Hubei Province, China. I here hence included both of them as independent variables, but in separated regression models. The specification would be explained in the following section.
18코로나바이러스감염증-19 (COVID-19). ncov.mowh.go.kr
19coronaboard.kr
doi:10.6342/NTU202003239 Figure 4.1: Revenue of the whole country, Seoul, Daegu and Busan.
23
Figure 4.2: Log-Revenue of the whole country, Seoul, Daegu and Busan.
doi:10.6342/NTU202003239 Figure 4.3: Revenue of the whole country, Seoul, Daegu and Busan.
25
Figure 4.4: Log-Revenue of the whole country, Seoul, Daegu and Busan.
doi:10.6342/NTU202003239 Table4.1:ListofVariablesandSummaryStatisticsofNationalVariables.Mstandsformillion. VariableLevelNMeanstd.minQ2max TitleNational14,222(Unique:1,664) SalesNational+Regional1422214.86M145.32M0242,0007106.7M ViewerNational+Regional14,2221,763.2816,452.8037782,927 ScreenNational+Regional14,22247.9078138.582131,659 RoundNational+Regional14,222113.584518.044149,261 AgeRestrictionLevelNational13,303 GenreNational14,147
27
Figure 4.5: NoI of the whole Korea country, Seoul, Daegu and Busan.
doi:10.6342/NTU202003239 Table 4.2: Difference in 2020 and 2019. R stands for total market revenue, and
1.05 is the average annual growth rate by KOFIC. Unit: billion KRW.
Week R2020 R2019 R2020− R2019 1.05× R2019 R2020− 1.05 × R2019
1 33.29 31.95 1.33 33.6 −0.26
2 24.43 30.37 −5.94 31.89 −74.59
3 20.44 27.47 −7.03 28.84 −8.41
4 54.44 39.65 14.78 41.64 12.80
5 18.61 53.32 −34.72 56.00 −37.38
6 15.18 77.17 −61.99 81.03 −65.85
7 21.40 33.61 −12.20 35.29 −13.88
8 12.97 31.49 −18.51 33.06 −20.09
9 6.12 31.74 −25.62 33.32 −27.20
10 4.60 35.15 −30.55 36.90 −32.30
11 3.57 21.17 −17.60 22.22 −18.66
12 2.50 24.27 −21.78 25.49 −23.00
Q1(1-12) 217.55 437.37 −219.82 459.24 −241.69
13 2.47 25.14 −22.68 26.40 −23.93
14 1.78 18.75 −16.97 19.68 −17.91
15 1.36 14.27 −12.92 14.99 −13.63
16 1.68 10.47 −8.80 11.00 −9.32
17 1.41 59.43 −58.02 62.40 −61.00
18 3.60 49.58 −45.98 52.06 −48.46
19 3.07 31.40 −28.33 32.97 −29.90
20 2.34 29.80 −27.46 31.29 −28.95
(7-20) 68.86 416.27 −347.41 437.08 −368.22
29
Table 4.3: List of Geographical Regions with traditional divisions and adjacent regions.
Traditional Regions City/Province Adjacent Regions
Gyeonggi Region 경기 지방
Seoul (서울특별시) Incheon, Gyeonggi
Incheon (인천광역시) Gyeonggi
Gyeonggi Province (경기도) Seoul, Incheon, Gangwon, S. Chungcheong, N. Chungcheong Gwandong Region
관동 지방 Gangwon Province (강원도) Gyeonggi, N. Chungcheong, N. Gyeongsang
Hoseo Region 호서 지방
Daejeon (대전광역시) Sejong, N. Chungcheong, S. Chungcheong Sejong (세종특별자치시) Daejeon, N. Chuncheong, S. Chungcheong South Chungcheong Province Daejeon, Sejong, Gyeonggi,
N. Chungcheong, N. Jeolla (충청남도)
North Chungcheong Province Daejeon, Sejong, Gyeonggi, Gangwon, S. Chungcheong, N. Gyeongsang, N. Jeolla (충청북도)
Honam Region 호남 지방
Gwangju (광주광역시) S. Jeolla
South Jeolla Province
Gwangju, S. Gyeongsang (전라남도)
North Jeolla Province S. Chungcheong, N. Chungcheong, S. Gyeongsang, N. Gyeongsang, S. Jeolla (전라북도)
Yeongnam Region 영남 지방
Busan (부산광역시) Ulsan, S. Gyeongsang
Daegu (대구광역시) S. Gyeongsang, N. Gyeongsang Ulsan (울산광역시) Busan, S.Gyeongsang, N. Gyeongsang South Gyeongsang Province Busan, Daegu, Ulsan,
S. Jeolla, N. Jeolla, N. Gyeongsang (경상남도)
North Gyeongsang Province Daegu, Ulsan, Gangwon, N. Jeolla, N. Chungcheong, S. Gyeongsang (경상북도)
Jeju Region 제주 지방
Jeju Province (제주특별자치도)
doi:10.6342/NTU202003239
5 Analysis
5.1 Empirical Framework
As mentioned, the main purpose of this study is to estimated the effect of the virus on the motion picture industry. Nonetheless, the market itself suffered from seasonality.
Without consideration of seasonality, the estimation could be gravely impacted. To decompose the fluctuation, I have considered the following possibilities:
• Weekly Average Index: Calculate the market size (measured by total box-office revenues) and take the mean for previous years. The mean would be included as a control variable but transferred to a 1 to 100 index. This method directly followed Elberse and Eliashberg (2003).
• Weekly Dummy: Adding a set of binary variables indicating each week. The concept of this approach came from Einav (2007). It is more complicated than the original article since that the regulations related to holidays are different in two countries. Particularly, the holidays based on lunar calendars in Korea made it almost impossible to estimate consistent results in this way.
The two approaches should be considered as the ”classic” to deal with seasonality in previous researches of the motion picture industry. Nonetheless, there are two main reasons that make them inappropriate to be used in this study:
The first problem is the time-scale of the data. Most articles related to films are done in ”week” level. In order to show the connection between NoI and the box- office revenue, this study is done in ”day” level. Neither calculating ”daily average”
nor putting ”empty days” in control of dates of holidays could be implemented. The other problem, but meanwhile the biggest difference, is the holiday system. Only
31
handful empirical works in the field focus on markets rather than the US. Regions in East Asia, with South Korea included, have holidays based on both the lunar calendar and the solar calendar. The dates of lunar holidays (Lunar New Year and Korean Thanksgiving, the impacts on market size are both sumptuous as shown in Table 3.5) could vary up to 30 days, which is impossible to control by date itself.
In this study, I included the interaction between a set of binary variables indicate the outbreak of COVID-19, week indicators and holidays (separating the lunar hol- idays and other holidays). The idea is analogous to the ”Difference-In-Differences”
(DID) method, which is widely seen in empirical studies other than the filed of entertainment industry. The underlying key assumption: Parallel Assumption is graphically examined in Figure 5.1. Nevertheless, the models adopted in the follow- ing contents have two main differences compared to the classic approach:
• Instead of considering the average effect of post-outbreak era, I here con- sider the dynamic impact of the situation of virus. Thus, I followed the method adopted by Wolfers (2006), Chandra, Gruber and McKnight (2010) and Chang, Chang and Fan (2019) to insert a series of time-indicating dummy variables. The responses to the situation of virus could vary under different time periods. Under this framework, the estimated coefficients of the inter- action terms should capture the pattern of gradually indifferent, increasing anxiety or other possible patterns.
• The treatment variable (Outbreak) is not controlled individually. In a general framework of DID method, there should be a time-invariant variable stands for the group, and the variable treatment, which is related to time. However, the treatment group and the control group in this study are the revenue in 2019
doi:10.6342/NTU202003239 and 2020. The Outbreaktitself does not apply to the box-office performance in
2019. (No treatment in the control group) As a result, I modified the settings of the dynamic DID model explained above by drop out the single variable Outbreakt in this study.
The estimation is formed at film-(region)-day level. The primary goal is to analyse the impact of the outbreak on the revenue. Key Variables, Dependent Variables and the description of them are demonstrated in Figure 5.2 and Table 5.1 below. The main concern is to estimate the coefficient of the interaction terms between week- dummies and outbreak, which the definition differs in contents. Hypotheses are listed below:
• Hypothesis 1: The national outbreak has impact on the national box-office revenue.
• Hypothesis 2: The national outbreak has impact on the regional box-office revenue.
• Hypothesis 3: The outbreak in a city or a province has impact on the regional box-office revenue.
• Hypothesis 4: The outbreak in the traditional region which a city or a province belongs to has impact on the box-office revenue in the city/province.
• Hypothesis 5: The outbreak in the adjacent regions of a city or a province has impact on the box-office revenue in the city/revenue.
33
5.2 Estimation
Hypothesis 1: The national outbreak has impact on the national box- office revenue
Revi,t = α +
∑53
k=1
γkWk+
∑53
k=1
βkOutbreakt× Wk+ πXi,t+
∑2
τ =1
T rendτt + εi,t
Table 5.2 and Figure shows the results. The effects showed consistently significant after Week 8. The small peak on Week 11 in Figure 5.3 reported a p-value at 0.06, which is tolerable if we loosen the confidence level to 90%. Despite the fact that two theatres were closed on January 31st and February 1st (Two confirmed cases reported visits),the outbreak hurt national performance after the community- acquired transmission happened in Daegu. The result is consistent to the news that cluster transmission brought great panic to Koreans. Furthermore, the coefficients showed a ”negatively increasing” pattern. The phenomena and possible reasons is left to be discussed later in this section.
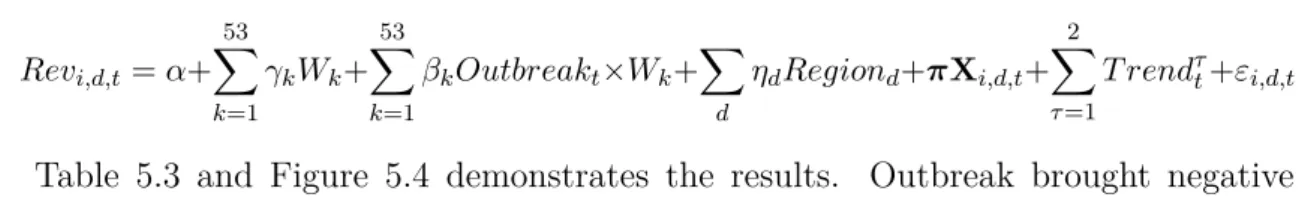
Hypothesis 2: The national outbreak has impact on the regional box- office revenue
Revi,d,t= α+
∑53
k=1
γkWk+
∑53
k=1
βkOutbreakt×Wk+∑
d
ηdRegiond+πXi,d,t+
∑2
τ =1
T rendτt+εi,d,t
Table 5.3 and Figure 5.4 demonstrates the results. Outbreak brought negative effect significantly after Week 4, which is the peak of lunar new year. Although the impact was gradually smoothed in the following weeks, it eventually became worse and worse after the cluster infection at Daegu in Week 8. This pattern is analogous to the one mentioned in the previous model while the coefficients start being significant earlier than the effect on national revenue. The variation in early weeks is unequal through regions, which brought insignificance for national impact.
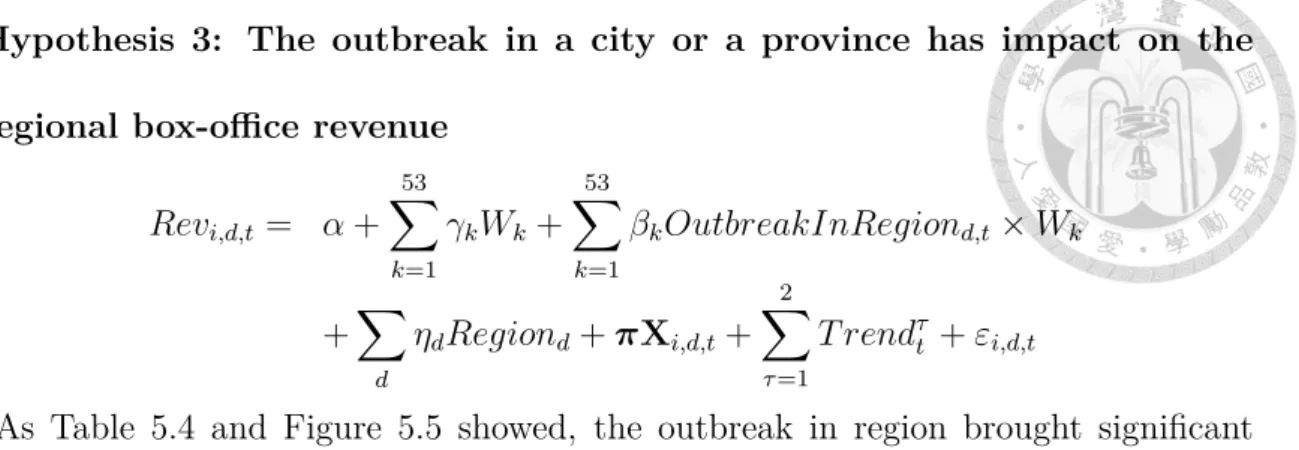
doi:10.6342/NTU202003239 Hypothesis 3: The outbreak in a city or a province has impact on the
regional box-office revenue Revi,d,t= α +
∑53 k=1
γkWk+
∑53 k=1
βkOutbreakInRegiond,t× Wk
+∑
d
ηdRegiond+ πXi,d,t+
∑2 τ =1
T rendτt + εi,d,t
As Table 5.4 and Figure 5.5 showed, the outbreak in region brought significant effect since Week 8, which is the same as the national outbreak. The three tables wove the story that the people started to be aware of the situation of virus since the large cluster transmission Daegu Shincheonji Church, so that both regional out- break and national outbreak had effect on the corresponding market performance.
On the other hand, the impact of national outbreak on regional box-office sales is relatively indirect. People care much more about the city or province they exacted live in rather than the surroundings. Such result shall be supported if the following Hypotheses 4 and 5 showed a ”later response” than the regional or national outbreak effect in Hypotheses 1 and 2.
Hypotheses 4 and 5 Revi,d,t= α +
∑53
k=1
γkWk+
∑53
k=1
βkOutbreakInT rad.Regiond,t× Wk
+∑
d
ηdRegiond+ πXi,d,t+
∑2
τ =1
T rendτt + εi,d,t
Revi,d,t= α +
∑53
k=1
γkWk+
∑53
k=1
βkOutbreakInAdj.Regiond,t× Wk
+∑
d
ηdRegiond+ πXi,d,t+
∑2
τ =1
T rendτt + εi,d,t
Table 5.5 extended the variable OutbreakInRegion to the neighbourhood. I con- sidered two specification: Traditional Region and Adjacent Regions. Both specifi- cations yield similar results as the one of national outbreak on regional income.
35
5.3 Discussion
The negatively increasing pattern was observed through all previous estimation with different starting point. Here I list some possible factors that are likely to contribute to the phenomena.
Decrease in per capita sales
Although movie ticket price is assumed to be rigid, I observed that there is a dra- matic drop and relatively low average price in March and April, as shown in Figure 5.6. Though the Korean government started to distribute movie ticket coupons, which is more than half of the price for the cheapest ticket, at the beginning of June, no large monthly or genre difference in average price was found in the du- ration covered in dataset. There are two possible sources of price variation: ticket price variation in different time periods and different multiplexes. In general, rounds in afternoon are more expensive than ones at midnight or in the morning. Besides, the tickets are more expensive in big cities than in other places. It is likely that visitors scattered over rounds and locations rather than all going to same cinemas at the same time. This could be further examined if numbers at theatre level or even every play is available.
Change in on-screen films
Although many films were reported to postpone their release, no big drop in new released is observed. The vertical axis in Figure 5.7 stands for number of films released in 7 days before. Thus, we may conclude that there are some substitutional films on screen during the period. KOFIC also reported that some of the videos
doi:10.6342/NTU202003239 on-screen did not even have advertising. On the other hand, as shown in Figure 5.8
we could see that starting from March, the number of ”old films,” which are released more than 180 days or 240 days ago, increased dramatically. The average in April and May is significantly much higher than before. KOFIC gives the reason that old films do not need additional advertising budgets. CGV, for instance, launched the
”For someone’s story of life” that allow people to vote for films, and the top four films would be replayed with a discounted price.20 However, the multiplexes did not seem to be benefit from it. The fact that most of the available films are old films made the customers more reluctant to visit cinemas.
Different Sources of Films
Universal Pictures and Warner Bros started to release films both at theatres and through premium VOD at the same time during the pandemic. Universal Pictures further said to the Wall Street Journal that the release of Trolls World Tour had generated more sales in three weeks through streaming platforms in U.S. than the original Troll made in five months in 2017.2122 Two main multiplex chains, CGV and Lotte Cinema, which took an account of 68% of total screen in Korea, thus denied to put Trolls World Tour on-screen, reported by KOFIC. Nowadays, people
20누 군 가 의 인 생 영 화 기 획 전. http://section.cgv.co.kr/event/running/EventZone.aspx?
idx=1503
21Universal Just Told the World That Theaters Are No Longer the Priority, IndieWire, 28 April
2020.
22’Trolls World Tour’ Marks Real Progress For Premium VOD. But It’s Just The Beginning. Variety,
28 April 2020.
37
have more access to films, not only by going to cinemas anymore. Streaming Plat- forms like VOD system all popped up as choices. Did local platforms benefit from the pandemic? Table 5.6 showed that times of purchase based on Pay Per View (Membership that pay for a fixed amount every month is excluded) are even worse in May. It is more likely that users turn to foreign websites like Netflix, Disney+ or HBO Max for new foreign films, and hence, further do harm to the domestic market.
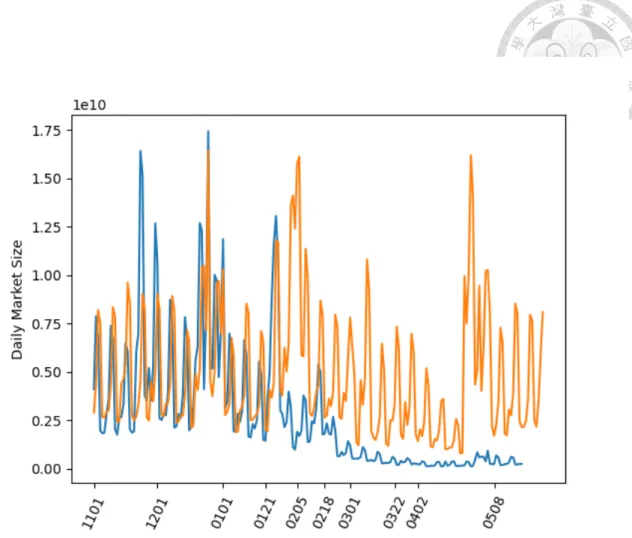
doi:10.6342/NTU202003239 Figure 5.1: Daily National Market Size (November to May in the next year).
Regional Outbreak National Outbreak
Outbreak in Trad. Region
Outbreak in Adj. Region
National Revenue
Regional Revenue
Figure 5.2: Key Variable and Independent Variable in the estimation.
39
Table 5.1: Definition of Variables.
Variable Description
Revi,d,t Regional Revenue of film i at region d, date t.
Revi,t National Revenue of film i on date t.
Outbreakt 1 after 2020-01-21 (National Outbreak) OutbreakInRegiond,t 1 after outbreak in region d.
OutbreakInT rad.Regiond,t 1 for region d after outbreak in the same traditional region.
OutbreakInAdj.Regiond,t 1 for region d after outbreak in adjacent regions.
Wt Week identifier. W1 stands for 01-01 to 01-07, W2 for 01-08 to 01-14 and so on.
Note: W3 is the outbreak week (on the last day of the week).
Regiond Region identifier.
Xi,d,t,Xi,t Control Variables:
Lag terms (period 1-7), Genre(Action, Comedy, ...),
Weekday(Monday, Tuesday, ... Sunday),
Age Restriction(Over 18, Over 15, Over 12, All) Lunar Holiday Dummy
Non-Lunar Holiday Dummy T rendτt Time Trend to the power of τ = 1, 2.
1 for 2018-12-24, 2 for 2018-12-25 and so on.
doi:10.6342/NTU202003239 Figure 5.3: Estimated Coefficients and Confidence Interval (α = 5%) for National-
National Effect.
41
Table 5.2: Estimation for effects of National Outbreak on National Revenue. M stands for million KRW.
Variable Revi,t
Coefficient s.d. p-value Outbreak× W1 −4.819 × 10⁻⁹ 8.83× 10⁻⁹ 0.585 Outbreak× W2 1.46× 10⁻⁸ 1.38× 10⁻⁸ 0.291 Outbreak× W3 4.979× 10⁻⁹ 7.9× 10⁻⁹ 0.529 Outbreak× W4 −10.02M 17M 0.529 Outbreak× W5 −58.92M 19.3M 0.002 Outbreak× W6 −51.19M 22.6M 0.023 Outbreak× W7 −29.22M 26.1M 0.263 Outbreak× W8 −58.71M 29.3M 0.045 Outbreak× W9 −66.94M 33.3M 0.044 Outbreak× W10 −84.84M 37M 0.022 Outbreak× W11 −76.12M 40.7M 0.061 Outbreak× W12 −92.9M 44.5M 0.037 Outbreak× W13 −103.4M 48.1M 0.032 Outbreak× W14 −110.5M 52M 0.034 Outbreak× W15 −115.9M 56M 0.038 Outbreak× W16 −125.4M 59.7M 0.036 Outbreak× W17 −163.6M 63.8M 0.010 Outbreak× W18 −149.2M 67.7M 0.028 Outbreak× W19 −152.1M 71.8M 0.034 Outbreak× W20 −167.4M 75.6M 0.027 Outbreak× W21 −172.4M 79.3M 0.030
Observations 45720
Adj. R2 0.741
doi:10.6342/NTU202003239 Figure 5.4: Estimated Coefficients and Confidence Interval (α = 5%) for National-
Regional Effect.
43
Table 5.3: Estimation for effects of National Outbreak on Regional Revenue. M stands for million KRW.
Variable Revi,t
Coefficient s.d. p-value Outbreak× W1 −4.538 × 10⁻⁹ 1.32× 10⁻⁹ 0.001 Outbreak× W2 −7.442 × 10⁻⁹ 1.77× 10⁻⁹ 0.000 Outbreak× W3 −2.935 × 10⁻⁸ 5.5× 10⁻⁹ 0.000 Outbreak× W4 −1.592M 1.25M 0.204 Outbreak× W5 −12M 1.43M 0.000 Outbreak× W6 −10.92M 1.71M 0.000 Outbreak× W7 −6.929M 1.97M 0.000 Outbreak× W8 −13.1M 2.2M 0.000 Outbreak× W9 −15.76M 2.51M 0.000 Outbreak× W10 −18.65M 2.79M 0.000 Outbreak× W11 −16.87M 3.08M 0.000 Outbreak× W12 −20.8M 3.37M 0.000 Outbreak× W13 −22.54M 3.66M 0.000 Outbreak× W14 −23.97M 3.96 0.000 Outbreak× W15 −25.87M 4.26M 0.000 Outbreak× W16 −27.53M 4.55M 0.000 Outbreak× W17 −36.15M 4.87M 0.000 Outbreak× W18 −32.49M 5.17M 0.000 Outbreak× W19 −32.88M 5.48M 0.000 Outbreak× W20 −37.39M 5.77M 0.000 Outbreak× W21 −38.21M 6.05M 0.000
Observations 228559
Adj. R2 0.746
doi:10.6342/NTU202003239 Figure 5.5: Estimated Coefficients and Confidence Interval (α = 5%) for Regional-
Regional Effect.
45
Table 5.4: Estimation for effects of Regional Outbreak on Regional Revenue. M stands for million KRW.
Variable Revi,t
Coefficient s.d. p-value OutbreakInRegion× W1 −1.628 × 10⁻⁷ 3.13× 10⁻⁸ 0.000 OutbreakInRegion× W2 −1.137 × 10⁻⁸ 2.21× 10⁻⁹ 0.000 OutbreakInRegion× W3 2.029× 10⁻⁷ 3.9× 10⁻⁸ 0.000 OutbreakInRegion× W4 4.626M 1.65M 0.005 OutbreakInRegion× W5 −6.011M 1.08M 0.000 OutbreakInRegion× W6 −2.482M 1.1M 0.024 OutbreakInRegion× W7 1.461M 1.12M 0.193 OutbreakInRegion× W8 −2.749M 1.06M 0.009 OutbreakInRegion× W9 −4.04M 1.21M 0.001 OutbreakInRegion× W10 −5.35M 1.27M 0.000 OutbreakInRegion× W11 −1.794M 1.31M 0.171 OutbreakInRegion× W12 −4.073M 1.4M 0.004 OutbreakInRegion× W13 −4.484M 1.51M 0.003 OutbreakInRegion× W14 −4.366M 1.62M 0.007 OutbreakInRegion× W15 −4.565M 1.71M 0.008 OutbreakInRegion× W16 −4.766M 1.81M 0.009 OutbreakInRegion× W17 −11.75M 1.94M 0.000 OutbreakInRegion× W18 −6.24M 2.09M 0.003 OutbreakInRegion× W19 −5.446M 2.21M 0.014 OutbreakInRegion× W20 −8.464M 2.32M 0.000 OutbreakInRegion× W21 −7.895M 2.47M 0.001
Observations 228559
Adj. R2 0.746
doi:10.6342/NTU202003239 Table 5.5: Estimation for effects of Neighbourhood Outbreak on Regional Rev-
enue. M stands for million KRW.
Variable Revi,t
OutbreakInT rad.Region× Wk OutbreakInAdj.Region× Wk
k Coefficient s.d. p-value Coefficient s.d. p-value
1 −1.879 × 10⁻⁸ 1.27× 10⁻⁷ 0.883 2.135× 10⁻⁸ 1.05× 10⁻⁷ 0.839 2 −1.424 × 10⁻⁸ 3.92× 10⁻⁸ 0.717 −4.19 × 10⁻⁸ 3.93× 10⁻⁸ 0.287 3 4.763× 10⁻⁸ 3.02× 10⁻⁸ 0.115 −3.13 × 10⁻⁸ 2.59× 10⁻⁸ 0.226
4 5.757M 1.27M 0.000 5.631M 1.22M 0.000
5 −5.687M 1.03M 0.000 −5.115M 0.934M 0.000
6 −1.002M 1.1M 0.364 −0.9144M 1.04M 0.380
7 1.704M 1.13M 0.130 1.947M 1.06M 0.068
8 −2.27M 1.08M 0.036 −2.273M 1.15M 0.049
9 −0.6355M 1.24M 0.608 −0.6278M 1.33M 0.637
10 −4.092M 1.29M 0.002 −4.08M 1.4M 0.004
11 −0.9099M 1.34M 0.498 −0.9084M 1.48M 0.538
12 −3.509M 1.44M 0.014 −3.519M 1.59M 0.027
13 −3.598M 1.55M 0.020 −3.592M 1.72M 0.036
14 −3.567M 1.67M 0.032 −3.564M 1.85M 0.054
15 −4.045M 1.76M 0.022 −4.048M 1.96M 0.039
16 −4.211M 1.87M 0.024 −4.211M 2.09M 0.044
17 −11.3M 2M 0.000 −11.3M 2.23M 0.000
18 −4.671M 2.15M 0.030 −4.685M 2.39M 0.050
19 −4.273M 2.28M 0.061 −4.277M 2.54M 0.092
20 −8.33M 2.4M 0.001 −8.342M 2.67M 0.002
21 −7.801M 2.55M 0.002 −7.822M 2.82M 0.006
Observations 228559
Adj. R2 0.746 0.746
47
Figure 5.6: Weekly mean of Revenue per capita ( Total Sales Total Viewer).
Table 5.6: Count of Purchases based on Pay Per View by week.
Week Total Count of Use Week Total Count of Use
W1 571897 W2 381864
W3 477831 W4 941242
W5 641644 W6 553242
W7 1224400 W8 773031
W9 823483 W10 561528
W11 407439 W12 313329
W13 368048 W14 356198
W15 342344 W16 367860
W17 237097 W18 309914
W19 278751 W20 178137
W21 182264 W22 196010
doi:10.6342/NTU202003239 Figure 5.7: Number of Films on screen that are released in the week before.
49
Figure 5.8: Number of Old Films (released 180 days or 240 days ago).
doi:10.6342/NTU202003239
6 Concluding Remarks
In conclusion, the effect of virus moved from national (outbreak) -regional (revenue) and regional-to-regional to national-regional. The loss of box-office performance kept increasing, which is likely to be result of situation of virus, on-screen schedules of new released films and social distancing policy.
Much to my regret, most of the existing literature in motion picture industry only focused on U.S. market. I deeply hope that my research could arouse people’s attention toward East Asia. It deserves more focus on the power of culture industry in East Asia. Japan first stood up and played the leading role as the ”culture-export centre,” from Japanese dramas to idol groups, J-pop music. Japanese animations are still leading the industry in the world nowadays. Many Taiwanese and Chinese dramas in the early 21st century were sold to other Chinese-speaking regions, but then once declined. Recently, Chinese idols and dramas still gained popularity and are developing their foreign markets. Korean wave, or so-called ”Hallyu” rose later than Japan, but were more diverse in different dimensions. Hallyu brought Korean dramas, K-pop (idol groups and songs), Korean movies and Korean cuisines into foreign countries, and Korean celebrities hold great influences on the Internet and Social Media.
Different aspects may be considered as further studies. First, I observed one main feature in most motion picture markets in East Asia, but not in the U.S. market.
”Idolized” actors, which include actors debuted as idols and actors that are treated as idols, are commonly seen. They could draw people’s attention and lead to intensive discussion before the film or the drama started to play. Fans of them crowded to watch their work, even if they do not actual like the stories. This phenomena is likely
51