行政院國家科學委員會專題研究計畫 成果報告
提昇 TFT-LCD 產業中需求與產能配置效益之優化決策支援 模式(第 2 年)
研究成果報告(完整版)
計 畫 類 別 : 個別型
計 畫 編 號 : NSC 97-2221-E-011-091-MY2
執 行 期 間 : 98 年 08 月 01 日至 99 年 07 月 31 日 執 行 單 位 : 國立臺灣科技大學工業管理系
計 畫 主 持 人 : 王孔政
計畫參與人員: 博士班研究生-兼任助理人員:林鈺祥
報 告 附 件 : 出席國際會議研究心得報告及發表論文
處 理 方 式 : 本計畫涉及專利或其他智慧財產權,2 年後可公開查詢
中 華 民 國 99 年 11 月 14 日
1
行政院國家科學委員會補助專題研究計畫期末 報告
(計畫名稱)提昇 TFT-LCD 產業中需求與產能配置效益之優化 決策支援模式
計畫類別:■ 個別型計畫 □ 整合型計畫 計畫編號:NSC 97-2221-E-011 -091 -MY2
執行期間: 97 年 8 月 1 日至 99 年 7 月 31 日
計畫主持人:王孔政
計畫參與人員:林鈺祥、陳朝政、陳信華、林靜敏、甯偉倫、曾冠瑜、
江鎮成、曾昭銘、Yuliani Dwi Lestari、葉仲琦
成果報告類型(依經費核定清單規定繳交):□期中精簡報告■完整報告
本成果報告包括以下應繳交之附件:
□赴國外出差或研習心得報告一份
□赴大陸地區出差或研習心得報告一份
■出席國際學術會議心得報告及發表之論文各一份
□國際合作研究計畫國外研究報告書一份
處理方式:除產學合作研究計畫、提升產業技術及人才培育研究計畫、
列管計畫及下列情形者外,得立即公開查詢
■涉及專利或其他智慧財產權,□一年■二年後可公開查詢
執行單位:國立台灣科技大學工業管理系
中 華 民 國 99 年 10 月 24 日
2
行政院國家科學委員會專題研究計畫成果報告
提昇 TFT-LCD 產業中需求與產能配置效益之優化決策支援模式
A N
OVELD
ECISION-S
UPPORTM
ODEL OFD
EMANDF
ULFILLMENT ANDR
ESOURCEA
LLOCATION FORI
MPROVINGC
APITAL ANDC
APACITYE
FFICIENCY INTFT-LCD I
NDUSTRY計畫編號:NSC 97-2221-E-011 -091 -MY2
執行期限:97 年 8 月 1 日至 99 年 7 月 31 日 主持人:王孔政 國立台灣科技大學工業管理系
中文摘要
本研究以兩年為期,探討並發展生產企劃層面與生產排程層面之多製程環境下產能 與需求平衡最適化決策支援系統,以期提昇 TFT-LCD 產業之生產綜效。本研究為申請 人受 貴會資助探討以智慧型代理人技術發展之生產系統的延續性研究,研究主軸已持 續十年。本研究承襲過去研究主軸,針對 TFT-LCD 產業之特定研究議題分別採用確定 性最佳化與隨機最佳化投資決策模型、模糊類神經模型與系統動態模擬,以解決 TFT-LCD 產業生產系統之投資策略與資源規劃,並完成三項延續性研究主題:一、發展 以分散式代理人為基礎之主生產規劃模型,以期在生產活動中得到最佳整合性資源配置 綜效。並藉由探討在確定性與隨機性需求與價格遽變環境下之最適產能配置決策,以有
3
效控制風險。該模型以平衡市場需求之最少成本為目標,發展存貨與採購計畫,並藉由 發展的基因演算法有效求解。二、探討生產規劃與控制決策對 TFT/LCD 廠營業績效之 影響。三、探討多重資源之資金投資決策對台灣面板廠之營業效益的影響。
本研究已按預定進度,完成資源配置決策模型建立與求解程序,並經由實證研究以 作為企業落實企業智慧決策規則之參考,其具體成果列述如下:
(1) 發展以智慧型代理人技術為基礎之具體研究架構
(2) 發展主生產企劃面與之確定性與隨機性需求狀態下多製程產能配置最佳化 數學模型
(3) 評估問題複雜度與發展近似求解方法 (4) 發展生產控制面協商式資源配置模型
(5) 發展產能規劃與營業績效之系統動態模擬模型 (6) 學術發表
關鍵詞:決策支援系統、資源規劃與配置、智慧型代理人(Decision support system, investment portfolio, resource planning, intelligent agent)
4
Abstract
This project developed a decision support models for resource planning in TFT-LCD industry.
We employ stochastic and deterministic optimization, and dynamic simulation to realize the proposed model. Three related topics are investigated. First, an efficient order fulfillment and resource allocation model under a distributed agent-based production scheme is developed by using deterministic and stochastic optimization and solved by a genetic algorithm. The model minimizes total cost with an assignment of inventory and procurement plans. Secondly, the performance of resource planning is evaluated from a dynamic viewpoint. A business simulation model is established to examine the impact of capital/capacity investment of resources on the revenue/profit of a TFT-LCD manufacturing firm. Thirdly, a model is developed to examine the impact of the proposed decision support model as well as to explore the business knowledge in capacity-related capital-investment decisions. The project ourcome can contribute to the TFT-LCD related industries for their long-term productivity.
We have completed eight tasks related to resource allocation decision models and their corresponding solution methods.
1. A detailed research framework and development guidelines of the project 2. A deterministic model for resource portfolio model for multiple resources
3. A stochastic optimization decision model for tool procurement under demand risk 4. Complexity analysis of the addressed problem and solution method developed 5. A negotiation-based resource portfolio model
6. A capacity planning and revenue/profit simulation model 7. Examine the impact of the proposed decision support model
Keywords: Decision support system, investment portfolio, resource planning, intelligent agent
5
一、緣由與目的
研究動機之一
TFT-LCD 產業中各製程生產企劃與生產控制面之產能平衡影響公司營運績效甚 鉅,如獲有效解決,將為業者創造決定性之競爭力。TFT-LCD 產業之多製程結構,係 指一企業同時擁有多座TFT、LCD、與 LCM 廠。尤其陣列製程、組立製程、模組製程、
彩色濾光片製程中夾雜各類技術能力搭配限制,大幅增加規劃的複雜度,唯有審慎進行 產品模組與產能之供需平衡規劃,才能有效控制成本支出。此外,於風險環境下進行多 製程產能平衡規劃決策,也為本研究動機之一。
本研究針對TFT-LCD 製造廠商多製程生產企劃面,完成兩項研究主題:
探討確定性環境下之產能規劃
探討風險性(需求與價格)環境下之產能規劃 研究動機之二
TFT-LCD 產業景氣變化快速,面對快速變動的客戶需求,高設備成本之陣列製程若 無法於有效時間內取得可行結果,將失去生產控制的時效性。因此,TFT-LCD 產業之 生產模式,極為著重資源的有效配置。除此之外,多製程結構與各製程之技術能力限制 亦為其產業特性,將各個功能性廠區上下游製程精準的進行技術限制控制亦為必須考慮 之因素。TFT-LCD 各廠傳統上多以主生產企劃為依據,顧客訂單以存貨與預期產出量 滿足之,不足的數量再經各廠產能協調取得產能平衡。由於每一廠商的各段製程技術能 力皆不同,客戶需求模組又具有多樣需求特性,妥善應用昂貴的高度自動化設備,使技 術能力配置決策變得極為複雜。如何透過有效的上下游多廠間資源配置與存貨以同步規 劃並達成整體最佳營運目標,十分重要。
因此,於風險性、有限性與併行性環境下提高資源生產效率,降低成本支出、滿足
6
客戶需求,是此產業追求的目標,亦為本研究動機之二。本研究針對以上的情勢,完成 兩項研究主題:
產能與訂單之生產搭配決策
TFT-LCD 製造廠商之多製程限制下最適生產控制決策模式 研究動機之三
前述對投資與資源預先規劃決策,仍需賴事後之績效評估,並將此昂貴之技術產能 配置智慧予以有效累積以備後用。此外,TFT-LCD 廠商設備與技術的本土化是未來趨 勢。由於國內產品技術自主性及創新不足,專利多掌握在日本大廠,隨著面板尺寸增加,
廠商亟需克服專利權的門檻,提升技術及創新能力,爭加競爭力。目前國 內 主 要 TFT-LCD 製 造 廠 商 技 術 導 入 技 術 形 態 包 括 : 合資建廠、生產技術、設計技術、整 廠技術、量產技術等。隨著日本大廠逐漸釋出大量代工,並朝向更高階領域研發,我國 最具關鍵性的中游廠商也必須加快腳步,開始著手研發活動,但是此種高科技設備與技 術之研發活動的支出非常龐大,如果資金運用不當,很容易造成數億元的虧損。
因此,持續觀察TFT-LCD 產業實際於多製程產能配置方式,並歸納出 TFT-LCD 產 業產能配置與營業績效之成長關係,將此企業經驗予以有效的累積,以達到企業永續經 營的目標,十分重要,亦為本研究動機之三。本研究針對以上的情勢,完成兩項研究主 題:
多製程產能配置與營業績效之關係(企業智慧)研究
多製程產能配置與營業績效之What-If 模擬分析
根據建構出之TFT-LCD 面板產業產能配置最佳化實務模型,一則與理想模型比較 與修正,一則賦予台灣的面板產業投資時提供一個較佳的參考。
7
二、全案研究架構與方法
本研究成果以智慧型代理人技術為核心工具,由學術角度發展與審視 TFT-LCD 產 業之多製程產能配置最適化決策,並以實務角度評估此配置於不同面向考量下最適化決 策模型之效能。在智慧型代理人架構下,針對主排程企劃與生產控制規劃議題,分別建 立產能平衡決策之確定性與非確定性模型,設計對應之求解演算方法;所建立之模型並 以實務個案修正佐證之。本研究之內容如圖 1。智慧型代理人技術所發展之研究架構如 圖2。
市場變革 有限產能
最適產能配 置決策
最適生產 決策
多製程協 調決策
產能配置績效 預測與分析
產品模組/產能搭 配限制 多製程間搭配考量
主 生 產 企 劃 面
生 產 控 制 面
資源配 置績效 評估 風險性
技術產能有限性 多重資源併行性
技術需求
圖1 基本研究架構
8
圖2 以智慧型代理人技術所發展之研究架構
9
本案採用智慧型代理人架構建立之 TFT-LCD 技術產能配置之最適化決策系統,可 使系統更具彈性。智慧型代理人架構具有獨立決策制定之能力,使智慧型代理人之間可 藉由通訊協定交換訊息。產業中各生產系統之製造單元分處多處,各製程負擔不同技術 能力與製造需求;此架構更具體對應陣列製程、組立製程、模組製程、彩色濾光片製程 於產業供應鏈之現況,且生產資訊分屬各代理人所管轄。就此而言,以智慧型代理人為 基礎之產能配置,對需求變化的反應、重新組態之能力、與(重)規劃之反應力,均相當 優越。
本案分別採用確定性與隨機最佳化數學模型發展多製程產能配置決策模型,此一模 型可充分反應出需求變異的風險性、有限性與併行性,問題亦清楚的以數學結構定義出 來。此外,本案所採用確定性最佳化數學模型發展多製程產能配置協調決策模型,充分 反應出生產控制面之確定需求下之多製程產能配置決策。
鑑於問題的高複雜度,本案藉由發展柔性求解方法,達成實務需求中之求解時效性 與可行性。
智慧型代理人協商模型則發展用以進行生產控制面之多製程產能協調。本研究不使 用傳統集中式決策,而是開發一協商式多製程產能協調模型,讓各廠在考量產能限制環 境下,主動支援需求模組以爭取整體績效最佳化。資源配置的結果不僅具有可行性,更 具主動式的管理能力。各廠不再被動調整產能配額,可有效提升企業整體績效。
為研究與分析 TFT-LCD 廠產能平衡配置特性與其不同需求可能性下所進行之可行 性,本研究以系統動態模擬模型,從整體績效的角度,運用模擬方法進行敏感度分析以 評估哪些參數較為敏感。模擬方法考量不同市場需求狀態下,提供一個良好的觀點以達 到較強健的產能配置方案。
最後,本研究建構多製程產能配置與需求模組生產決策之企業營運規則,使知識之 發現更有時效性與彈性。因此,本案運用此一技術作為產能配置策略、生產分派知識之 發掘。
10
三、結果與討論
本研究計畫已按申請之計畫書所述,完成資源配置決策模型建立與求解程序,敘述 如下:
1. 發展以智慧型代理人技術為基礎之具體研究架構
2. 發展主生產企劃面與之確定性與隨機性需求狀態下多製程產能配置最佳化數 學模型
3. 評估問題複雜度與發展近似求解方法 4. 發展生產控制面協商式資源配置模型
5. 發展產能規劃與營業績效之系統動態模擬模型 6. 萃取最適產能配置決策之企業知識
7. TFT-LCD 產業設備/技術投入與營業績效關係之實證研究 8. 學術發表
(1) 智慧型代理人架構之設計
本案採用之智慧型代理人架構,依功能性分為主生產企劃之 TFT-LCD 多製程產能 配置決策智慧型代理人、生產控制之多階資源配置協調決策智慧型代理人與營業預測與 知識獲取智慧型代理人。單一代理人內部結構將分為「溝通機制」及「思考評判機制」
兩部分。
本研究所建立之智慧型代理人決策系統因具備分散式系統優點,代理人可動態生成 與重組,以執行產品模組/製程技術/產能平衡配置之最適化決策。其具有比中央集權決 策系統更高的重用性與重組彈性。本計畫之研究成果,於系統設計時,可針對單一代理 人機能進行設計以降低系統設計的複雜度,減少研發時間,達到低成本、快速成形之目 的。
11
(2) 生產企劃面之產品模組/多製程產能配置研究方法
本研究所探討之TFT-LCD 產業探討產品模組及產能平衡配置決策,可於市場需求、
技術變革與價格變異之風險性環境下,擬定主生產企劃之生產模組/技術產能配置最佳規 劃。具體言之,本研究可於有限之製程產能、製程間搭配限制、不同產品模組對技術層 級的需求差異、需求的高變異性、短產品生命週期、昂貴的生產線更替成本、存貨風險 大、資金密集的製程產能、多製程產能配置及綜合目標 (考慮良率、物料搬運便利、產 能平衡狀態) 考量下,發展最適決策。
本研究乃根據以下特性,建構出企業產品模組/技術產能配置決策隨機最佳化模型。
1. 預測 TFT-LCD 產業長期製程產能規劃期間內,各產品模組對製程之技術需求。
2. 預測各製程能力遂行生產所造成之成本。
3. 有限產能下,企業於 TFT-LCD 產業產能配置策略。
4. 評估製程中各類產能之理論利用率。
5. TFT-LCD 產業於製程技術搭配間造成之限制與影響。
6. TFT-LCD 產業於不同需求情況下之產能配置影響。
(3) 生產企劃面之產品模組/技術產能配置隨機規劃模型
本研究所發展之產品模組/技術產能平衡規劃模型,以產業營運策略角度進行製程技 術/模組配置,以滿足不確定性環境下之市場營運策略,並以達成最小配置成本與最小產 能配置風險為目標。具體而言,本計劃根據各不確定性因子發展適合之機率分配,透過 抽樣產生市場需求,將不確定性所帶來之決策風險量化於目標函式中,以落實隨機性最 佳化模型之目的。
12
產品模組/製程技術產能配置目標
由於市場價格不確定,本研究之產品模組/製程技術產能配置目的,以企業營運成本 為主軸,並同時考量各製程之產能平衡與客戶達交率之總合。此外,本研究之不確定模 型中,將風險性造成之產能配置損失列入成本,俾使投資決策者得以於配置方案死風險 之間進行取捨。
多製程技術能力展開限制式
規劃多製程技術配置考量了各製程間之技術限制、產品模組之技術需求與前置時間 展開,並使製程產能/產品模組技術需求之間達成平衡。
技術能力與技術需求落差對決策影響之限制式
製程能力過剩時,技術利用率過低將導致存貨增加及機會成本損失。反之,製程產 能不足,將造成客戶流失、服務率下降、運輸頻繁等額外成本。
有限製程技術產能限制式
製程技術/模組需求之產能配置為成本最小化。在有限產能下,同時考量產能配置帶 來之客戶達交率與風險評估以進行生產決策。
技術需求之產品模組與製程能力限制式
規劃期間內,產品模組對於技術之需求與製程技術能力之限制,皆一併考量於產能 配置決策中。
(4) 生產企劃之產品模組/產能配置規劃之求解
精確的求解方式於此技術產能/產品模組配置規劃隨機最佳化模型問題中需要大量 計算時間。本案透過運用柔性計算方法(基因演算法)有效求解此一最適化問題。
13
本計劃所發展之隨機性基因演算法考量下列議題。
染色體設計
染色體結構為隨機性基因演算法於求解技術產能/產品模組配置規劃問題之重要元 素。本計畫所設計之染色體結構可有效對應至規劃模型中主要決策變數。
基因演算法修復機制
有別於傳統基因演算法以懲罰值為基礎搜尋最佳解。本計劃模型中由於需同時考量 眾多限制式,且染色體交配或突變過程中易產生不可行解,若使用傳統搜尋方式將造成 計算能力之浪費。本計劃成功採用染色體修復技術提升可行解機率,並降低不可行解的 染色體計算時間。
基因演算法之基因操作子
本研究根據染色體結構與特性選擇操作子,使發展之隨機性柔性解法於搜尋解答過 程中更具多樣性與豐富性,有效提升柔性演算法之求解效率。
基因演算法之需求不確定表示方式
隨機性柔性求解演算法除具備上述設計考量外,尚支援隨機性模型中之抽樣與評估 程序。為反應不確定環境所帶來之產能配置決策風險,本計劃成功將隨機性抽樣程序納 入傳統演算法中。
本研究發展之柔性解以基因演算法為核心,根據主要決策變數設計染色體結構,並 以此一柔性演算法落實於解決TFT-LCD 產業中多技術產能/產品模組配置決策。
(5) 生產控制面之產能配置協調研究
本研究針對 TFT-LCD 廠,定義出關鍵製程技術產能,以進行生產控制面之產能配 置協調決策。本研究考量多重製程間之各種產能可行方案(自製、外包、共用產能等)、
製程搭配 (各型設備同一時間產品模組搭配方式)與產品模組生產限制,將所需產能分派
14
至已承諾之訂單中。由於 TFT-LCD 廠內具有不同技術能力與製程差異,所生產之產品 與生產速度不盡相同,不同製程技術搭配,操作成本也有所差異。本研究提出之TFT-LCD 廠最佳多製程產能配置協調模型,可於短暫規劃時間內,找出最適多製程協調生產方 案,並計算出最適關鍵性產能生產效率與缺貨關係,以提升廠內產能生產效益並使營業 成本最小化。
本研究並依據下列特性建構一確定性數學規劃模型。
1. 產能配置與多階製程組合規劃中,所生產之各類產品模組之單位邊際成本。
2. 多製程技術需求/產品模組生產所需技術之配合。
3. 各類製程產能之理論利用率與理論輸出率。
4. 生產已承諾訂單之缺貨成本。
5. 各產能技術使用之生產成本。
(6) 產品模組/多製程技術生產協調之確定性模型
TFT-LCD 廠營運目標
TFT-LCD 廠內部多製程產能協調配置規劃之目標乃將規劃期之產能配置成本加 總,並使成本最小化。
各製程間之缺貨狀態與需求滿足限制式
廠內規劃之各製程產能並與各期間內各種允諾之產品模組達成平衡。無法即時滿足 生產則產生延遲成本。此外,各階段製程間之運輸亦會產生製程配置成本。
15
產能與產品模組之平衡限制式
TFT-LCD 廠內,各階分別具備多種產能,產能與產品模組之間則考量生產能力限制。
各製程間之產能協調限制式
多階問題中,各製程內各類製程技術需同時配合以完成產品模組之生產。由於部分 模組需多階製程同時配合方可完成生產,為反應此一限制,本限制式用以清楚表達此一 製程技術能力/產品模組間的生產可行性關係。
產品模組之生產成本限制式
關鍵產能之應用主要根據該產能於各產品模組中之生產何者較具利益。
本研究所發展之多製程產能協調模型,可判斷何種技術能力與產品模組搭配最符合 生產效益。此一決策並可獲致最小化資源組態最佳配置與工廠營運成本。
(7) 產品模組/多製程技術生產協調之求解
產能協調與多製程限制問題,若使用傳統最佳化求解方法需要極多的計算時間。此 外,同時考量 TFT-LCD 廠中各製程間存缺貨與運輸成本,更增加了大型實務問題的計 算複雜度,因此使用柔性求解方式有其必要性。雖然柔性解為基礎的求解研究能較具效 率的解決產能配製與多階製程組構問題,但是不良的演算法設計將導致計算能力的浪 費。本研究成果即針對上述模型,發展演算法以提升求解速度。
本基因演算法需考量之議題如下:
染色體設計
染色體結構對於使用基因演算法求解多製程產能協調配置最佳化問題極為重要。此 一規劃中之主要決策變數,均包含於染色體結構中。
16
基因演算法之修復機構
本研究由於需同時支援許多限制式,基因操作過程中染色體交配與突變常產生不可 行解。於此狀況下,本計畫發展以懲罰值為基礎的基因演算法,並搭配修復基因,以限 制不可行解的發生。
基因演算法之基因操作
為了使發展之基因演算法具備優異的求解效率,本計畫將染色體結構/特性採用多種 交配與突變方式,使發展之基因演算法於搜尋解答過程中更具多樣性與豐富性。
(8) 發展生產控制面之協商式產能配置模型
TFT-LCD 最適產能配置決策智慧型代理人可於確定之訂單資訊、有限產能限制下,
進行產能協調配置與多製程技術組構決策,並下達可接受之訂單組合、並以日為單位做 切割,明述批量與交期時間,俾使生產作業順利進行。
本計畫成果所建構之多製程產能環境下之協商模型,透過自主性協商決定資源配 置。代理人之間(多廠、各型技術、產品模組之間),以集團對集團的方式進行協商,
過程中相互不須知道對方所擁有的籌碼及協商底線,雙方並分別透過代理人針對議題進 行協商。對另一方提出提議值(Offer),並接收對方的反提議值(Counter offer)。
本研究所採用之「協商決策函式」(Negotiation decision functions, NDF)協商機制與 折衝(Negotiation Trade-offs)機制,可使代理人依據 TFT-LCD 生產企劃中之產能配置 結果,遂行生產控制衝突下之產能配置協調。本研究並比較不同系統參數(議題權重、
協 商 戰 術 ) 下 之 反 應 。 為 評 估 協 商 之 績 效 表 現 , 本 研 究 以 柏 拉 圖 最 佳 化 曲 線
(Pareto-optimal line)做為衡量標準,探討資訊分散情況下,代理人透過協商機制所獲 得之協議與最佳解之差距。議價與折衝協商包含了協商戰略(Negotiation strategies)、協商 戰術(Negotiation tactics)及多方協商函式(Multilateral negotiation functions)等三個層次,而 戰術層次包含了時間相依(Time dependent tactics)、資源相依(Resource dependent tactics)
17
及行為相依(Behavior dependent)等三類戰術,所有戰術皆是以多方協商函式為基礎進行 協商。
(9) 產能配置與營業績效評估之研究方法
本研究提出下列研究成果:
1. 根據當前台灣 TFT-LCD 面板產業之產能配置行為,發展屬於該產業之多製程 產能配置模式。
2. 探討產能配置與企業績效之因果回饋關係。
3. 分析 TFT-LCD 面板產業實務個案,歸納出如何有效運用有限產能方法,以提 供各種產能最佳之資源配適比例,提升企業績效。
4. 探討該產業產能與企業整體營運活動之 What-If 互動情形,以提供台灣面板產 業進行產能配置時之參考依據。
本研究以系統動態模擬進行產能配置與企業整體營運活動之 What-If 互動情形分 析。本研究以系統動態模擬,研究與分析 TFT-LCD 廠商特性與其產能配置所進行的評 估流程,並建立配置評估模型,從產能配置績效的角度,進行參數敏感度分析。在考量 風險變異情況下,比較所有產能配置方案。
本項研究架構如圖4.
18
TFT-LCD 廠 商技術產能 配置決策
製程技
術
產品模
組
配置限
制
TFT-LCD 廠商 生產企劃部門 與生產控制活 動
7.過程之衡量及回饋
產 能 配 置 模式
新技術/產 能 協 調 模 式
專利
智慧財產
TFT-LCD 廠商 其他部門
製造
行銷
工程
財務
觀察 TFT-LCD 廠 商之績效
成本降低
客 戶 達 交 率 增加
技 術 產 能 利 用率提昇
6.綜效 稅前淨利 9.效果衡量及回饋
8.輸出衡量及回饋
圖4. TFT-LCD 廠商產能配置之績效評估系統
1.輸入 2.處理系統 4.應用系統 3.輸出 5.效果
19
四、計畫成果自評
本案研究成果已獲國際期刊所接受論文10 篇、接受本案資助所完成之碩士生論文計 5 篇,詳如參考文獻。本案承蒙國科會經費補助,謹此致謝。
本案對於學術研究、國家發展及其他應用方面之貢獻包括:
1. 建構面板產業的多製程產能配置最佳化模型,使 TFT-LCD 製造廠商得運用有限 產能來達到產品模組生產最佳化。
2. 整合主生產企劃面多製程產能配置層、生產控制面多製程產能協調決策層與產 能配置績效評估層之產能配置決策,提昇TFT-LCD 產業的核心競爭力。
3. 提供具體的多製程產能配置架構與模式,以供企業發展之參考。
4. 培養具供應鏈產能配置能力之 TFT-LCD 產業相關人才。
5. 發展面板產業產能規劃與營運績效之系統動態模擬模型,使 TFT-LCD 製造廠商 得探討有限產能技術投入與營運績效之關係,以進行產能最佳配置。
6. 萃取設備/技術投資之產能配置、產能協調與績效評估層之企業決策規則,以供 企業決策之參考。
在此研究中,所有參與計劃人員已獲得之訓練包括:
1. 強化參與本案研究生之 TFT-LCD 產業專業性,未來可容易為該業界所運用。
2. 經由針對 TFT-LCD 產業之研究,得到以智慧型代理人技術進行產能配置與協調 決策之實際証明與應用機會,可充分銜接理論模型與實務經驗。
3. 可學習到分散式人工智慧的進階理論,特別於量化產能配置決策、多製程產能 協調模型與柔性求解方法之研究。亦可藉此一計畫之進行與國內外該領域同儕 之研究水準同步化。
4. 經由實證智慧型代理人於 TFT-LCD 產業之研究,獲得智慧型代理人系統設計的
20
實務經驗,有助於日後智慧型生產系統之發展。
5. 強化參與本案研究生於 TFT-LCD 產業實例決策環境中萃取企業規則之能力,未 來得於產業中應用推廣所學。
6. 藉由實證 TFT-LCD 產業投資決策、資源規劃與產能分派對績效影響之機會,強 化本案參與人員解析掌握企業關鍵決策議題之能力。
五、本案研究成果之學術文獻與碩士生論文
1. 王孔政 (2010) 提昇 TFT-LCD 產業中需求與產能配置效益之優化決策支援模式,國科 會 工 程 科 技 通 訊 , 第 一 O 八 期 十 月 刊 , p 33-36. Also http://nts.etpc.ncku.edu.tw/Magazine/magazine.htm
2. Lin, Y. S., Yu, Jonas C.P., and Wang K.-J.♣ (2009) An efficient replenishment model of deteriorating items for a supplier-buyer partnership in hi-tech industry, Production Planning and Control, 20(5) 431-444. (SCI).
3. Wang K.-J.♣ and Chen M.-J. (2009) Cooperative capacity planning and resource allocation by mutual outsourcing using ant algorithm in a decentralized supply chain, Expert Systems With Applications, 36(2), Part 2, March 2009, 2831-2842. (SCI)
4. Wang K.-J.♣, Vijay Shekhar Jha, Gong D. C., Hou T. C. and Chiu C.-C. (2009) Agent based knowledge management system with APQP: Implementation of semiconductor manufacturing services industry, International Journal of Production Research, accepted. (SCI)
5. Wang K.-J.♣, Lin Y.-S., Chien C.-F., and Chen J. C. (2009) A fuzzy-knowledge resource-allocation model of the semiconductor final test industry, Journal of Robotics and Computer-Integrated Manufacturing, 25(1), February 2009, 32-41. (SCI)
6. Yang, S.-J.♣, Yang, F.-C., Wang, K.-J. Chandra, Y. (2009) Optimizing resource portfolio planning for capital-intensive industries under process-technology progress, International Journal of Production Research, accepted. (SCI)
7. Yu, J.C.P., Wee*, H.M., and Wang K.-J. (2008) Supply chain partnership for three-echelon on deteriorating inventory model, Journal of Industrial and Management Optimization (JIMO), 4(4), 827-842. (SCI)
8. Chen J.-C., Wang K.-J.♣, Wang S.-M. and Yang S.-J. (2008) Price negotiation for capacity sharing in a two-factory environment using genetic algorithm, International Journal of Production Research, 46(7), 1847-1868. (SCI)
9. Wang K.-J., Wang S. M. ♣, and Chen, J. C. (2008) A resource portfolio planning model using sampling-based stochastic programming and genetic algorithm, European Journal of Operational Research, 184(1), 327–340. (SCI)
10. Wang K.-J.♣ (2008) Design of an agent-based distant and distributed manufacturing control system, International Journal of Manufacturing Technology and Management, Special Issue on Digital Manufacturing, 14(1/2), 66-83.
11. Hou T. C., Gong D. C., Wang K.-J.♣, and Shekhar Jha, V. (2008) Knowledge management centric intelligent manufacturing systems for semiconductor manufacturing services industry, Journal of the Chinese Institute of Industrial Engineers, in press, 25(6). (TSSCI)
12. 葉仲琦,民國九十九年,碩士論文:多元創新營運模式—系統動態模型之建立與評估 (Modeling and evaluating of multiple innovative business models using system dynamics),國 立台灣科技大學科技管理研究所。指導教授:王孔政博士。
♣ Corresponding author
21
13. 江鎮城,民國九十九年,碩士論文:二階規劃求解 TFT-LCD 面板產業產能配置及複合 運輸規劃之研究(Two-Stage Programming for Capacity and Transportation Planning in TFT-LCD Supply Chains),國立台灣科技大學工業管理研究所。指導教授:王孔政博士。
14. 陳朝政,民國九十八年,碩士論文:TFT-LCD 供應鏈產能規劃與配送模型(Capacity and Transportation Planning for a TFT-LCD Supply Chain),國立台灣科技大學工業管理研究 所。指導教授:王孔政博士。
15. 林靜敏,民國九十八年,碩士論文:TFT-LCD 製造公司部門間目標衝突代理人之協商 機 制 模 型(Negotiation Mechanism model for resolving conflicts among sectors of a TFT-LCD manufacturing firm),國立台灣科技大學工業管理研究所。指導教授:王孔政 博士。
16. 曹偉杰(Vijay Shekhar Jha),民國九十七年,碩士論文:Knowledge management centric intelligent system with modified APQP : A case study for a potential solution for the future challenges of semiconductor industry,國立台灣科技大學工業管理研究所。指導教授:王 孔政博士。
22
行政院國家科學委員會補助國內專家學者出席國際學術會議報告
98 年 12 月 10 日 報告人姓名
王孔政
服務機構及職稱 台灣科技大學工管系教授 會議 時間
地點
98 年 11 月 30 日至 98 年 12 月4 日澳門
核定補助 補助編號: NSC 97-2221-E-011 -091 -MY2
會議名稱 中文: 參加「第九屆電子化企業國際會議」
(英文) The Ninth International Conference for Electronic Business (ICEB 2009) November 30 - December 4, Wynn Macau
發表論文題目 Modeling and evaluating of business revenue models under different product life cycles using system dynamics simulation
一、參加會議經過及其學術地位、重要性:
本會議係電子化企業領域十分重要的國際會議之一。本研討會對我國電子化企業的研究發展助 益良多。研討會議程共5 天,發表百餘篇論文,每篇均經過多位專家審查推薦才被接受,論文接受 率低。多個國家參與論文發表。在該會議中主持一項議程(Session)並宣讀發表。
The growth of Internet has pushed the wave of e-Business adoption to all walks of life. In the past annual conference, we have looked into e-Business issues from many different aspects including logistics, supply chain, mobile commerce, globalization, Web 2.0 and others. In light of the movement of technology adoption in our society, the attention this year is moving toward ubiquitous e-Services in digital society. The aim of the 9th International Conference on Electronic Business (ICEB 2009) is to foster the exchanges of research findings, innovative ideas and industrial practices in the area of e-Society, e-Life, and e-Business.
All submitted papers will be reviewed using the double-blinded. The papers accepted for presentations at the conference will be further evaluated for possible submission to the following journals collaborating with our conference.
•Special issue in Information & Management (I&M) listed in SSCI
•Special issue in International Journal of Electronic Commerce (IJEC) listed in SSCI
•Special issue in International Journal of Electronic Business (IJEB) listed in EI 二、與會心得
此次大會的內容非常豐富,除了論文發表之外,並邀請好幾位資深學術界代表對電子化企業做專 題演講。各領域的與會學者們將研究所得發表並和與會者熱烈討論。筆者與他國教授建立溝通管 道、論文合作及心得交換。此外也從他人發表的論文中,激發新的研究構想。
三、建議
本項會議為電子化企業領域十分重要的國際會議,建議國內學者多參與。與會各國人員幾乎全是 博士身份,特別是韓國各大學教師參與人數最多,可見他們對學術研討會的重視;盼往後有更多 機會參與相同的國際性研討會以增廣見聞,增進國際觀。
四、 攜回資料名稱與內容
會議論文摘要集及會議 Programs and Information。
Du, Cheung, and Chu
The 9th International Conference on Electronic Business, Macau, November 30 - December 4, 2009
MODELING AND EVALUATING OF BUSINESS REVENUE MODELS UNDER DIFFERENT PRODUCT LIFE CYCLES USING SYSTEM DYNAMICS
SIMULATION
Wang, K.-J. 1 (Corresponding author), Tzeng J.L. and Jiang S. P.
Department of IndustrialManagement
National Taiwan University of Sciecne and Technology (Taiwan Tech)
Abstract
Business revenue modelling is one of the important aspects of enterprise planning to create values for enterprises. In this study, we construct a system dynamics simulation model to evaluate various business revenue models applied to e-platforms.
Machining tools industry is investigated as a case study. Products with different life cycles are examined as applying different business models.
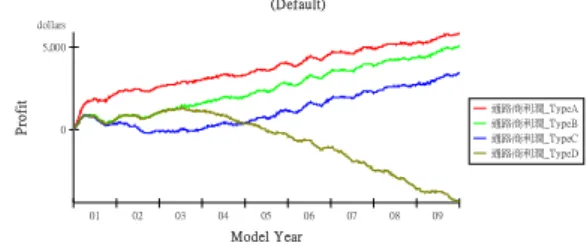
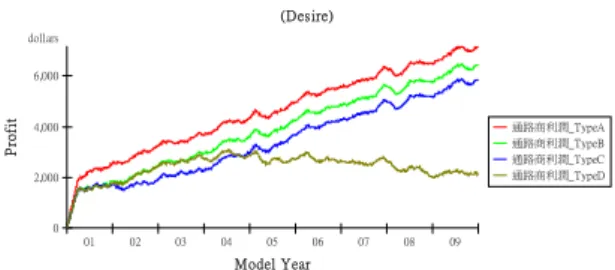
Computational experiments are conducted and results are discussed. Specific research issues/contributions of the study include: 1. To propose four effective business revenue models in such an industry. 2. To evaluate the proposed business revenue models as well as their advantages/disadvantages by a system dynamics simulation. 3. To address managerial implications of these business revenue models to the industry.
As a conclusion to our research, we show that: (i) Firms with products under growth or mature stage of life cycle adopt/switch appropriate business revenue models conforming to their requirements in different stages and result in high performance outcomes than those remaining in a single business revenue model. (ii) Business revenue models represented by causal loops of system dynamics and examined by system simulation can capture not only steady states but transient states of business activities. By taking advantages of the proposed approach, managers can thus efficiently make right decisions for reducing time and cost.
Keywords: Business Revenue Model, System Dynamic, Operate Performance Evaluate, Technology Life Cycle
Introduction
Business model is important to enterprise for earning profit [1,2,3,4]. Even an enterprise has excellent quality of products and services, the lack of a good business model still cannot obtain high profit. Enterprises cannot find their suitable business model by try-and-error which would leads to fatal failure. System Dynamics (SD) and simulation is a powerful tool to examine suitable business models for enterprises [5,6,7].
In this study, a case company in the measurement instrument industry is investigated. It currently follows a traditional business model, in which the firm's products are sold through direct sales force, distribution, OEM and sales agents to customers. However, the quality and technical ability of the products provided by the other firms in this industry is almost the same. There is few gaps between the firm and its competitors and thus weaken the ability of its revenue growth [3,5]. This study aims at examining potential profitable business models, and opened the gap with its competitors.
According to above description for the background and motivation has established the following three objectives: 1. To propose potential business models. 2. To develop a system dynamics simulation model to assess the advantages of the proposed models. 3. To assist enterprise applications in the business model.
The rest of this paper is organized as follows.
Literature review in section two is conducted to define business model, performance evaluation and system dynamics modeling methodology. In section 3, we establish several novel business models and use system dynamics to represent their system architecture. Section 4 uses scenario-based simulation to investigate the outcomes of different models. Finally, conclusion and recommendation is in given in section 5.
Literature Review
Business model is defined by Magretta [8].
Business model is actually a story of how to operate a company and is a plan to make money.
System dynamics (SD) is a powerful tool in the creation of feedback theories. Many guidelines and case studies have been developed by founders and practitioners of this field for the model building process and a series of tests to build confidence in the models created. An SD approach can be used to demonstrate how managing processes of accumulation and depletion of strategic assets, detecting inertial effects of decisions to help entrepreneurs in understanding opportunities and pitfalls related to e-commerce strategies. SD is a method of solving problems by computer simulation. Like many simulation methods, it offers the promise of less expensive learning to experiment with the effect of new policies on a
Du, Cheung, and Chu
The 9th International Conference on Electronic Business, Macau, November 30 - December 4, 2009 computer model than on a real system with real
people, equipment, and processes. SD can be applied in various fields, such as analyzing mine disasters, dealing failure and robustness in single development projects, and working on e-commerce strategies. SD can also be combined with other management tools: for instance, to combine system dynamics with conjoint analysis for strategic decision making.
This study not only constructs a common business model, but also constructs the other two new potential business models. This study uses Powersim® simulation software to build the system dynamics models and evaluates via scenario-based simulation for the case company of this study.
Model Construction
For the construction of business models, this study sets the followings assumptions: (1) Only a single product exists. (2) The demand of a product subjects to a normal distribution (Normal (μ = 2.5, σ = 0.8) (Number / Day). The forecast uses a naive method that the forecast of the upcoming period is equal to the actual sales of the last period. (3) No backorder. (4) The payment collection risk subjects to a Uniform distribution (Uniform (0,1)) (5) The account receivables will not recover if such failure occurs. (6) The product price is inversely proportional to its remaining life cycle. (7) Product unit cost is inversely proportional to its remaining life cycle. (8) Installment interests uses a simple interest calculation. (9) After the product reaches its maturity stage in life cycle, it continues to be sold.
In this study, the product life cycle and technology development is classified as Sustained Matured Products (Type A), Rapid Matured Products (Type B), Slow Matured Products (Type C) and Entire Life-Cycle Products (Type D). The following section describes the technology life-cycle cost and price assumptions.
Product types
There are four types of products addressed in the study, sustained mature products, rapid matured products, slow matured products and entire life cycle products.
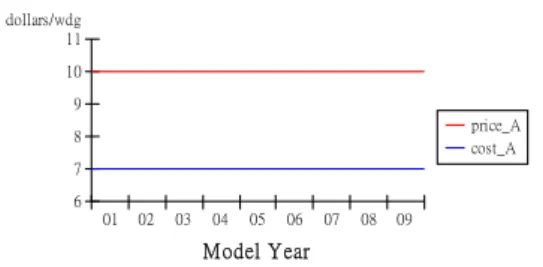
The technology life-cycle curve of Sustained Mature Products (Type A) is constant, such as daily necessities, The demand is stable, The product technology is difficult to get a breakthrough. The unit price and cost is constant as shown in Figure 1.
01 02 03 04 05 06 07 08 09 6
7 8 9 10 11 dollars/wdg
price_A cost_A
Model Year
Figure 1. The relationship between price and cost (Type A)
Rapid matured products (Type B) is the second type of products investigated in the study.
Kuznets (1930) proposed S-curve model for describing future technological change in the technology evolution. Foster (1986) advocated that S curve can be used to establish a technology life cycle and present the results of technology development.
The S curve equation is given below:
t t
e Y Kα +β
= + 1
1 where Yt is the technical performance at time t; K1 is the upper limit of technology performance; α is the parameter of lower limit of technology performance; and β : shape parameter.
The lower limit of technology performance, u1, is defined as follows for simulation use. The parameter α is converted to be the function of the lower limit of technology performance.
⎟⎟⎠
⎜⎜ ⎞
⎝
⎛ −
=ln 1
1 1
u α K
The derivation is as follows:
t t
e Y Kα+β
= + 1
1
t t
Y e K1 1
+ =
⇒ α+β 1
= 1 −
⇒ +
t t
Y
eα β K ⇒ + = 1−1
t t
Y eα β K
when t=0, let Yt=u1. Therefore,
⎟⎟⎠
⎜⎜ ⎞
⎝
⎛ −
=ln 1
1 1
u α K
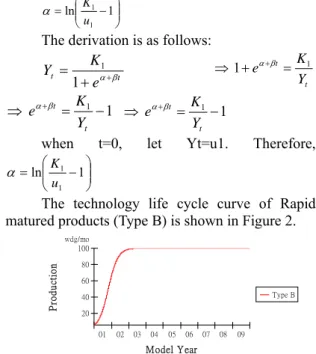
The technology life cycle curve of Rapid matured products (Type B) is shown in Figure 2.
01 02 03 04 05 06 07 08 09 20
40 60 80 100 wdg/mo
Type B
Model Year
Production
Figure 2. Technology life cycle curve (Type B) The rapid matured products in the life cycle technology saturate within a short time, such as consumer electronics products. We assumed that the time of technology life cycle is inversely proportional to the product price. The price is high during products introducing to the market, and the scale of demand and production is small. When the product technology is matured, the price and cost is lowed. The S-curve formula is defined as follows:
( )( )
(K11 u21) 2
u K u Pt Yt
−
−
= −
,
where Pt is the price at time t;
K1 is the upper limit of Technology performance;
K2 is the upper limit of price; u1 is the lower limit of technology performance; and u2 is the lower limit of price.
Du, Cheung, and Chu
The 9th International Conference on Electronic Business, Macau, November 30 - December 4, 2009 The cost and price curve of rapid matured
product is shown in Figure 3.
01 02 03 04 05 06 07 08 09 10
15 20 dollars/wdg
price_B cost_B
Model Year
Figure 3. Price and cost curve (Type B)
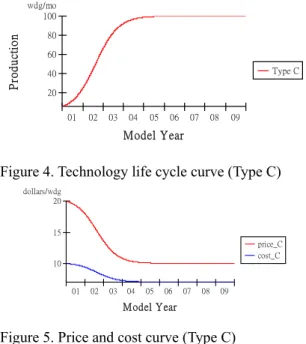
The third type of products is defined as slow matured products (Type C). The products require long time for the phase of its maturity stage owing to such as technological development bottleneck, difficulty in promotion, low customer acceptance or other factors. The technology life cycle curve and the price and cost curve are shown in Figures 4 and 5.
01 02 03 04 05 06 07 08 09 20
40 60 80 100 wdg/mo
Type C
Model Year
Production
Figure 4. Technology life cycle curve (Type C)
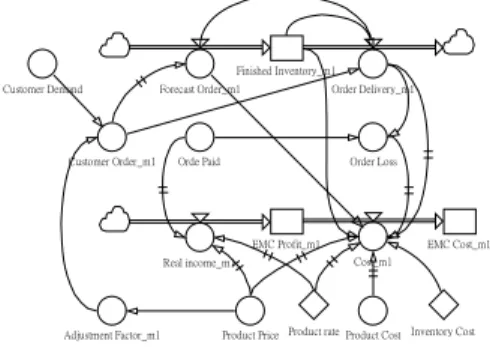
01 02 03 04 05 06 07 08 09 10
15 20 dollars/wdg
price_C cost_C
Model Year
Figure 5. Price and cost curve (Type C)
The Entire Life Cycle Products (Type D) are the type of luxury was launched with very significant features becoming a pioneer (Figure 6).
The customer is attracted to buy it under initial stage of market hot, but the competition increases dramatically. Then, the amount of the consumers and profits will reduce quickly. The curve of the entire life cycle technology presented by Gamma distribution as follow: Yt =u1+ta−1e−tb where Yt is the technical performance at time t; K1 is the upper limit of technology performance; α is the parameter of lower limit of technology performance; β is the shape parameter.
01 02 03 04 05 06 07 08 09 20
40 60 80 100 wdg/mo
Type D
Model Year
Production
Figure 6 Technology Life Cycle Curve (Type D) The price and cost relation is as follows:
( ) 2
1 1
2 1 2
u K K
u e K
t
Pt a tb ⎟⎟⎠+
⎜⎜ ⎞
⎝
⎛
−
− −
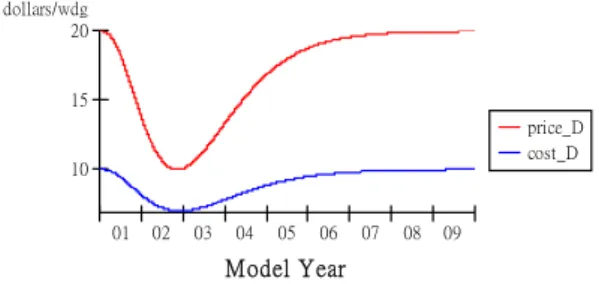
= − − , where Pt is the price at time t; K1 is the upper limit of technology performance; K2 is the upper limit of price; u1 is the lower limit of technology performance; u2 is the lower limit of price. The price and cost curve of Entire-Life-Cycle Products is shown in Figure 7.
01 02 03 04 05 06 07 08 09 10
15 20 dollars/wdg
price_D cost_D
Model Year
Figure 7. Price and cost curve (Type D) Business models
There are three business models addressed in the study, basic business model, sale-combined-with-installment-service business model, and with-installment-and-agent business model.
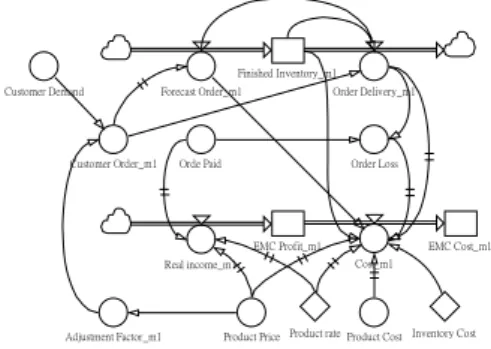
The basic business model (denoted as m1) is shown in Figure 8. A company employs sales records as the basis for demand forecasting and develops its production plans. When the demand is less than planned production, inventory is kept in a warehouse. After shipping, customers pay by checks of three-months.
Figure 8. The basic business model of instruments sales
According to the basic business model this study develops a causal feedback loop as shown in Figure 9. The performance indicator of business model of instrument manufacturer is represented by