行政院國家科學委員會專題研究計畫 成果報告
金屬板材微成形加工製程之成形性研究與應用--子計畫 一:金屬薄板微成形加工製程之基礎研究與應用
研究成果報告(精簡版)
計 畫 類 別 : 整合型
計 畫 編 號 : NSC 95-2221-E-011-042-
執 行 期 間 : 95 年 08 月 01 日至 96 年 07 月 31 日 執 行 單 位 : 國立臺灣科技大學機械工程系
計 畫 主 持 人 : 黃佑民
計畫參與人員: 博士班研究生-兼任助理:蔡毅瑋、張堯閔
報 告 附 件 : 出席國際會議研究心得報告及發表論文
處 理 方 式 : 本計畫涉及專利或其他智慧財產權,2 年後可公開查詢
中 華 民 國 96 年 10 月 18 日
1
行政院國家科學委員會專題研究計畫成果報告
金屬板材微成形加工製程之成形性研究與應用 子計畫一:金屬薄板微成形加工製程之基礎研究與應用
Fundamental study on micro forming process of metal sheet and
its application (I)
計畫編號:NSC 95-2212-E-011-042 執行期限:95 年 8 月 1 日至 96 年 7 月 31 日 主持人:黃佑民 台灣科技大學機械工程系 計畫參與人員:江卓培 虎尾科技大學動力機械系 劉銘倫 台灣科技大學機械工程系 蔡毅瑋 台灣科技大學機械工程系 張堯閔 台灣科技大學機械工程系 一、中文摘要
本計劃之目的在於建立微拉伸實驗之 平台與微衝壓模組,進行不同晶粒尺寸之 微拉伸試驗,提供其他子計畫之應力與應 變關係曲線,再進一步設計與製作微衝壓 模具,以求得不同晶粒尺寸之位移-剪應力 曲線。第一年之計劃目標為配合其它子計 畫製作微拉伸試驗片,目前已得到之鐵基 薄板金厚度可分為 1000、500、200、100 以及 50µm。為了避免外力切割時之殘留應 力影響到微拉伸結果,先以雷射切割的方 式進行試片處理,再以熱處理方式控制晶 粒大小約為 25~30µm、同時消除因雷射切 割加工所產生之殘留熱應力。目前已完成 設計一機構式定位夾持模組以固定試片於 微拉伸夾持模具並進行微拉伸試驗、微拉 伸軸自動控制、拉力以及真實位移量測以 及控制晶粒於 25~30µm 之範圍。
關鍵詞:微拉伸、微衝壓、晶粒尺寸 Abstract
The aims of this project is to develop a micro-tensile testing system consisting of mechanism design, automatic control, data acquisition interface, mechanical specimen alignment and micro-punching modulus. A laser cutting process is utilized for preparing standard Fe specimens which thickness are 1000, 500, 200, 100 and 50µm. Grain size of specimen is controlled in the range of
25~35µm by thermal treatment. An automatic alignment mechanism is designed for setup specimen. Control interface is developed consisting of motion stage and data acquisition included force and true displacement of stage.
Keywords: micro-tensile testing, micro-punch, grain size 二、緣由與目的
近年來,由於微機電系統(Micro Electro Mechanical Systems, MEMS)技術 的發展與創新,將系統微小化或以微小元 件形狀尺寸爲特徵的設計與應用獲得科技 界極高度之重視,逐漸成爲航太、精密儀 器、生物醫療等領域的研究重點。隨著微 機電系統從基礎研究階段逐步跨入研製開 發和實用階段,對於微機電系統零組件之 加工、加工質量、成本和批量等提出了新 的要求,這些要求的核心是希望能夠低成 本大量製造微小化元件。因此,傳統的黃 光製程或 LIGA 製程等微細加工技術已經 不能滿足微小化元件大量製造的要求;反 之,想應用在宏觀世界中之塑性成形技術 的特點如具有快速且低成本大量製造元件 的模具製程。爲此,許多的研究著重於將 精密微塑性成形技術應用到微小元件的製 造領域,大大地拓寬了該項技術的應用範
2
圍。精密微小化成形技術可以採用各種塑 性加工方法,如微沖壓(micro punching)、
微 拉 伸 (micro drawing) 、 微 擠 壓 (micro extrusion)、微鍛造(micro forging)、微壓紋 (micro embossing) 以 及 微 彎 曲 (micro bending)等項,微機電系統技術雖可以達到 500nm~20µm 的精度,但實際精密微小化 成形的各種複雜形狀的微小零件、其零件 的特徵尺寸僅需 20µm 到 900µm 範圍;因 此,微成形技術才能符合特徵尺寸範圍的 大量生產需求。
隨著微成形加工的需求大增,許多研 究開始探討其尺寸與體積的物理影響。
Vollersten 等人[1]即歸納尺寸效應的來源 可以分成物理與結構。物理來源共有純體 積尺寸效應(pure volume size effect)、表面 至 體 積 尺 寸 效 應 (surface to volume size effect)以及力相關尺寸效應(force relation size effect);而結構來源可分為晶粒尺寸至 厚度尺寸效應(grain size to thickness size effect) 以 及 表 面 結 構 大 小 能 力 尺 寸 效 應 (surface structure scalability size effect)。因 此,Gau 等人[2]即以實驗的方式進行鋁材 (Al 1100 O-temper) 以 及 紅 銅 材 (Brass 26000)進行拉伸以及彎曲實驗,其試片的 規格以 ASTM-E112 為標準,實驗後歸納發 現 降 伏 強 度 (yield strength) 與 拉 伸 強 度 (tensile strength)隨著 T/D 比(T:材料厚度;
D:平均晶粒大小)減少而減少、直到 T/D 比接近 1 為止。除此之外,兩者材料的可 延展性(或稱可成形性)隨著 T/D 比減少而 減少。因此,提出微成形流應力可以以 T/D 比為函數來表示之。同時,Gau 等人[3]也 對紅銅進行微板金成形之回彈(springback) 實驗,總結發現當板厚小於 350µm 時、傳 統的回彈觀念無法應用於紅銅板材,另提 出回彈可以以 T/D 比為函數替代厚度來表 示之。然而,Lee 等人[4]提出對微拉伸成 形實驗過程的精度準位質疑,認為微成形 的過程中、對準(alignment)精度會影響微拉 伸實驗的結果,因此、提出機構式夾持具 來安裝微拉伸試片,並以實驗的方式驗證 微試片在經由對準精度校正前與校正後的 應力與應變曲線之差異。
由於尺寸已進入微米級,在厚度方面
之晶粒尺寸的控制即成為重要參數。因 此,晶粒尺寸的效應已被獨立出來進行相 關成形研究[5-7],但表面晶粒大小的效應 卻鮮少討論。
綜合以上所述,微拉伸試驗的方法與 過程雖已有少數研究發表,但對試片對準 精度的要求、微拉伸過程中之位移量的偵 測與破斷過程的觀察等卻少有討論。這也 是本計畫研究的主要討論重點,因此、本 計畫即針對微拉伸實驗的規格、自動控制 以及資料擷取、光學真實位移量測等進行 設計、製作與界面程式撰寫等方面之研 究。此一平台的建立可以提供其它子計畫 的需求進行微 V 型彎曲實驗、微回彈研究 以及微引伸實驗等。
三、系統架構
在機構設計方面、微拉伸實驗系統包 含有 Z 軸拉伸滑動平台、Load cell 固定座、
微拉伸試片固定座以及微位移光學量測器 等。Z 軸拉伸滑動平台提供微拉伸試片垂 直穩定拉力,Load cell 固定座位固定於 Z 軸拉伸滑動平台與微拉伸試片固定座中 間,在微拉伸過程中回饋輸出類比電位。
微拉伸試片固定座的功能為固定微拉伸試 片外,亦能準確的提供與拉伸方向軸心之 準位校正。同時,光學位移感測器能回饋 提供真實位移。如圖 1(a)所示為系統組合 圖以及圖 1(b)為系統爆炸圖。如圖 2 所示 為機構組合寫真圖。
(a) 微拉伸系統組合圖
3
(b) 微拉伸系統爆炸圖 圖 1. 系統機構設計圖
圖 2. 系統機構寫真圖
(a)試片夾持模具組合圖
(b)試片夾持模具爆炸圖 圖 3. 試片夾持系統圖
為避免試片在安裝時產生變形,在試 片安裝設計上應用一模具夾持試片如圖 3 所示分別為試片夾持模具的組合圖(a)與爆 炸圖(b)。在試片安裝於上下模座後,兩側
裝設兩立體塊,並插入定位柱固定,即完 成整體模具組裝。為得使 Load cell 量測時 通過軸心,在最上方設計轉接板與夾持模 具連結,待模具安裝至微拉伸系統上後,
再將定位柱取出,並移除兩立體塊,即可 進行實驗。此模具設計優點為拆解方便,
且影響安裝精度最小。
Load cell 的選用決定拉伸負荷時的穩 定度與準確度,本研究所選用之可承受負 荷為±200N、亦即可以承受拉力與壓力,其 非線性率約為±0.3%,如圖 4 所示分別為 Load cell 的寫真圖(a)與尺寸圖(b),雖然其 重量為 2.3kg,但 Z 軸之扭矩與傳動力足以 承受。除此之外,超負荷容許裕度可超過 20%。
(a) Loa dcell 寫真圖
(b) Load cell 尺寸圖 圖 4. Load cell 規格圖
真實位移與數位位移之差別在於真實 位移是微拉伸平台實際走動的位移。由於 傳導桿的裕度與機構允許撓度所造成偵測 位移的誤差,因此數位位移(馬達控制器傳 輸數位訊號)即代表的位移為理論值。因 此,利用光學的技術偵測真實位移,由於 微試片的抗拉伸極限經由文獻得知位移未 達 10mm 即斷裂,為符合高精度與真實位 移的需求,選用量測位移為 10mm 之感測 器如圖 5 所示,分別為(a)寫真圖以及(b)位 移與類比輸出線性說明圖。
4
(a) 位移感測器寫 真圖
(b) 位移感測器量測 範圍圖 圖 5. 位移感測器規格圖
綜合以上所述,Z 軸之控制需要一片 運動控制卡來處理訊號的輸出與極限感測 器的讀取。在運動控制方式,其最高解析 度可到 0.1µm。在其它的數位訊號有 Load cell 以及位移感測器之回饋,為了得到確實 之數位電壓,以差位式接腳為電壓擷取歸 零,如表一所示為資料擷取需求表。
表一:資料擷取需求表
Load cell 輸入電壓:1 to 10V ac or dc 輸出電壓:±200N/輸入電壓 Displacement
sensor
輸入電壓:24VDC
輸出電壓:全幅±5V 的類比 電壓,當無法執行量測時,
則輸出+12V 電壓。
四、試片準備
依 據 ASTM 規 範 E8-01(Pin-Loaded Tension Test Specimen) 規 格 與 尺 寸 縮 小 1/4,如圖 6 所示。利用準分子雷射切割鐵 基與銅基材質試片如圖 7(a)與(b)所示。但 在本實驗卻發現鈦基材料並不適合準分子 雷射,雖然其熔點約為 1700°C,僅高於鐵 基約 100°C,但卻無法有效切割,原因有 待進一步探討。
圖 6. 試片規格圖
(a) Fe 基試片圖
(b) Cu 基試片圖 圖 7. 試片加工完成寫真圖 五、實驗規劃
本計畫之執行重點除了建立微拉伸實 驗平台外,亦將進行於平均相同晶粒大小 下,不同厚度的影響之實驗,進而建立成 形性曲線。因此,鐵基厚度的規格共有 1000、500、200、100 以及 50µm。重直準 位的誤差分析可以得知實驗的誤差,但更 值得分析的是理論位移與真實位移之影 響,因此,本計畫將探討位移直接影響應 變與成形性的能力分析。
子計畫五之晶粒熱處理的控制技術已 經可以達到 25~450µm 之平均晶粒大小,
因此,將以此進行厚度與平均晶粒關係之 成形性實驗。
如圖 8 所示為利用本計畫開發之微拉 伸 試 驗 平 台 更 換 微 拉 伸 模 具 為 微 V-bending 模具即可以進行實驗。但另一需 考量的因素也是定位問題,需確認試片之 真平度與模具之貼合度。除此之外,可以 分析 V-型衝頭之下衝與回衝速度所造成之 回彈效果。
5
圖 8. 提供子計畫五之微 V-bending 實驗寫 真圖
六、參考文獻
1. F. Vollertsen et al., State of art in micro forming, Int. J. of Machine Tools & Manufac. 46 (2006), 1172-1179.
2. J. T. Gau et al., An experimental study on size effects on flow stress and formability of Al and brass for microforming, J. of Mat. Proc. Tech.
184 (2007), 42-46.
3. J. T. Gau et al., Springback behavior of brass in micro sheet forming, J. of Mat. Proc. Tech. 191 (2007), 7-10.
4. H. J. Lee et al., A precision alignment method of micro tensile testing specimen using mechanical gripper, J.
of Mat. Proc. Tech. 187-188 (2007), 241-244.
5. T.A. Kals et al., Miniaturization in sheet metal working, J. of Mat. Proc.
Tech. 103 (2000), 95-101
6. E. Nakamachi et al., Elastic/crystalline viscoplastic finite element analysis of single- and poly-crystal sheet deformations and their experimental verication, Int. J. of Plasticity 16 (2000) , 1419-1441
7. P. Janssen, Grain size effects in micro-forming: an experimental analysis, Master Thesis (2003), Eindhoven University of Technology.
6
- 1 -
出席第八屆亞太塑性工程及其應用研討會議報告
( T h e 8t h A s i a - P a c i f i c S y m p o s i u m o n E n g i n e e r i n g P l a s t i c i t y a n d I t s A p p l i c a t i o n s )
姓 名 : 黃 佑 民
服 務 機 構 及 職 稱 : 國 立 台 灣 科 技 大 學 機 械 工 程 系 教 授 會 議 時 間 地 點 : 2 0 0 6 年 9 月 2 5 - 2 9 日 於 日 本 名 古 屋 市 國 科 會 核 定 計 畫 編 號 : N S C 9 5 - 2 2 2 1 - E - 0 1 1 - 0 4 2
會 議 名 稱 : 第 八 屆 亞 太 塑 性 工 程 及 其 應 用 研 討 會
The 8th Asia-Pacific Symposium on Engineering Plasticity and Its Application (AEPA2006)
發 表 論 文 題 目 :Development of Stereolithography Simulation Process based on the Dynamic Finite Element Method
一 . 參 加 會 議 經 過 :
此 研 討 會 之 主 題 是 針 對 各 種 塑 性 加 工 工 程 領 域 ( 包 括 材 料 之 構 成 方 程 式 、 材 料 之 破 壞 、 實 驗 與 數值模擬技術、最新材料 之 塑 性 行 為 、 材 料 之 塑 性 成 形 製 程 分 析 、 超 塑 性 材 料 等 ) 的 研 究 發 表 與 心 得 交 換 , 讓 與 會 者能透過此研討會共享研究成果。
此 研 討 會 為 第 八 屆 , 由 Nagoya University 、 The Japan Society of Mechanical Engineers 、 The Society of Materials Science, Japan 、 The Japan Society for Technology of Plasticity 及 JSMS Committee on Engineering Plasticity 聯 合 主 辦 , 本 人 將 近 年 來 於快速原型製程之研究心得藉此研討會予 以 發 表 , 並 藉 由 參 加此次研討會,與世界各國之學者專家做一 次 面 對 面 的 溝 通 與 交 換 心 得 ,了解各國在有關快速原型加工方 面 之 進 展 , 做 為 日 後 研 究 之 參 考 。 研 討 會 分 為 24 場 Sessions 發
- 2 -
表,Session 1發表的主題為Metal Forming,Session 2發表的 主 題 為 Crystal Plasticity , Session 3 發 表 的 主 題 為 Multiscale Analysis , Session 4 發 表 的 主 題 為 Composites , Session 5 發 表 的 主 題 為 Metal Plasticity , Session 6 發 表 的 主 題 為 Rocks, Stones and Concretes , Session 7 發 表 的 主 題 為 Soils , Session 8 發 表 的 主 題 為 Joints , Session 9 發 表 的 主 題 為 Buckling and Stability , Session 10 發 表 的 主 題 為 Dynamic Behavior , Session 11 發 表 的 主 題 為 High Temperature , Session 12 發 表 的 主 題 為 PhaseTransformation , Session 13 發 表 的 主 題 為 FEM , Session 14 發 表 的 主 題 為 Foams , Session 15 發表的主題為 Molecular Dynamics , Session 16 發表的主題 為Indentation,Session 17發表的主題為Damage,Session 18 發 表 的 主 題 為 Beams and Frames , Session 19 發 表 的 主 題 為 Welds , Session 20 發表的主題為 Fracture , Session 21 發表的 主 題 為 Polymers , Session 22 發 表 的 主 題 為 Shape Memory Alloys , Session 23 發表的主題為 New Materials , Session 24 發表的主題為Fatigue and Strength,共有來自世界各地四百多 篇論文發表。本人所發表之論文被安排在第三天Session 1的第 3 位 發 表 , 由 於 發 表 的 論 文 很 多 , 所 以 每 篇 論 文 之 發 表 時 間 只 有 二 十 分 鐘 , 因 此 必 須 非 常 簡要,如果有需深入的了解的話,
就 必 須 於 會 後 私 底 下 討 論 。本人所發表的內容較偏重於快速原 型 加 工 製 程 之 模 擬 處 理 ,因此引起許多學者專家之興趣,所以 會 後 於 會 場 聚 集 一 起 討 論 ,有些學者也提出他們的處理方式供 我 參 考 , 因 此 獲 益 甚 多 。 此 外 , 我 亦 積 極 參 與 各 領 域 之 研 討 會,雖非本人之專長,但藉此機會也學到一些新知。
- 3 -
二 . 與 會 心 得 :
此 次 會 議 之 特 色 在 於 邀 請 六 位 Keynote Speaker 演 講 , 其 演 講 時 間 皆 排 於 每 天 上 午 , 以便大家都去聽,這些主題都是有 關 最 近 在 塑 性 工 程 領 域 之 研 究 , 由 這 些 論文之發表,讓我了解 在 相 關 領 域 之 各 國 學 者 之 研 究方向與研究成果,並讓我深深體 會 我 們 該 努 力 的 地 方 還 是 相 當 多 。 此 行除了讓我了解到目前世 界 上 之 研 究 成 果 與 未 來 之 動 向 外 , 並 利用聽講之機會與參加的 各 國 人 士 交 換 意 見 並 了 解 他 們 在 做 些 什麼樣的研究,增加一些 研 究 上 之 經 驗 , 故 本 人 覺 得 此行非常值得,對本人將來之研究 助益相當大。
三 . 建 議 :
此 次 經 國 科 會 補 助 , 使 筆 者 得 有 機 會 參 加 這 次 的 國 際 會 議 , 除 了 發 表 研 究 論 文 並 了 解各國先進所給予之見解外,並進 而 獲 悉 世 界 各 國 在 塑 性 工 程 領域方面之新思維與將來研究之趨 勢 , 可 謂 受 益 良 多 。 此 次 會 議 之 舉 行,日本的名古屋大學挑起 主 辦 的 責 任 , 希 望 將 來 我 們 也 能 有 一 些 機 會 能 結 合 各 校 之 力 量 , 舉 辦 一 些 這 類 型 國 際 性 的 研 討 會 , 藉 此 不但可提升學術風 氣外,亦可提高我們的國際地位。
四 . 攜 回 資 料 名 稱 及 內 容 :
Proceeding of The 8th Asia-Pacific Symposium on Engineering Plasticity and Its Application.
Development of Stereolithography Simulation Process Based on the Dynamic Finite Element Method
You-Min Huang1, a and Cho-Pei Jiang2,b
1 Department of Mechanical Engineering, National Taiwan University of Science and Technology, 43 Sec.4, Keelung Rd. Taipei 106,Taiwan
2 Biomedical Electronics Device and Technology Center, Industrial Technology Research Institute, 195 Rm. 334 B.53, Sec. 4, Chung Hsing Rd., Chutung Hsinchu 310, Taiwan
a[email protected], b[email protected]
Keywords: stereolithography, finite element
Abstract. In this study, a general simulation code is developed to analyze the shrinkage effect of polymerization and optimize the fabrication parameters including the scanning path, exposure time and scanning speed for the stereolithography system. The code is based on the dynamic finite element method. Liquid element is preconstructed without curing properties till the absorption energy exceeds the critical value of dynamic stiffness matrix assembling. A unit element block is utilized with a weight coefficient for expressing a laser Gaussian energy distribution during the discretizing of the scanning path into increments. A fan blade is proposed to validate the agreement between the simulation and experimental results. The prototype is a fabrication and the surface of blade was measured by the digitizing system ATOS (Advanced TOpometric Sensor) for comparing the deformation with analysis prediction. Consequently, the simulated result closely conforms to the experimental result.
Introduction
Stereolithography (SL) is a layered manufacturing process, widely used in prototype fabrication. It produces parts by scanning an appropriate laser over a photocurable resin, causing liquid to polymerize into a solid. It is convenient to divide the SL system into two classes, one that builds parts by sinking in the resin tank and one by lifting parts out of the resin tank [1]. The main drawback of these two classes, which is extremely critical to solve, is the shrinkage effect. Since shrinkage causes the most serious inaccuracies in the built-up process, many studies [2-6] have focused on observing and simulating the photopolymerization phenomenon in order to reduce this error. It was found that shrinkage occurs not only because of the monomer cross-link process but also due to the scanning path. Therefore, a dynamic finite element method has been proposed [7] to simulate the deformation results according to the scanning path and find the optimal parameters to obtain less deformation of prototypes.
It is well known that deformation is caused by the shrinkage resulting from photopolymerization. The shrinkage effect is related to absorption energy, scanning path, cured volume and layer geometry. To predict the deformation of a designed model prior to fabrication, optimizing the scanning parameters can both increase efficiency and obtain a high precision prototype. In this study, theoretical analysis, the algorithm of the developed code and element management are briefly introduced. A benchmark model is proposed and analyzed in accordance with scanning path planning. The proposed model is fabricated and its fin surface is rebuilt by a digitizing system in order to verify the reliability of the developed code. Simulation and experimental results are compared and discussed.
Key Engineering Materials Vols. 340-341 (2007) pp. 329-334 online at http://www.scientific.net
© (2007) Trans Tech Publications, Switzerland
All rights reserved. No part of contents of this paper may be reproduced or transmitted in any form or by any means without the written permission of the publisher: Trans Tech Publications Ltd, Switzerland, www.ttp.net. (ID: 140.118.196.207-08/02/07,06:54:15)
Theoretical analysis
Tanaka [7] proposed a dynamic resin model, according to Narahara’s [5] report where the shrinkage rate is dynamic and depends on absorption exposure energy and elapsed time, based on curing properties following photopolymerization. This was presented to simulate the shrinkage of built parts.
In order to predict the final deformation of built parts and to understand the path planning effect, a fundamental study [8] was conducted for discovering the relationship of exposure energy, exothermic temperature and hardness. That study found that the uncured liquid becomes more viscous because of the exothermic temperature of the cured resin. A completely mathematical model for the dynamic properties of photopolymerization has been proposed and presented. It is assumed that the deformation of the resin consists of elements as follows:
{ }∆ε =
{ } { } { } { } { }
∆εe + ∆εγ + ∆εT + ∆εν + ∆εP (1) where{ }
∆εe indicates the elastic strain,{ }
∆εγ is the strain of cure shrinkage that can be expressed as( )E,t β
∆ ,
{ }
∆εT is the thermal strain that can be rewritten as α∆T ,{ }
∆εν is the viscous strain, and{ }
∆εP is the plastic strain. During the photopolymerization process, the plastic strain is relatively small and can be neglected. Consider the case in which { }σ& is equal to [ ]D{ }
ε&e and { }ε& is equal to[ ]B{ }u& , substituting the relationship above and
∫
dV[ ] [ ]B T D into Eq. (1), we have the following equation:[ ] [ ]{ } [ ] { } [ ] ( ){ ( )}
[
− − 3 ∆ +∆]
=0∫
dV BT D u B T BT T EV
β α
κ
σ (2)
Consequently, the constitution equation of dynamic finite element analysis for the photopolymerization can be written as [ ]K { } { }u − f =0, and the stiffness matrix can be expressed:
[ ]=
∫ [[ ] [ ][ ]]
V
T D B
B dV
K (3)
The effective nodal force is given by
{ }=
∫ [[ ] { }+[ ] ( ){ ∆ +∆ ( )}]
V
T
T B T E
B dV
f σ& 3κ α β (4)
where α denotes the expansion coefficient, which can be obtained from the thermal expansion testing; κ denotes volume strain; ∆T is the temperature increment; and ∆β( )E is defined as the strain of cure shrinkage, which is a function of the laser exposure (E) and elapsed time (t).
In photopolymerization, the increased molecular weight and the cross-linking of monomer together cause phase transition in the photopolymer from a liquid state to a solid state. This result leads to the increase in the strength of photopolymer. The phenomenon has been explored [9] and the mathematical model of the elastic modulus of curing resin Y is considered to be a function of exposure energy E and exposure time te, which is given as
(
α)
γβ
e C Y
Y E t
E MAX
e Y e e
t E
Y −
−
− −
−
= 1 1
) , (
1
(5)
where YMAX is the maximum elastic modulus; EC is the critical exposure quantity; and αY and βY are dimensionless constants, of which βY is directly proportional to EC. The γ is defined as f(T)/f (room temperature) that can be obtained from the relationship of reaction rate and exposure time, and
Engineering Plasticity and Its Applications 330
T is indicated as the temperature. A dynamic mathematical model of cured shrinkage has been established as follows [7]:
( )n
(
te)
final
n ε E e αε
ε = 1− − (6)
where εn is the total cure shrinkage under exposure En and αε is a constant. It can be derived as:
(E te) ε { [ αa(E Ec) αbte]}[ ( αcte)]
ε , = max 1−exp− / − 1−exp − (7)
where εmax is the maximum cured shrinkage, αa is the coefficient of the cure reaction rate at the initial laser exposure, αb is used to model the continuing shrinkage, and αcis used to illustrate the initial part of the cured shrinkage curve. With a higher value αa, a more rapid reaction occurs in the cure shrinkage.
Element Management and Simulation Algorithm
Determining element birth and estimating curing degree is the main issue of element management.
Liquid elements are pre-constructed without curing properties. The information of the laser curing depth and width, current layer thickness and scanning direction are recorded into the memory core.
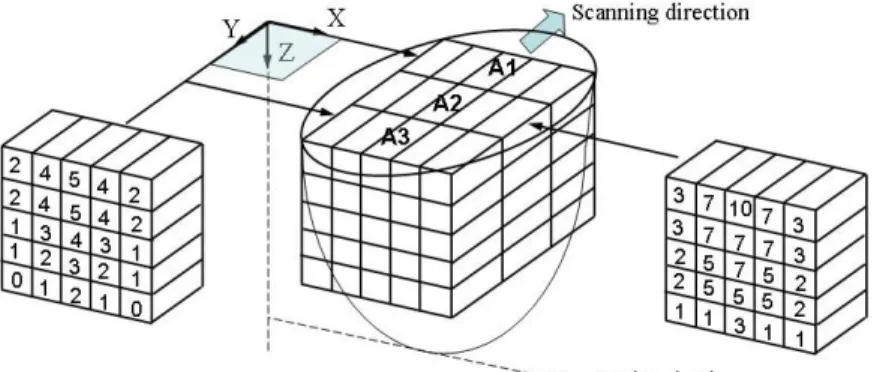
The laser scanning movement is considered as a discretization problem. At this increment, the laser is moved to a pre-set position. The X-Y plane indicates the resin liquid surface and assumes the cured tiny volume is an element block as shown in Figure 1. The elements which are located above the penetration depth become active when the absorption energy exceeds the critical value. The cured level is indexed by the proposed weight coefficient according to a Gaussian energy distribution of the static laser exposure. Full curing is indexed as 10 in the centre of the laser beam. The smaller the coefficient, the less energy is absorbed. The weight coefficient changes to 11, showing that the subdivided element has become over cured when it is re-exposed and that it absorbs excess energy.
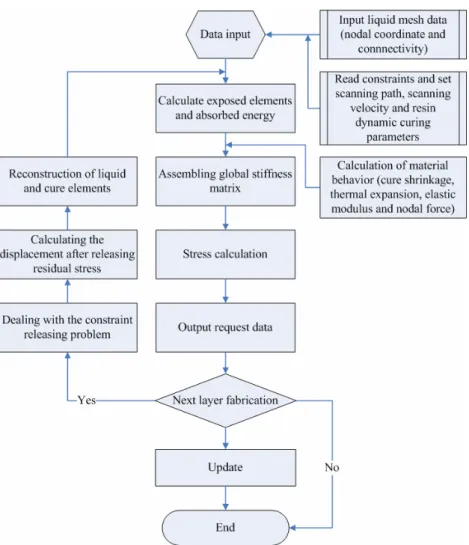
The flowchart of the simulation process is illustrated as shown in Figure 2. The liquid mesh is pre-created and read into the matrix core. The properties of the liquid mesh have no cure characteristics before it has been determined to have been exposed according to the laser path planning drawing. The curing degree of the exposed element is represented by the weight coefficient.
The cured elements of the current layer are reconstructed as a global stiffness matrix. The boundary condition is then recombined and saved as a nodal displacement vector. Hence, the shrinkage and internal stress begins the calculation. The results are exported to the recorded file as a user request. If the next layer is checked and it is determined that it needs to be fabricated, the nodal position is updated and the constraint release problem is dealt with. The new liquid elements are added and reconstructed with the cure elements and then recorded into the memory core. The previous process is repeated until no more layers need to be fabricated.
Fig. 1 Element block with weight coefficient.
Key Engineering Materials Vols. 340-341 331
Fig. 2 Flowchart of developed simulation code
Digitizing system
For the purpose of evaluating the simulation result, the Advanced Topometric Sensor (ATOS) [9], based on the principle of optical triangulation and profits from the precision of light, is utilized to rebuild the blade surface of the fabricated prototype for comparing the inaccuracy with original designed CAD model. Owing to the standard process of ATOS system a white paint is sprayed onto the blade surface for enhancing the reflectivity prior to capturing the images. The thickness of sprayed paint becomes another error effect of the rebuilt surface. Therefore, the lower level of thickness made the less error cause effect.
Case study
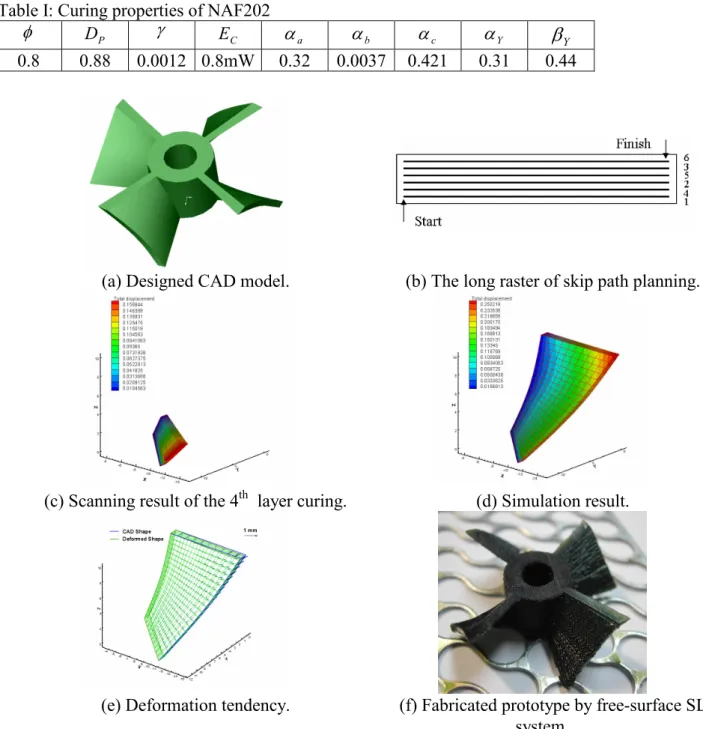
The proposed prototype is a four-fin fan as shown in Figure 3(a). Each fin is fixed to the hollow cylinder which is assumed to be a rigid body and only one fin needs to be analyzed in order to reduce simulation time. The nodes, which connect with the cylinder surface, are fixed as a boundary condition. In accordance with the principle of the free-surface SL system, the nodes of bottom surface of first layer will be constrained with the platform during the curing reaction [1] as the initial condition. The photopolymer is NAF202 commercialized by the Autostrade Co. [10]. The curing properties were studied and listed in table I [9]. The laser spot size is controlled as 0.8 mm and the effective penetration depth is about 0.88 mm when the scanning speed is set at 8mm/s. Each layer thickness is 0.5 mm and the resting time, where the platform descends for the feeding resin of the next layer, is 4 sec.
The scanning path can be classified into long raster, short raster and contour scanning. Skip method is applied for eliminating shrinkage occurred. Hence, the skip long raster is utilized and shown as in
Engineering Plasticity and Its Applications 332
Figure 3 (b). An eight node cubic element is used in this analysis. Figure 3 (c) and (d) show the curing process of the 4th layer and the final simulation result. The total displacement is defined as dx2 +dy2 +dz2 . It can be clearly seen that the distance between the node’s positions to the hollow cylinder surface increases as the total displacement increases. The simulation result is expressed by the total displacement vector as shown in Figure 3(e). The maximum total displacement occurs at the outer corner of the upper surface. Figure 3(f) shows the fabricated prototype result.
A fin surface of the fabricated prototype was rebuilt by ATOS system in order to verify the deformation tendency of the simulation result as shown in Figure 4(a). In Figure 4(b), shift the baseline of the rebuilt fin surface to the same as CAD model in order to reveal the deformation tendency. Consequently, the simulation result closely conforms to the fabricated prototype.
Table I: Curing properties of NAF202
φ DP γ
E C αa αb αc αY βY
0.8 0.88 0.0012 0.8mW 0.32 0.0037 0.421 0.31 0.44
(a) Designed CAD model. (b) The long raster of skip path planning.
(c) Scanning result of the 4th layer curing. (d) Simulation result.
(e) Deformation tendency. (f) Fabricated prototype by free-surface SL system.
Fig. 3 Simulation process and built prototype.
Key Engineering Materials Vols. 340-341 333
(a) Rebuild surface. (b) Comparison with CAD model.
Fig. 4 Deformation tendency verification.
Summary
A general simulation code was developed for analyzing the shrinkage effect in accordance with path planning. The element block with weight coefficient was utilized for discreting scanning path into increments. A fin of the proposed fan model was simulated and fabricated for validating deformation tendency. The surface of fabricated fin is reconstructed by the digitizing system. As a result, the simulation prediction closely conforms to the experimental result.
Acknowledgements
The authors acknowledge the support from National Science Council of the Republic of China under grant No: NSC92-2212-E011-001.
References
[1] P. F. Jacobs: Rapid Prototyping and Manufacturing-Fundamentals of Stereolithography (Society of Manufacturing Engineers, Dearborn, MI. 1992)
[2] P. T. Wissman, R. P. Chartoff, S. J.Rodrigues and S. M. Linden: 4th International Conf. on Rapid Prototyping (1993) p. 263
[3] G. Bugeda, M. Cervera, G. Lombera and E. Onate: Rapid Prototyping Journal Vol. 1 No. 2, (1995) p. 13
[4] B. Wiedemann, K. H. Dusel and J. Eschl: Journal Rapid Prototyping Vol. 1 No. 3, (1995) p. 17 [5] H. Narahara, F. Tanaka , T. Kishinami, S. Igarashi and K. Saito: Rapid Prototyping Journal Vol. 5
No. 3, (1999), p. 120
[6] F. Tanaka, M. Morooka, T. Kishinami, and H. Narahara: 8th International Conf. on rapid prototyping (2000), p. 87
[7] Y.M. Huang and C.P. Jiang: International Journal of Adv. Manufacturing Tech. Vol. 21(2003), p.
586
[8] Y.M. Huang, S. Kuriyama and C. P. Jiang: International Journal of Adv. Manufacturing Tech.
Vol. 21 (2004) p.361.
[9] C.P. Jiang, Y.M. Huang and C.H. Liu: Accepted by Rapid Prototype Journal (2006) [10] Information on http://www.autostrade.co.jp
Engineering Plasticity and Its Applications 334