Chapter 4
Results and Discussion
What follows is the results and discussion of the formal study. First of all, the study result is displayed. In the result section, participants’ scores of the TOEFL listening test is proposed first, which is immediately followed by the grades given by the two raters and their correlation. Next, the major result concerning the respective relationship of test procedures with proficiency levels and that with question types is revealed. Afterward, participants’ self-reflection to the questionnaire is exhibited. A more in-depth discussion is the second major section elaborated from the study results.
In this section, the implication and explanation of the TOEFL listening test, two raters’ grades, and the test procedures’ separate relationship with proficiency levels and question types, and the questionnaire are more deeply approached. The final section gives a summary of Chapter 4.
Results
The results of the statistical analysis are provided in the following parts.
Participants’ scores of TOEFL Listening Test
According to the test result, participants who got the scores above 56 (see Note 3) were deemed as high level. The score range of intermediate level was from 55 to 50.
Participants who scored lower than 50 were considered as low level. This gauge was
based on the principle of equal numbers, which assigned roughly equivalent number
of participants to each level. Since there were 216 participants attending this TOEFL
were 56) and the second 1/3 ranged from 72 to 144 (the corresponding scores were 50). The scores for the last 1/3 of participants started from 49. After three levels were divided, group mean of each level was then calculated. The average scores of high level were 59.71, whereas intermediate level was 52.21 and low level was 45.42. The difference of scores between high and intermediate level (Mean difference= 7.5) and that between intermediate and low level (Mean difference= 6.79) was close, indicating that this grouping was adequate. Table 8 presents the TOEFL listening test result.
Table 8. TOEFL Scores of the Participants and Group Mean of Each Level Scores Number of Participants Accumulation Group Mean
68 2 2
66 4 6
64 3 9
63 4 13
62 9 22
61 3 25
60 5 30
59 11 41
58 5 46
57 15 61
56 10 71
59.71 (Number of Participants: 71)
55 6 6 6 6 77
54 9 86
53 20 106
52 7 113
51 21 134
50 10 144
52.21 (Number of Participants: 73)
49 10 154
48 19 173
47 4 177
46 9 186
45 4 190
44 11 201
43 4 205
42 3 208
41 1 209
40 3 212
Under
40 4 216
45.42 (Number of Participants: 72)
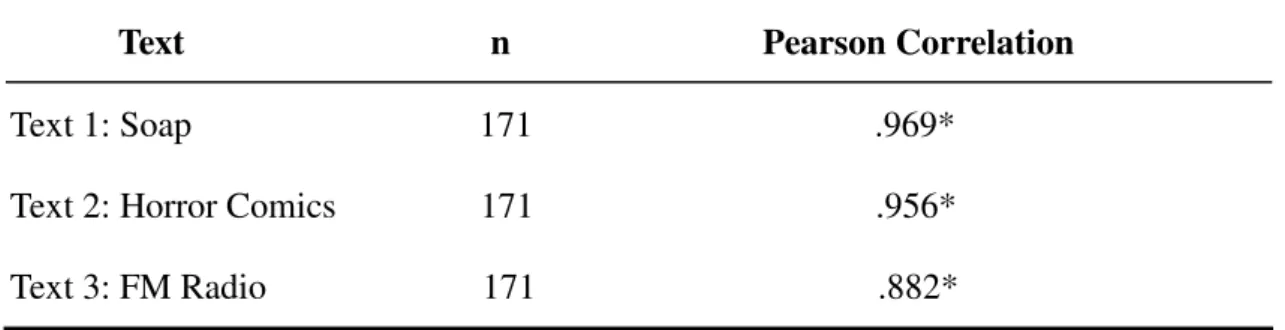
Participants’ Scores Given by Two Raters in the Listening Comprehension Test Since two raters were involved in the current study, it would be very important to see whether their grades were significantly correlated. Table 9 first presents participants’ mean scores of listening comprehension test given by the two raters.
Table 9. Mean Scores of the Listening Comprehension Test by Texts Text
Scores
Text 1:
Soap
Text 2:
Horror Comics
Text 3:
FM Radio
Total
rater 1 8.68 9.94 7.05 8.54
rater 2 8.64 9.91 6.95 8.5
Mean 8.66 9.925 7 8.53
Note. Range: 0~15 (Each question has 5 points. And each text has three questions, so each text has 15 points in total.)
On the whole, participants performed best in text 2 with the mean scores of 9.925,
followed by text 1 with grades of 8.66 and text 3 with the mean of 7. Also, it was
obvious to detect that rater 1 gave higher scores than rater 2 in all of the texts. In this
case, further analysis was thus required to examine whether the scores given by the
two raters were significantly correlated. Pearson Correlation was adopted to
two raters reached the significant degree in all the texts. Therefore, it could generate a conclusion that the inter-rater reliability was ascertained in the present study.
Table 10. Inter-Rater Reliability with the Three Texts
Text n Pearson Correlation Text 1: Soap 171 .969*
Text 2: Horror Comics 171 .956*
Text 3: FM Radio 171 .882*
The Interaction of Test Procedures and Proficiency Levels
As mentioned in the chapter three, the present study adopted linear mixed-effects model
4and ANOVA to analyze the data. In this model, the total score was regarded as response, whereas texts, proficiency levels, procedures served as fixed effects. And each participant (id) was considered as a random effect. The present study was interested in probing into the interaction between proficiency levels and test procedures. Hence, the applied model looks like the following.
total score = id + text + procedure + level + procedure*level + error
( )
( Y
i j k= µ + α
i+ β
j+ γ
k+ β γ
j k+ ε
i j k, , i j k , = 1 , 2 , 3 )
4. In the present study, linear mixed-effects model rather than general linear model was used
mainly because participants are different individuals who cannot be regarded as another fixed
effect. Individual differences are a variable difficult to predict and control. Thereby, they
should be considered as a random effect. In the experimental design where some effects are
fixed and one effect is random, it is deemed that linear mixed-effects model would be
appropriate (Ott, 1993).
After being analyzed by ANOVA, Table 11 indicates that each single variable reached the acceptable degree of significance, but this significance did not occur in the interaction of procedures and proficiency levels. According to the figures shown in the p-value (0.8106), proficiency levels and procedures were not significantly related. That’s to say, the performances of the three proficiency levels were not distinctively differed with the different procedures.
Table 11. The Fixed Effect of Interaction between Proficiency Levels and Test Procedures
Source of Variation
DF of Numerator
DF of Denominator
F-value p-value
Procedure 2 334 23.978 .0000
Level 2 168 67.922 .0000
Procedure*Level 4 334 .397 .8106
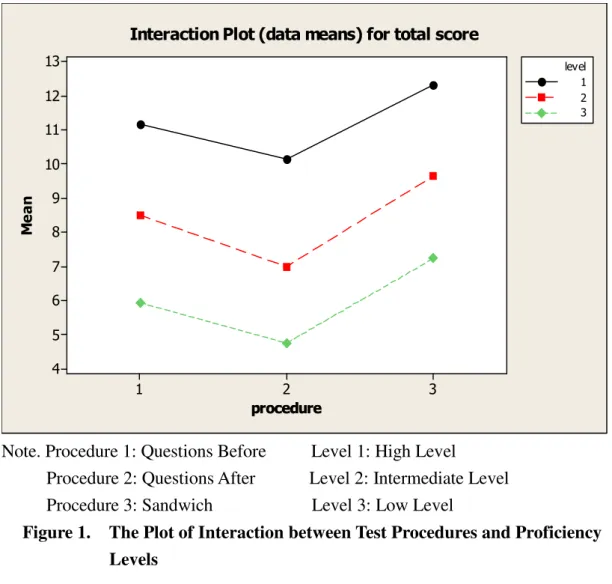
Now the relationship of procedures and proficiency levels is converted to Figure
1, and it evidently shows that each level manifested a similar pattern, with highest
point on Sandwich and lowest point on Questions After. The curve of each level
almost paralleled one another, showing no occurrence of interaction. Although in the
intermediate level the difference between Questions Before and Questions After was
slightly higher than the other two levels, it did not exhibit an interaction between
procedures and levels. Originally, it was estimated that high level participants would
be relatively less affected by procedures than low level ones. Yet, the parallel patterns
demonstrated that participants of each level performed best in Sandwich and worst in
Questions After, implying procedures exerted an approximate influence on three
levels in the current study.
procedure procedure
M e a n
3 2
1 13
12 11 10 9 8 7 6 5 4
level
3 1 2
Interaction Plot (data means) for total score
Note. Procedure 1: Questions Before Level 1: High Level
Procedure 2: Questions After Level 2: Intermediate Level Procedure 3: Sandwich Level 3: Low Level
Figure 1. The Plot of Interaction between Test Procedures and Proficiency Levels
Since the significance did not occur in the interaction of procedures and proficiency levels, this fixed effect was dropped. As for the rest of the fixed effects, they were preserved. Likewise, the same linear mix-effects model was employed.
total score = id + text + procedure + level + error 3 , 2 , 1 ,
,
, =
+ +
+ +
= i j k
Y
ijkµ α
iβ
jγ
kε
ijkExamined by ANOVA, all the fixed effects attained to the significant level as
shown in Table 12. It also proved this model was suitable so that the following
analysis was implemented under this model.
Table 12. The Fixed Effects of Procedures and Proficiency Levels Source of
Variation
DF of Numerator
DF of Denominator
F-value p-value
Procedure 2 338 23.812 .0000
Level 2 168 34.942 .0000
Table 12 signifies that procedures reached the significant level on influencing participants’ total scores (p= .0000). With a view to further investigating whether significant differences occurred in the three procedures, two-sample t-test was utilized.
According to Table 13, differences among the three procedures all achieved the degree of significance. No matter in Questions Before vs. Questions After, Questions Before vs. Sandwich, or Questions After vs. Sandwich, their disparities were distinctively diverse. In comparison with the three groups, it was found that the discrepancy between Questions After and Sandwich was the biggest (p= .000).
Table 13. The Two-Sample t-test of Differences in Three Procedures (for Total Scores)
Contrast (in group) Mean Difference Std. Error t-test p-value Question Before —Question After 1.182 .345 3.426 .001
Question Before —Sandwich -1.203 .345 -3.487 .001
Question After—Sandwich -2.384 .346 -6.890 .000
Figure 2 displays the total scores of the three procedures. It could be found that
the general scores of Questions Before were 8.52, Questions After were 7.3, and
Sandwich were 9.7. In other words, Sandwich was the best-performing procedure and
Questions Before came the second and Questions After was the third. And the
differences among them had also been proven statistically significant.
procedure
M e a n o f to ta l s c o re
3 2
1 10.0
9.5
9.0
8.5
8.0
7.5
7.0
Main Effects Plot (data means) for total score
Note. Procedure 1: Questions Before Procedure 2: Questions After Procedure 3: Sandwich
Figure 2. The Plot of Total Scores of the Test Procedures
Based on Table 12, the variable of proficiency levels also achieved the degree of significance (p= .0000). In order to further detect whether the significance of the differences existed in three levels, two-sample t-test was adopted to analyze as well.
As Table 14 shows, the differences among three levels were significant (p= .000).
This result indirectly demonstrated the level grouping of participants based on their
TOEFL scores was valid. Each level’s performance was thereby evidenced to be
considerably dissimilar from one another.
Table 14. The Two-Sample t-test of the Proficiency Levels
Contrast (in group) Mean Difference Std. Error t-test p-value
High —Intermediate 2.820 .469 6.013 .000
High —Low 5.233 .449 11.655 .000
Intermediate—Low 2.413 .469 5.145 .000
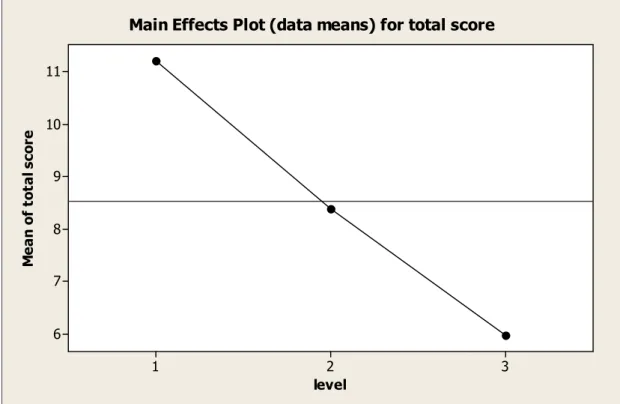
When the figures are converted to the plot as in Figure 3, it was apparent that the high level participants outperformed the intermediate level ones and also surpassed the low level ones. Although the differences among three levels appeared roughly the same, the difference between high level and intermediate level was moderately higher than that between intermediate level and low level.
level
M e a n o f to ta l s c o re
3 2
1 11
10
9
8
7
6
Main Effects Plot (data means) for total score
Note. Level1: High level
Level 2: Intermediate level Level 3: Low level
Figure 3. The Plot of Total Scores of the Proficiency Levels
Listening Comprehension Test: The Interaction of Procedures and Question Types In order to investigate the relationship of test procedures and question types, the linear mixed-effects model and ANOVA were employed in the same manner. In this section, the scores represented response and each participant (id) stood for random effect. The fixed effects included variables of texts, procedures, and question types.
Now, it was interested in examining the interaction between procedures and question types. Thus, the adopted model should be like the following.
total score = id + text + procedure + level + question + procedure*question + error Y
ijkl= µ + α
i+ β
j+ γ
k+ δ
l+ ( βδ )jl + ε
ijkl , i , j , k , l = 1 , 2 , 3
Based on ANOVA, the result indicates that the interaction of test procedures and
question types was not significant (p= .406 in Table 15), which means that the scores
of different question types were not significantly affected by procedures. The effect of
global questions, local questions, and inferential questions did not significantly differ
with different procedures. Figure 4 further reveals that all of the question types
yielded highest grades in Sandwich, followed by Questions Before, and Questions
After was the last. From the graph, it was also found that the grades of global
questions took the lead, which surpassed the local questions and also outperformed
the inferential questions. It seems to signify that global questions were easiest to score
whereas the inferential appeared to be formidable for the participants. In addition,
global questions clearly showed higher grades in both of Questions Before and
Sandwich procedures, implying that the scores of global questions were better
heightened when being manipulated with these two procedures. Although the grades
of global questions were still best in Questions After, its difference from the other two
question types was not as high as in Questions Before and Sandwich. Another point to
notice was that the scores of inferential questions and local questions were generally the same in Sandwich procedure, which signified that the performance of inferential type could be as good as that of local type with the assistance of Sandwich.
Table 15. The Fixed Effect of Interaction of Test Procedures and Question Types
Source of Variation DF of Numerator
DF of Denominator
F-value p-value
Procedure 2 1358 19.570 .000
Level 2 168 67.922 .000
Question 2 1358 12.275 .000
Procedure* Question 4 1358 1.002 .406
procedure procedure
Mean
3 2
1 3.8
3.6 3.4 3.2 3.0 2.8 2.6 2.4 2.2
ty p e
3 1 2
Interaction Plot (data means) for score
Note: Procedure 1: Questions Before Type1: Global Questions Procedure 2: Questions After Type 2: Local Questions Procedure 3: Sandwich Type 3: Inferential Questions
Figure 4. . . . The Plot of the Interaction between Procedures and Question Types
Since the interaction of test procedures and question types did not yield the significant outcome, the model was rearranged. In this new model, the variable of procedures*question types was eliminated. The model was adjusted as follows:
total score = id + test + procedure + level + type + error 3 , 2 , 1 , , ,
, =
+ + +
+ +
= i j k l
Y
ijklµ α
iβ
jγ
kδ
lε
ijklLikewise, the new model was tested by ANOVA analysis (See Table 16), and the result reveals that all the variables were proven significant (p= .000). Hence, this new model was demonstrated to be correct so that the rest of the analysis was processed under it.
Table 16. The Fixed Effects of Procedures and Question Types Source of
Variation
DF of Numerator
DF of Denominator
F-value p-value
Procedure 2 1362 19.570 .000
Level 2 168 67.922 .000
Question 2 1362 12.275 .000
Due to the significance of procedure shown in Table 16, further analysis was
needed to investigate whether the differences of mean scores in three procedures were
significant. Two-sample t-test was utilized to measure the differences between any
two of the three groups. Table 17 shows that the significant differences existed in all
the two pairs. This result thus verified the significance occurred not only in the total
scores of the procedures but also in their mean.
Table 17. The Two-Sample t-test of Differences in Three Procedures (for Mean Scores)
Contrast (in group) Mean Difference Std. Error t-test p-value
Question Before —Question After .394 .127 3.102 .002
Question Before —Sandwich -.401 .127 -3.158 .002
Question After—Sandwich -.795 .127 -6.260 .000
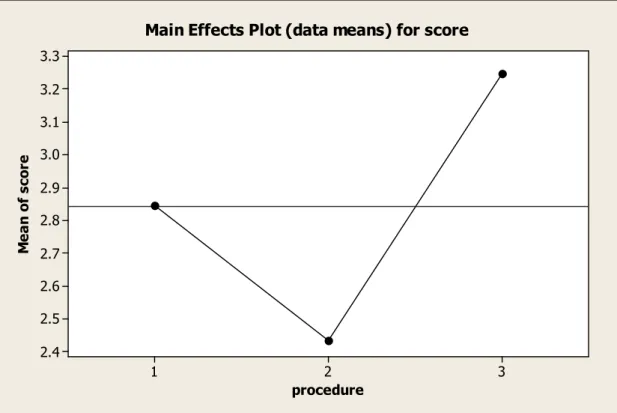
Figure 5 presents the scores of the procedures, with Sandwich scoring highest and Questions Before the second and Questions After the third. This plot resembled Figure 2 except the fact that this one was for mean scores and Figure 2 represented the total scores.
procedure
M e a n o f s c o re
3 2
1 3.3
3.2 3.1 3.0 2.9 2.8 2.7 2.6 2.5 2.4
Main Effects Plot (data means) for score
Note: Procedure 1: Questions Before Procedure 2: Questions After Procedure 3: Sandwich
Figure 5. The Plot of Mean Scores of the Test Procedures
The fixed effect of question types was also significant in Table 16, thus two-sample t-test was required again to detect whether the differences lying between any two of the three question types were significant. Table 18 indicates that significant differences occurred to global question vs. local question and global question vs. inferential question. Both of their p-value were .000. Nevertheless, the difference between local question and inferential question did not attain to the significant degree.
Table 18. The Two-Sample t-test of Differences in Question Types
Contrast (in group) Mean
Difference Std. Error t-test p-value
global question—local question .472 .127 3.717 .000
global question— inferential question .596 .127 4.693 .000 local question —inferential question .125 .127 0.984 .326
Figure 6 further reveals the mean scores of each question type, with the highest scores on global questions (M= 3.2) and lowest scores on inferential questions (M=
2.6). It seems to imply that participants usually excelled at global question without difficulty in comprehending the main gist of the text and the macro-relationship of the subtopics. But local questions and inferential questions remained a challenge for them, especially the inferential ones. Nevertheless, the low scores of local questions (M=
2.73) could actually be attributed to the rating criteria. In effect, local questions
tended to ask participants about the time, the name, and the location. The answer was
either right or wrong. Unlike the other two question types which could grant some
points to participants who did not answer completely correct, the local questions did
not have points in-between. So it would be a great cost for participants who just lost a
little accuracy in local questions. However, this was not the case for inferential
questions. Thus, inferential questions appeared to be really demanding for these participants.
type
M e a n o f s c o re
3 2
1 3.2
3.1
3.0
2.9
2.8
2.7
2.6
Main Effects Plot (data means) for score
Note: Type 1: Global Questions Type 2: Local Questions Type 3: Inferential Questions
Figure 6. The Plot of Mean Scores of the Question Types
Participants’ Responses to the Questionnaire
In the questionnaire administered after the listening comprehension tests, six
questions were given to the participants. They were told to tick one procedure in
response to each question. Besides the three procedures mentioned in the present
study, another choice was “none” meaning no particular procedure suitable. In the
following table, the number of participants in each item and its percentage are
Table 19. Participants’ Responses to General Questions about Test Procedures
Item 1 was concerned with participants’ habits in their daily listening training.
Around 39% of them reported Questions Before was the procedure they tended to use for training, which was followed by Questions After (26.9%) and Sandwich (20.46%).
It clearly revealed that Questions Before was relatively more common in daily training, while Sandwich was least used compared with the other two approaches. But a noteworthy condition was that 13.45% of participants revealed they did not utilize any of procedures to facilitate their listening ability or they did not even have any 1. Which procedure did you usually use in the daily life listening activities?
QB QA S N 67 46 35 23 39.18% 26.90% 20.46% 13.45%
2. Which procedure made you particularly tense?
QB QA S N 23 110 17 21 13.45% 64.32% 9.94% 12.28%
3. Which procedure distracted you most while listening?
QB QA S N 47 72 32 20 27.48% 42.10% 18.71% 11.69%
4. Which procedure made the test particularly difficult?
QB QA S N 12 128 13 18 7.01% 74.85% 7.60% 10.52%
5. Which procedure enhanced your listening comprehension most while listening?
QB QA S N 53 34 81 3 30.99% 19.88% 47.36% 1.75%
6. Which procedure did you like best?
QB QA S N
46 10 113 2
26.90% 5.84% 66.08% 1.16%
listening training after class.
The second question in the questionnaire was to detect the effect of anxiety the procedures imposed. Among the three procedures, Questions After was overwhelmingly agreed to make participants most nervous, with the percentage up to 64.32%. It was speculated that participants might feel less secured when doing Questions After, especially if they had Questions Before or Sandwich first. The second anxiety-producing procedure was Questions Before but its percentage was much lower (13.45%). This was against the expectation since Questions Before which granted participants to preview the questions at first was supposed to be most security-assuring procedure. But some of participants privately told the researcher that they thought Questions Before was anxiety-provoking when they found they were unable to find the answers to the questions out of listening. In comparison with Questions After and Questions Before, only 9.94% of participants agreed Sandwich to make them tense most.
The next question laid emphasis on the distraction the procedures probably brought about. Surprisingly, about 42.10% of participants felt Questions After distracted them most while listening. Questions Before (27.48%) was the next and Sandwich was the third (18.71%). This result was fairly confounding since Questions Before or Sandwich actually stood a greater chance to interrupt the listeners during the listening. Questions After which required the participants to engage in the two hearings first and then finished the questions was a most natural procedure in essence.
Thus, the researcher suspected that some of the participants might misconstrue the
meaning of the distraction as difficulty. As a result, numerous of them chose
Questions After as a most distracting procedure.
behind was the option of “None” 10.52%. Sandwich (7.01%) was the next.
Immediately following Sandwich was Question Before with the least total like 7.01%.
The overwhelming high percentage of Questions After in difficulty could indirectly manifest that the participants probably misconceive the question about distraction as this one.
The next question was designed to elicit which procedures facilitate participants’
listening comprehension. The result exhibited that Sandwich which occupied 47.36%
came first, followed by Questions Before (30.99%). Surprisingly, about 19.88% of participants recognized that Questions After fostered their listening comprehension most. Apparently, they were not accustomed to previewing questions prior to the hearings or in the middle of hearings, which was surmised to distract rather than help them to comprehend.
The last question aimed to probe into participants’ favor of procedures.
According to the result, Sandwich (66.08%) excessively outweighed the other two procedures. Questions Before which was only 26.90% came the second, while Questions After which further dropped to 5.84% came the third. It was conspicuous that participants preferred Sandwich to Questions Before. This could be attributed to the fact that most of the participants in the present study were English majors who had better proficiency and greater confidence. This drove them not to mentally rely on previewing questions for the sense of security. They could comfortably listen to the text first and then previewed and had the second hearing. Thereby, a majority of them chose Sandwich as most preferable procedure.
The following Figure 7 presents the participants’ overall responses to the six
categories mentioned above. It aims to approach feedbacks on the questionnaire from
a more holistic perspective.
1. Habit 2. Anxiety
3. Distraction 4. Difficulty
5. Enhancement 6. Preference
Figure 7. The Results of Questionnaire in Six Categories (%)
0 00 0 2 0 2 0 2 0 2 0 4 0 4 0 4 0 4 0 6 06 0 6 06 0 8 08 0 8 08 0 1 0 0 1 0 0 1 0 0 1 0 0
Q B Q B Q B
Q B Q AQ AQ AQ A SSSS NNNN 000
0 20 20 20 20 40 40 40 40 60 60 60 60 8080 8080 100 100 100 100
QB QB QB
QB QAQAQAQA SSSS NNNN
000 0 2 0 2 0 2 0 2 0 4 04 0 4 04 0 6 06 0 6 06 0 8 0 8 0 8 0 8 0 1 0 0 1 0 01 0 0 1 0 0
Q B Q BQ B
Q B Q AQ AQ AQ A SSSS NNNN 000
0 2 0 2 0 2 0 2 0 4 0 4 0 4 0 4 0 6 06 0 6 06 0 8 0 8 0 8 0 8 0 1 0 0 1 0 01 0 0 1 0 0
Q B Q BQ B
Q B Q AQ AQ AQ A SSSS NNNN
0 00 0 20 20 20 20 40 40 40 40 60 60 60 60 8080 8080 100100100 100
QB QBQB
QB QAQAQAQA SSSS NNNN 0
00 0 2 0 2 0 2 0 2 0 4 0 4 0 4 0 4 0 6 0 6 0 6 0 6 0 8 08 0 8 08 0 1 0 0 1 0 01 0 0 1 0 0
Q B Q BQ B
Q B Q AQ AQ AQ A SSSS NNNN