國立臺灣大學工學院環境工程學研究所 碩士論文
Department of Graduate Institute of Environmental Engineering College of Engineering
National Taiwan University Master Thesis
以活性碳/黏土薄層覆蓋法整治含汞底泥之縮模研究
Using Activated Carbon/Clay-Based Thin Layer Capping for Mercury-Contaminated Sediment Remediation: Microcosms
Study
丁 昱 Yu Ting
指導教授:席行正 博士 Advisor: Hsing-Cheng Hsi, Ph.D.
中華民國 108 年 7 月
July 2019
I
Acknowledgements
I would like to thank my advisor, Dr. Hsing-Cheng Hsi (席行正), for his guidance, for having confidence in me, and for putting up with my stubbornness. I am also grateful to Dr. Chu-Ching Lin (林居慶), Dr. Chih-Hao Fan (范致豪), and Dr. Zeng-Yei Hseu (許正一) for their precious advises on my master thesis and for their assistance in instrumental analysis.
I would like to thank my team members, Chi Chen(陳祺), Boon-Lek Ch-ng (莊文 歷) and Kenya Ou (歐夢圓), for working by my side all along and I really enjoy your
company. I would also like to thanks my peers for accompany me during my time in NTU (name in Chinese): 許哲榮、王映琳、徐子琇、施東甫、陳明茵、李孟竺、陳 韻心、陳昱廷、陳秉圻、林聰鎮、李昇憲、潘冠璇、陳煜偈、周宥丞、廖華永、
蕭燕澤、戴瑋, etc.
I would like address my deepest gratitude to my dad and mom for being so supportive when I faced challenges and so inspiring to me when I was confused.
中文摘要
近年來,現地薄層覆蓋法技術之突破為整治汞汙染底泥帶來新的可能性,也提 供除疏濬法以外新的整治策略。本研究分為兩部分,利用數種活性碳/黏土基之薄 層覆蓋層在微型系統中評估整治汞底泥之可能性。在本研究第一部分中,自製之含
硫活性碳(SAC)在等溫吸附實驗中發現對於二價汞及甲基汞之吸附親和性(KD值分
別為 9.42×10⁴ 及 7.66×10⁵)比起其原始活性碳 (AC)有顯著提升 (KD 值分別為
3.69×10⁴及 2.25×10⁵)。但在底泥競爭吸附實驗中,AC 對比 SAC 對於汞底泥(14.2‒
235.8 mg-Hg/kg)中具有較佳之汞溶出抑制能力,並在 3%添加量下具有最佳之汞溶
出抑制效率(99.88%)。其原理可能為 SAC 在吸附實驗平衡後形成穩定的 HgS (s)奈
米顆粒,使底泥競爭吸附實驗之 AC 抑制汞溶出之能力優於 SAC。另外,研究之 各式覆蓋層(SAC+皂白土、SAC+低汞底泥、AC+皂白土)在上流式微型系統中對於 總汞及甲基汞均具有良好溶出抑制能力。在本研究第二部分為探討底泥擾動事件 對於覆蓋穩定之影響,開發一具有自製震盪系統之橫向流微型系統。三種不同黏土 材料之活性碳/黏土基覆蓋層施加於實場汞底泥中(76.0±2.59 mg-Hg/kg),發現 AC(3%)+皂白土(3%)以及 AC(3%)+高嶺土(3%)在模擬橫向流及表層底泥擾動之條
件下,對於實場底泥中總汞及甲基汞皆能達到約 75‒95%及 64‒98%之溶出抑制效
果達 75 天之久(實驗全時程)。而 AC(3%)+蒙脫土(3%)的薄層覆蓋層由於蒙脫土在 水中沉降性及穩定性較差,使總汞及甲基汞溶出抑制效率不佳。本研究發現穩定性 高之薄層覆蓋層有較佳之汞溶出抑制能力,並於間歇性底泥擾動下有較佳之抵抗 能力;而穩定性較差之薄層覆蓋層可能造成甲基汞大量溶出。
關鍵字: 汞、甲基汞、底泥整治、薄層覆蓋法
Abstract
The breakthrough of in-situ thin layer capping technology in recent years has shed light on the remediation of Hg-contaminated sediment and provides a promising alternative besides traditional dredging. In this thesis, the plausibility of several activated carbon (AC)/clay-based thin layer caps were demonstrated in two microcosm studies. In the first study, a lab-synthesized sulfurized activated carbon (SAC) performed greater sorption affinity to both aqueous Hg2+ (KD=9.42× 10⁴) and MeHg (KD=7.66× 10⁵) compared to those for raw activated carbon (KD=3.69×10⁴ and 2.25×10⁵, respectively) in isotherm adsorption tests. However, AC appeared to have greater sequestration ability than SAC in Hg-spiked sediment (14.2‒235.8 mg-Hg/kg), with the optimistic dosage of 3wt% AC causing reduction of THg with 99.88%. It may suggests that possibly formed nano-HgS particles could be released thus elevates the porewater Hg when SAC existed.
Also, a 83-d trail of up-flow microcosms was demonstrated with various caps (SAC + bentonite, SAC + clean sediment, and AC + bentonite) and all observed significant inhibition of both THg and MeHg. In the second study, a horizontal-flow microcosm with lab-made vibration system was designed to evaluate the capping efficiency during turbation events. AC/clay-based caps with clay combinations were applied to actual Hg- contaminated estuary sediment (76.0±2.59 mg-Hg/kg). The caps with AC + bentonite and AC + kaolin were efficient in reducing both total mercury (THg) and methylmercury (MeHg) concentrations in overlying water by 75−95% and 64−98%, respectively in the later stage of 75-d operation. In contrast, the AC (3%) + montmorillonite (3%) cap did not show a significant reduction on THg and MeHg in overlying water, probably due to the unstable, suspension property of montmorillonite. The stable caps showed higher resistance to Hg breakthrough under occasional turbation events; however, a labile cap
appeared to have dramatic Hg breakthrough when turbation occurred. It is therefore essential to note that with unstable caps, turbation events may result in unwanted secondary resuspension of contaminants.
Keywords: mercury, methylmercury, sediment remediation, thin layer capping
Contents
Acknowledgement ...I 中文摘要 ... II Abstract ... III Contents ... V List of Figures ... VII List of Tables ... XI
Chapter 1 Introduction ... 1
Chapter 2 Hg Management and Thin Layer Capping ... 3
2.1 Mercury Risk and Global Management Efforts ... 3
2.2 In-situ Approach and Thin Layer Capping ... 5
2.3 Capping Materials ... 7
2.4 Real Site Practice ... 10
2.5 Estimation of Remediation Cost ... 13
2.6 Challenges and Opportunities ... 15
Chapter 3 Capping of Mercury Sediment with SAC ... 18
3.1 Introduction ... 18
3.2 Materials and Methods ... 20
3.2.1 Materials ... 20
3.2.2 Physical and Chemical Analysis of Materials ... 20
3.2.3 Aqueous Adsorption Experiment ... 21
3.2.4 Sediment Competition Adsorption Experiment ... 22
3.2.5 Microcosm Experiment ... 22
3.2.6 Mercury and Methylmercury Analysis ... 24
3.3 Results and Discussion ... 25
3.3.2 Aqueous Adsorption Experiment ... 28
3.3.3 Sediment Competition Adsorption Experiment ... 34
3.3.4 Microcosm Experiment ... 38
3.4 Summaries ... 40
3.5 Supporting Information ... 42
Chapter 4 AC/clay-based Caps Reduce Mercury Escape under Horizontal Flows
and Sediment Turbation ... 49
4.1 Introduction ... 49
4.2 Materials and Methods ... 50
4.2.1 Sorbents Preparation, Sediment Collection, and Characterization .... 50
4.2.2 Artificial Vibration System ... 51
4.2.3 Microcosms Setup and Operation ... 52
4.2.4 Sample Collection and Analysis ... 53
4.3 Results and Discussion ... 54
4.3.2 Sulfide, Sulfate, Chloride, and Total Fe in Overlying Water ... 56
4.3.3 Reduction of Aqueous THg and MeHg by Thin Layer Cap ... 59
4.3.4 ORP, THg, and MeHg in Sediment ... 63
4.3.5 The Stability of Thin Layer Caps during Turbation ... 67
4.4 Summaries ... 67
4.5 Supporting Information ... 69
Chapter 5 Conclusions and Suggestions ... 89
References ... 91
List of Figures
Figure 2-1. Cho et al. [8] performed mechanical mixing amendment with (a) a rotary cultivator (Aquatic Environments, Inc.,) and (b) an injection system (Compass Environmental, Inc., GA). …..……….………11 Figure 2-2. Menzie et al. [63] performed a spray thin layer capping using self-made equipment (Vortex TR Aquatic system). …………..………...12 Figure 2-3. Cornelissen et al.[87] premixed AC, clay and seawater and preformed a spray thin layer capping by a spraying system on a ship. ……..……….13 Figure 2-4. Menzie et al. [63] compared several remedies with a case study in Canal Creek, Maryland. ..………..14 Figure 3-1. (a) photo image; (b) scheme diagram of vertical up-flow microcosms construction. Vertical flows were delivered from the bottom of the columns. The depth of sediment (TY03) is approximately 15 cm. From column A to D: (A) no caps; (B) SAC + bentonite; (C) SAC + additional TY03 sediment; (D) AC + bentonite. ………..23 Figure 3-2. Micropores size distribution of raw AC and SAC based on QSDFT model. .27 Figure 3-3. Deconvoluted S2p peak for AC and SAC. ………...…….28 Figure 3-4. Hg2+ adsorption by AC and SAC as a function of time. For here [Hg2+] = 1 mg/L, Hg solution = 50 mL, adsorbent dosage = 50 mg, and pH = 7.0±0.1. ………….30 Figure 3-5. Adsorption isotherm of AC and SAC adsorbing (a) Hg2+ and (b) MeHg.
Adsorption time = 24 h. Hg solution = 50 mL, adsorbent dosage = 50 mg, pH = 7.0±0.1.33 Figure 3-6. Hg concentrations in porewater versus in sediment at (a) 1 wt%; (b) 3 wt%;
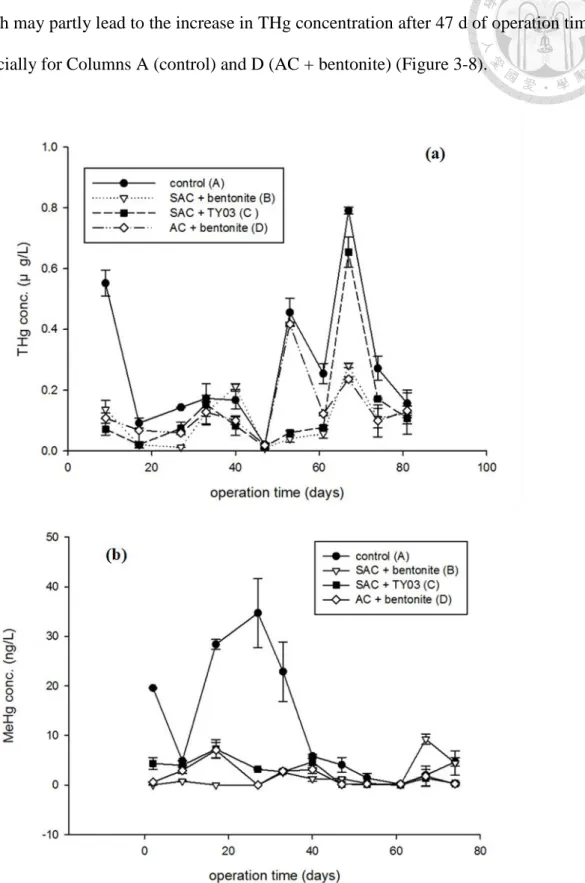
(c) 6 wt% adsorbent addition based on sediment competition adsorption test. DI water is 50 mL and Hg sediment is 5.0 g. ………...…...36 Figure 3-7. Proposed adsorption/desorption mechanisms of Hg adsorption on SAC in the
sediment environment. ………37 Figure 3-8. Overlying water (a) THg and (b) MeHg concentrations of vertical up-flow microcosms during operation. ……….39 Figure S3-1. SEM images of raw AC and AC after sulfurization (i.e., SAC) under x1500 magnification. ……….43 Figure S3-2. Follow-up aqueous adsorption tests of AC and SAC to justify the discussion in Section 3.3. The adsorption condition is as the same as the aqueous adsorption tests described in Section 2.3. [Hg]0= 1 mg/L, Temperature = 30°C, 125 rpm, n = 3.
Adsorption time was extended to 48 h and 72 h. Aqueous samples obtained with different pore-sized filtration are compared. SAC: sulfurized activated carbon; AC: raw activated carbon; “nof”: no filtered treatment after adsorption test; “0.20”: 0.20 μm filtered treatment; “0.45”: 0.45 μm filtered treatment. ……….44 Figure S3-3. pH value variation of four vertical up-flow microcosms (A‒D) during the operation of 86 days. From column A to D: (A) no caps; (B) SAC + bentonite; (C) SAC + additional TY03 sediment; (D) AC + bentonite. ……….45 Figure S3-4. ORP variation of four vertical up-flow microcosms (A‒D) during the operation of 86 days. From column A to D: (A) no caps; (B) SAC + bentonite; (C) SAC + additional TY03 sediment; (D) AC + bentonite. ………...46 Figure S3-5. Temperature variation of four vertical up-flow microcosms (A‒D) during the operation of 86 days. From column A to D: (A) no caps; (B) SAC + bentonite; (C) SAC + additional TY03 sediment; (D) AC + bentonite. ……….……….47 Figure S3-6. Flow rate variation of four vertical up-flow microcosms (A‒D) during the operation of 86 days. From column A to D: (A) no caps; (B) SAC + bentonite; (C) SAC + additional TY03 sediment; (D) AC + bentonite. ……….48 Figure 4-1. (a) Sulfate, (b) chloride, and (c) total Fe concentration in the overlying water
of four cells of the microcosm. The gray bar between day 20 and 30 represents intermittent turbation test; the gray bar at day 54 represents the sediment sampling event. ………...57 Figure 4-2. (a) THg and (b) MeHg concentration in the overlying water of four cells of the microcosm. The gray bar between day 20 and 30 represents intermittent turbation test;
the gray bar at day 54 represents the sediment sampling event. ………...61 Figure 4-3. The ORP in sediment of the four cells of the microcosm. The ORP was measured within 1−3 cm depth. ………...64 Figure 4-4. THg and MeHg in the sediment (1−3 cm depth) of the four cells of the microcosm (n = 3). ……….66 Figure S4-1. The texture of ANS sediment. ………...……….76 Figure S4-2. Photo diagrams for commercial motors (RISUN PVN 1305D 3V) before (left) and after (right) coated with layers of Hg-free epoxy resin and plastic steels. …….77 Figure S4-3. Photo diagram (left) and circuit diagram (right) of the lab-made current controller. ………78 Figure S4-4. Photo diagram of the whole microcosm. The yellow stars represent the location of the motors; the blue arrow represents the sampling point for overlying water and the beneath sediment. ………79 Figure S4-5. Scheme diagram of the microcosm construction. ………...……80 Figure S4-6. Photo diagrams for the start-up of the microcosm, including the pressure test (up), sediment incubation (middle; day -98) and rectifier added (down; day -97). ....81 Figure S4-7. Top view of cell A (control), cell B (AC + bentonite), cell C (AC + kaolin) and cell D (AC + montmorillonite); the photographs were taken at day 70. ……....….82 Figure S4-8. (a) Temperature, (b) DO, (c) pH, and (d) EC of the overlying water in the microcosm. ………....…..83
Figure S4-9. Correlation of sulfate to (a) EC and (b) total Fe. An extreme data point of day 60 was removed from the plot. ………...84 Figure S4-10. (a) THg reduction and (b) MeHg reduction efficiency of thin layer caps in comparison to control. ……….85 Figure S4-11. Correlation of THg to (a) sulfate and (b) total Fe. Extreme data points of day 60 were removed. ………..86 Figure S4-12. Correlation of MeHg to (a) sulfate and (b) total Fe. Extreme data points of day 34 and day 60 were removed. ………87 Figure S4-13. Correlation of THg to MeHg. An extreme data point of day 60 was removed. ……….88
List of Tables
Table 2-1. Field application cases for thin layer capping remediation. (Partially adopted
from Patmont et al.[57]). ………...6
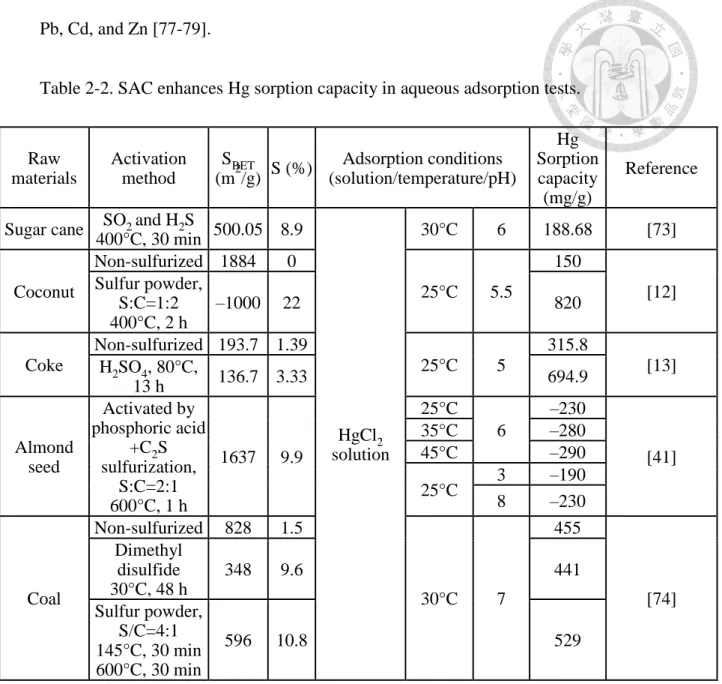
Table 2-2. SAC enhances Hg sorption capacity in aqueous adsorption tests. ………...….9
Table 3-1. Physical and chemical properties of precursor AC and resulting SAC. …….26
Table 3-2. Fitting parameters of AC and SAC adsorption by pseudo-first and second order reaction models. ………..30
Table S3-1. Characteristics of sediment TY03 sampled from a river in Northern Taiwan. ………....42
Table S4-1. Properties for ANS sediment. ………...69
Table S4-2. Properties for ANS surface water. ………....70
Table S4-3. Operation record for the microcosm. ………...…71
Table S4-4. Temperature, DO, pH, and EC of the overlying water in the microcosm…...73
Table S4-5. chloride, sulfide, sulfate and total Fe contents of the overlying water in the microcosm. ………..74
Table S4-6. THg and MeHg of the overlying water in the microcosm. ……….75
Chapter 1 Introduction
Mercury (Hg) has been recognized as one of the most toxic heavy metal due to its high volatility, persistence, and bioaccumulation to human beings or natural biota [1]. Hg, in general, exists in the form of divalent Hg (i.e., Hg2+) in the aqueous phase and may transforms to methylmercury (MeHg), which is one of the most toxic Hg forms via biomethylation under an anoxic sediment environment [2]. Although ex-situ strategies have been proven promising in removing Hg out of sediment [3, 4], problems such as unfeasible cost [5], resuspension of contaminants [6, 7], and production of contaminated sediment residues [6, 7] may discourage their application. Therefore, the development of novel and feasible techniques in remediating Hg-contaminated sediment is highly needed.
The breakthrough of using in-situ thin layer capping, or “in-situ active capping," to remediate contaminated sediment has drawn much attention in the past decade. In particular, using activated carbon-based thin layer capping to sequestrate persistent organic pollutants (POPs) has received promising effects on some full-scale sites [8-11].
This breakthrough also shed light on the remediation of Hg-contaminated sediment, which is the other major polluted sediment within concern.
There are several knowledge gaps that have to be filled up before thin layer capping be put to application. One of which is the development of sorption materials with better stability and Hg sorption affinity. Sulfur-impregnated activated carbon (SAC) has been verified to enhance Hg adsorption capacity than its raw AC precursor in aqueous adsorption tests [12-14]. However, studies on using SAC as the thin layer capping material for inhibiting the release of Hg and MeHg from sediment environment are scarce.
One of the other major knowledge gaps for the thin layer capping is its capping
stability and the potential risks of Hg escape from caps. The sediment turbations caused by bioturbation or physical erosion have been identified as critical mechanisms in contaminant transport in the natural aquatic environment [15-18]. It is intriguing how sediment turbation may affect the efficiency of the thin layer capping in treating Hg- contaminated sediment, but related studies remain with little information.
In this master thesis, the plausibility of thin layer caps to remediate Hg-contaminated sediment was discussed and the activated carbon/clay-based thin layer caps were demonstrated in two microcosm studies. In chapter 2, a brief review is provided for practical details about Hg management and thin layer capping in real site application. The first study (chapter 3) addressed the Hg sorption behavior of a lab-made coconut-based SAC to mercury-containing sediment remediation by thin layer capping method via batch and microcosm experiments. The second study (chapter 4) evaluated the Hg leaching inhibition performance of thin layer caps under horizontal flows and artificial sediment turbation operated in microcosms.
Chapter 2 Hg Management and Thin Layer Capping
2.1 Mercury Risk and Global Management Efforts
Mercury (Hg) has been recognized as one of the most hazardous heavy metals due to its high volatility, persistence, and bioaccumulation in human beings and natural biota [1].
Long-term, high-dosage exposure of humans to Hg may pose risk to the brain, heart, kidneys, lungs, and the immune system by causing various neurodegenerative diseases, such as Minamata disease, Alzheimer’s disease, and Parkinson’s disease [1, 19-22]. Hg can be released from both natural or anthropogenic sources. With elevating human industrial activities, much Hg has been mined out of the earth and discharged to the environment as waste. Major anthropogenic Hg sources include gold mining, coal combustion, and metal production [1, 3, 23-25], which have created a huge amount of Hg-containing wastewater to be discharged into wetlands, rivers, and seawater. Amos et al. [26] estimated that around 5500 ± 2700 Mg of aquatic Hg is released into rivers annually across the globe. Excluding natural mobilization of Hg from terrestrial ecosystems, Kocman et al. [27] estimated riverine discharge of Hg with a smaller value of around 800 to 2200 Mg/year.
Global efforts on Hg management have been put together through the Minamata Convention on Mercury, a global treaty to protect human health and the environment from adverse effects of Hg. Updated on August 2018, 128 nations have signed the treaty with requirements including banning of primary Hg mining, reductions in Hg release to the environment (air or water), exposure through products and consumptions, remediation of contaminated regions, monitoring, outreach, and other means.
As Hg is discharged into the aquatic environment (i.e., wetlands, lakes, and coasts),
sediments may serve as the sink for Hg [28], which is mainly in the form of mobile divalent mercury (Hg2+) and may transforms to monomethyl mercury (MeHg) and gaseous mercury (Hg0) through resuspension and diffusion [29, 30]. Sediment suspension can be induced by natural physical processes (e.g., waves and storms) [31, 32], anthropogenic activities (e.g., dredging, trawling, and boating) [33] and biological activities (e.g., bioturbation) [34].
Hg in natural waters occurs in forms including Hg0, ionic mercury (e.g., Hg+ and Hg2+), and methylated mercury (e.g., CH3Hg+, (CH3)2Hg) [35]. While all forms of Hg are toxic, its methylated form, MeHg, is specifically problematic. MeHg has high bioaccumulation and biomagnified ability and poses a threat to biota and human [36].
MeHg usually occurs in minor proportions, at around 0.1–1.5% of total Hg [37-40] in anoxic sediment environments, but can pose a high risk to human health.
Much effort on Hg control has been put in water treatment and sediment remediation.
For wastewater treatment of Hg, lime softening, chemical precipitation, coagulation, reverse osmosis, ion exchange, and membrane filtration have been considered [41]. As for sediment and groundwater Hg remediation, many techniques have been employed, such as adsorption, biosorption, ion exchange, chemical precipitation, reduction, and stabilization/fixation. Among these methods, adsorption and stabilization/fixation have been proved to be the most practical techniques [24, 42, 43]. Dredging followed by ex- situ methods have been commonly executed due to its long-term effectiveness and relatively short remediation period [5]. However, dredging can be preventatively costly.
Also, dredging may cause remobilization of contaminants during remediation, and may inevitably retain contaminants, posing a long-term threat [44].
2.2 In-situ Approach and Thin Layer Capping
One of the main advantages of in-situ technologies is that they used toward reducing environmental impacts and avoiding the huge cost of dredging. The main challenges are related to the difficulties in ensuring that the contaminants are effectively reduced by the technologies due to the heterogeneity of sediment and the uncertainty in the distribution of contaminants. In-situ technologies require a treatability test to evaluate their efficiency at the specific site [45].
A relatively new term of “thin layer capping”, which involves the use of chemically reactive materials to sequestrate contaminants to reduce their mobility, toxicity, and bioavailability in sediment. The remediation cost of thin layer capping is likely to be smaller than for conventional strategies (e.g., dredging or sand capping). Additionally, thin layer capping may further enhance or improve habitat recolonization by benthic organisms [46]. Active materials, such as activated carbon, have been shown to reduce the toxicity of persistent organic pollutants (POPs) such as polychlorinated biphenyls (PCBs), polycyclic aromatic hydrocarbons (PAHs), or pesticides in laboratory or field studies [47-56]. Updated in 2015, more than 25 field studies have been conducted by thin layer capping approaches [57] (Table 2-1).
Table 2-1. Field application cases for thin layer capping remediation. (Partially adopted from Patmont et al.[57])
location pollutants Engineering method Remediation performance Ref
Hunters Point
Shipyard, USA PCBs Mixed –3.7% of AC into 1 ft. deep of sediment.
Bioaccumulation of clam decrease 62% after
capping for 7 months. [58]
South Basin, USA PCBs Mixed 2.0~3.2% of AC into 30–40 cm deep of sediment.
Surface water PCBs conc. decrease 90%
after capping for 18 months. [8]
Hunters Point
Shipyard, USA PCBs Mixed –3.7% of AC into 1 ft deep of
sediment. PCBs conc. reduce 73% in passive sampler. [59]
Trondheim Harbor, Norway
PAHs, PCBs
Pre-mixing of AC, clay and sand into slurry, followed by direct capped on the surface of sediment.
AC-clay mixing caps have highest in conc.
decrease during 9–12 months sampling, no obvious impact on biodiversity.
[9]
Eidangerfjord and Ormerfjord, Norway
PCBs, furans
Pre-mixing of AC(2%) and clay, followed by direct capped on the surface of sediment.
During 20 months capping, conc. of low- chloride PCBs decrease >90%, while high- chloride PCBs decrease 60–70% in porewater.
[60]
Eidangerfjord and Ormerfjord, Norway
PCBs, furans
Pre-mixing of AC(2%) and clay, followed by direct capped on the surface of sediment.
After 2 yrs of capping, control site decrease pollutant flux 70–90%, while capping sites decrease 50–60%. After 3–5 yrs, capping sites decrease 80–90%, while control sites reduce 20–60%.
[61]
St. Lawrence River,
USA PCBs
Spraying, mixing, and injecting of mixture containing two AC on to sediment
PCB bioaccumulation of benthic organisms decrease 69–93% during 3 yrs of capping.
Porewater conc. decrease 93%.
[10]
Lower Canal Creek, USA
PCBs,
DDT, Hg Direct spraying of AC(SediMite®)
During 10 months of capping, PCBs and DDT bioaccumulation have dramatic decrease, MeHg decrease for 50%.
[62]
Grenland fjords, Norway
Dioxins, Hg
Pre-mixing of AC, clay and limestone into slurry, followed by direct capped on the surface of sediment.
Up to 90% biodiversity reduction have been observed in AC capped sites, capping using non-AC material have smaller bio-impact.
[63]
2.3 Capping Materials
For the application of thin layer capping on Hg-contaminated sites, laboratory studies have been conducted using AC [14, 57, 64-66], biochar [64, 67], or surface-modified black carbon [14] to immobilize Hg. Some studies have shown that the amendment of black carbon may successfully reduce bioavailable Hg and MeHg to benthic organisms [65, 66]. Beside bench-scale studies, several field-scale studies [62, 68] have also been carried out to and observed with moderate success in reducing Hg in porewater or biotas.
Activated carbon (AC) is composed of defective graphene layers, which are formed by gasification of carbon atoms via activation (often by thermal treatment). After activation, AC can be filled with pores that greatly increase surface area (as high as 500–
1500 m2/g; [24]) and intensify van der Waals force. With its high specific surface area, AC has proven to be a promising option for remediation of contaminated sites for not only organic pollutants[47-56] but also Hg [64-66, 68, 69]. AC has several kinds of acid functional groups such as carboxyl groups on its surface, and are expected to chemically adsorb Hg [13].
Nevertheless, the sorption capacity of AC toward Hg is still limited due to the nonpolar characteristics of activated carbon, which hinder interactions between charged metal species and the solid surface [43].
The other main concern of applying black carbon to sediment remediation is its possible adverse effects on the benthic organisms itself. One-fifth of previous studies have reported adverse bio-effects using black carbon to sequestrate Hg [70]. Benthic biotas suffered from reduced species richness, biomass loss, reduced feeding rate, organ damage, or reduced growth after carbon amendment. Several studies suggested that the
possible explanations are because the black carbon may reduce nutrients’ bioavailability [71], or reduce ingestion rate by harming gut structures [72].
SAC has been verified to enhance Hg adsorption capacity than its raw AC precursor in aqueous adsorption tests (Table 2-2; [12, 13, 41, 73, 74]. Sulfurization of AC enhance Hg sorption capacity in most essays [12, 13, 41, 73, 74] and sometimes over 100% by magnitude [12, 13]. For example, Wang et al. [12] demonstrated that an increase in Hg adsorption capacity of coconut AC from 150 to 820 mg/g by sulfurization with sulfur powder (C/S ratio: 1:2) was shown. Li et al. [13] increased Hg adsorption capacity of coke from 315.8 to 694.9 mg/g by impregnated the coke with sulfuric acid (80°C, 13 h).
Also, the stability of Hg sorption to SAC was also known to increase as Hg was found stably sorbed to SAC in a broad pH range [12]. However, SAC has yet been tested to apply on Hg-contaminated sediment.
Biochar is another attractive sorbents as a potential remediation material since it is less costly than AC and may play the role of fertilizer if applied in soil [75]. Similar to AC, biochar is a porous, carbon-rich, black carbon material produced by thermally decomposing biomass under low-oxygen concentrations and temperatures between 300–
1000ºC. Gomez-Eyles et al. [64] conducted an experiment testing Hg sorption affinity of 13 kinds of biochars and 4 kinds of AC, the results showed that both AC and biochar have efficient Hg sorption affinity with AC superior in Hg2+ sorption.
Clay is a general term for a broad range of inorganic mineral with the size within 2 mm. With good thermal stability, cation exchange capacity, and settling clay may be the other potential capping material [76]. Clay minerals could be further modified to organoclays, and was reported to enhance sorption capacity up to 10–30 times to Cr, As,
Pb, Cd, and Zn [77-79].
Table 2-2. SAC enhances Hg sorption capacity in aqueous adsorption tests.
Iron sulfide minerals (FexSy) have been found to have good immobilizing ability to double-valent metals, such as Mn2+, Ca2+, Mg2+, Ni2+, Cu2+, Cd2+, Co2+, Zn2+, Pb2+, and Hg2+ [80-85], basically due to their adsorption or precipitation properties. In addition, iron sulfides have also been reported to degrade organic contaminants by reduction mechanisms. The common forms of iron sulfide minerals include mackinawite (FeS), greigite (Fe3S4), pyrite (FeS2), and pyrrhotite (Fe1-xS) [86]. In earlier research, Raw
materials
Activation method
SBET
(m2/g) S (%) Adsorption conditions (solution/temperature/pH)
Hg Sorption capacity (mg/g)
Reference
Sugar cane SO2 and H2S
400°C, 30 min 500.05 8.9
HgCl2 solution
30°C 6 188.68 [73]
Coconut
Non-sulfurized 1884 0
25°C 5.5
150
[12]
Sulfur powder, S:C=1:2 400°C, 2 h
–1000 22 820
Coke
Non-sulfurized 193.7 1.39
25°C 5
315.8
[13]
H2SO4, 80°C,
13 h 136.7 3.33 694.9
Almond seed
Activated by phosphoric acid
+C2S sulfurization,
S:C=2:1 600°C, 1 h
1637 9.9
25°C 6
–230
[41]
35°C –280
45°C –290
25°C 3 –190
8 –230
Coal
Non-sulfurized 828 1.5
30°C 7
455
[74]
Dimethyl disulfide 30°C, 48 h
348 9.6 441
Sulfur powder, S/C=4:1 145°C, 30 min 600°C, 30 min
596 10.8 529
mackinawite, pyrite, and pyrrhotite have been shown to have high potential to sequestrate Hg [87, 88]. Some of the more recent studies have been conducted using lab-made nano- mackinawite to sequestrate Hg. Liu et al. [86] reported FeS with adsorption capacity up to 1700 mg/g (by calculation) at pH = 5.6; more than 99% Hg was removed at Hg/FeS ratio < 1000, with 77% of the removal by precipitation and 23% by adsorption (Hg/FeS
= 0.22). Sun et al. [89] found that commercial pyrite had lower Hg sorption capacity (9.9 mg/g) as compared to lab-synthesized mackinawite (769.2 mg/g), probably due to the smooth surface of pyrite. Skyllberg and Drott [90] conducted a slurry batches study, discovering that the dosage of 2% FeS in 5000 μg-Hg/g organic-rich soil may outcompete O/N ligands in sediment for Hg sorption, resulting in 50% Hg sorbed on FeS to form HgS4 (metacinnabar). As the ratio of FeS increased to up to 20%, a complete outcompete with 100% Hg sorbed on FeS was observed.
To date, a promising active material in remediating Hg-contaminated sites is yet to be proven with good adsorption efficiency, stability, and eco-friendliness. Consequently, further research is needed in several areas, including (1) fabricating novel capping materials with good adsorption affinity for Hg or other heavy metals; (2) establishing competitive adsorption models of amendments in sediment condition to evaluate real adsorption outcomes in nature disturbance; (3) introducing amendments with biological tests to prove the efficiency of reducing Hg bioavailability; (4) developing efficient, low- impact capping delivery systems; (5) assessing long-term stability and ecological recovery of placing active caps; (6) conducting life-cycle analysis for thin layer capping remediation.
2.4 Real Site Practice
In real site application, thin layer capping can be performed in two existing methods:
(1) mechanical mixing amendment; (2) spray thin layer capping. Mechanical mixing amendment involves applying of capping materials and mixing of materials into top layer of sediment. Several advantages of mechanical mixing amendment can be anticipated, such as better transportation of materials, less material lost by water flow, or less possibility of adverse effect to benthic organisms [9, 58]. However, mechanical mixing amendment also tends to mobilize sediment during engineering procedure, and is likely to be costlier due to the mixing of sediment. Cho et al. [8] demonstrated two types of machinery to perform mechanical mixing amendment (Figure 2-1). The first machinery is modified by a rotary cultivator originally used for weeds removal in swamps. The second machinery, the injection system, was originally used for injection of cement to stabilize sediment.
Figure 2-1. Cho et al. [8] performed mechanical mixing amendment with (a) a rotary cultivator (Aquatic Environments, Inc.,) and (b) an injection system (Compass Environmental, Inc., GA).
Spray thin layer capping involves pre-mix of capping materials and directly spraying into the water body without further mixing. As the material sink to the bottom of the water body, a thin layer of cap formed on the surface of the sediment. With the assistant of benthic biotas, capping materials would be able to mix with the top of surface sediment, therefore immobilize pollutants in the porewater [9]. Menzie et al. [62] performed spray
thin layer capping in a shallow wetland with a self-made spreader, consisted of a 250- pound hopper and a diesel sprayer (Figure 2-2). Cornelissen et al. [60] performed a spray thin layer capping in a fjord with 100 m of water depth by using a spraying instrument in a ship (Figure 2-3). The ship was designed with 275 m3 water tank and a dredging pumps.
The capping materials were premixed in the tank by a pump (500 hp), latter spraying through an elastic tubing in 10 m deep into the water by the other pump (204 hp). Spray thin layer capping appears to be more flexible in real site practice since it can be applied in both shallow or deep regions. Also, spray thin layer capping is less costly as it doesn’t need additional mixing device. In addition, several studies [10, 51] have concluded that contaminants immobilizing efficiency did not differ with or without artificial mixing of sediment.
Figure 2-2. Menzie et al. [62] performed a spray thin layer capping using self-made equipment (Vortex TR Aquatic system).
Figure 2-3. Cornelissen et al.[60] premixed AC, clay and seawater and preformed a spray thin layer capping by a spraying system on a ship.
2.5 Estimation of Remediation Cost
Despite all technological difficulties, the cost of remediation may be just as important since sediment remediation can be quite costly and even to a degree of unrealistic.
Remediation methods with “in-situ” strategies have huge advantages that they can be operated with reduced environmental impact and without costs associated with dredging [45].
As one of the most promising in-situ remedies, thin layer capping was studied of its remediation cost [5, 62]. The material cost and operational cost are two major portions of its cost. Some other portions of costs may also be needed on other aspects [62], including laboratory studies, construction of types of machinery, materials transportation etc. The cost of thin layer capping was estimated within the following paragraphs, with an exchange rate calculated by USD/NTD = 1:30, and Euro/NTD = 1:40.
Menzie et al. [62] compared several remedies (i.e. thin layer caps, sand caps, and dredging) with a case study in Canal Creek, Maryland. In the estimation, capping material
SediMite® costed US$3,730 per ton (NTD$111.9 per kg), slightly higher than commercial AC (NTD$60–100 per kg); amendment dose was 4.53 kg/m2; instruments costed US$23,000 (NTD$690,000); deliver operation costed US$14.085 per m2 (NTD$422.5 per m2); laboratory studies costed US$23,500 (NTD$700,000). As the results, to remediate 10 acres of sediment may cost US$89,000 per acre (NTD$6,640,000 per HA) by SediMite® thin layer caps. If applying dredging technology, the same 10-acre contaminated site may cost US$800,000 per acre (NTD$59,300,000 per HA) by dredging with 3 ft. Calculation of some other remedies was included in Menzie et al. [62] and can be shown in Figure 2-4.
Figure 2-4. Menzie et al. [62] compared several remedies with a case study in Canal Creek, Maryland.
The other estimation based on the parameters from Kupryianchyk et al. [5] was made by the author and matched the results of Menzie et al. [62]. Kupryianchyk et al. [5]
provided parameters including the material cost for thin layer capping: 3€/kg;
operational cost: 30 €/m3; dredging cost: 1–10 €/m3; the cost of thermal treatment: 60
€/m3; the cost of disposal: 10–20 €/m3. Assuming a contaminated site with pollutants within 50 cm deep; providing thin layer caps with 3.5 kg/m2 (as suggested by Ghosh et al. [7]). Thus, a brief calculation on the cost of thin layer capping is approximately NTD$4,800,000 per HA (with 87.5% of the material cost and 12.5% of operational cost).
In terms of dredging and thermal treatment, a cost of NTD$14,200,000–18,000,000 per HA were needed.
Based on the estimation of Kupryianchyk et al. [5] and Menzie et al. [62], a brief cost thin layer capping (about NTD$5,000,000–6,000,000 per HA) is likely to be much cheaper to ex-situ treatment (various within NTD$20,000,000–60,000,000 per HA). This estimation of dredging also be matched by NRC [91], which estimated the cost of dredging may be in between US$145–530 per CY (NTD$16,620,000–60,770,000 per HA). Although it should be fair to point out that some aspects may not be included, such as that the estimation based on Kupryianchyk et al. [5] only estimated the major portion of the thin layer capping (i.e. material cost and operational cost). Also, some other factors remain complex and can be site-specific, which is also not included in the estimation. As a whole, however, it can be fair to point out that the thin layer capping technology can be less costly compared to ex-situ methods if operated correctly.
2.6 Challenges and Opportunities
As demonstrated in the previous chapters, the thin layer capping technology is a promising alternative for the sediment remediation, but challenges remain in various aspects. Therefore, future studies are needed to fill in knowledge gaps as suggested below:
(1) In the field of material science, the relationship between sediment contaminants and the capping materials should be further studied. Although the sequestration
of POPs by AC has been widely studied, the sequestration of other contaminants (e.g. Hg) that pose high threat to ecology and human health is also needed. Novel sorbents are needed to adopt different contaminants and various wetland conditions [14]. Also, the impact of various geochemical factors (e.g. dissolved organic matter, ions, microbial, or biotas) can have major roles in determining the success of the thin layer capping, and the interaction of which should be further studied.
(2) In the field of geology, submarine groundwater flow [92], river erosion [17, 18], tidal effects [15, 16], and bioturbation [93] have been identified as critical mechanisms in contaminant transport in the natural aquatic environment. The stability and successfulness of thin layer capping under water can be determined by such geological condition. The research establishing the efficiency of thin layer capping with sediment turbation is scarce. One of the reasons may be due to the difficulty of simultaneously quantifying turbation magnitude [94, 95] and providing a comparable condition to real site capping application.
(3) In the field of engineering and the real site practice, the anchoring problems for lighter materials (e.g. AC) sometimes results in settling problems or material loss [9]. The strategies such as the granulating materials, adding anchoring materials, or manufacturing materials into geotextile mat [96] may be useful but requires further studies.
(4) In the field of ecology, some studies reported that the AC amendment did not result in ecological disturbance in field studies [70, 97, 98], while other found benthic biotas suffered from reduced species richness, biomass loss, reduced feeding rate, organ damage, or reduced growth after carbon amendment in labs
[70-72] or field sites [63]. The materials for thin layer capping should be put into tests before real site application.
(5) In the field of legislation and regulations, the bias against remedies other than removal still exists. There are also perceptions and regulatory precedents to "get it out". This view of sediment remediation may be appropriate but there are numerous occasions where removal is not realistic or ineffective for risk reduction [7].
Chapter 3 Capping of Mercury Sediment with SAC
3.1 Introduction
With high neurotoxicity, volatility, and bioaccumulation ability, mercury (Hg) has been considered as one of the most toxic heavy metal in the environment. Hg, in general, exists in the form of divalent Hg (i.e., Hg2+) in the aqueous phase and may transform to methylmercury (MeHg), which is one of the most toxic Hg forms via biomethylation under an anoxic sediment environment [2]. With high affinity in organism tissue [35], MeHg has high tendency to accumulate in biota and biomagnify through food chains, thus causing adverse effects to biota or human. Although ex-situ strategies have been proven promising in removing Hg out of sediment [3, 4], problems such as unfeasible cost [5], resuspension of contaminants [6, 7], and production of contaminated sediment residues [6, 7] may discourage their application. Therefore, development of novel and feasible techniques in remediating Hg-contaminated sediment is highly needed.
In-situ thin layer capping is a newly emerged in-situ remediation concept that can be apply to remediate Hg-contaminated sediment. Thin layer capping involves the use of active materials to sequestrate contaminant in sediment, therefore achieving remediation goal of reducing uptake of contaminants by biota and subsequently by the human. It has been shown that thin layer capping using activated carbon (AC) could be a promising treatment in reducing organic contaminant bioavailability in sediment, and has been demonstrated either in full-scale studies [8-10, 59, 61, 62] or long-term prediction models [48, 99]. As for Hg-contaminated sediment, however, fewer studies have been conducted [62, 66, 100], the reason may be because that AC generally has higher affinity to organic pollutants (log KD ≈ 7.0‒10.0) than Hg (log KD ≈ 3.0‒7.0) [64]. Therefore, seeking
effective active materials with higher affinity to Hg is an important step to adopt the thin layer capping technique to Hg-contaminated sediment.
Sulfur-impregnated activated carbon (SAC) has been verified to enhance Hg adsorption capacity than its raw AC precursor in aqueous adsorption tests [12-14]. The results were reasonable considering its reaction thermodynamics, for which Hg has high affinity to sulfur (i.e., log K ≈ 52.7‒53.3) [23], as compared to that for Hg to organic matter (i.e., log K = 22‒28) [35]. Wang et al. [12] demonstrated that an increase in Hg adsorption capacity of coconut AC from 150 to 820 mg/g by sulfurization with sulfur powder (C/S ratio: 1:2) was shown. Furthermore, Li et al. [13] increased Hg adsorption capacity of coke from 315.8 to 694.9 mg/g by impregnated the coke with sulfuric acid (80°C, 13 h).
Based on the previous research, we expected that SAC may have strong potential as thin layer capping material to remediate Hg-contaminated sediment. However, studies on using SAC as the thin layer capping material for inhibiting the release of Hg and MeHg from sediment environment are not done and presented. In this research, aqueous adsorption tests, sediment competition adsorption tests, and microcosm experiments were carried out to verify the Hg adsorption abilities of SAC and its raw AC counterpart. The feasibility of using SAC as the capping material for inhibiting the release of Hg and MeHg from sediment environment was further evaluated. The results obtained in this study are practically critical because a highly Hg-contaminated site in Southern Taiwan is currently remediated, for which thin layer capping has been considered as one of the feasible approaches for limiting the accessibility of biota to the Hg present in the contaminated seawater ponds.
3.2 Materials and Methods
3.2.1 Materials
The actual sediment used in the study, designated as TY03, was sampled from Taoyuan irrigation channel, Taiwan, acquired according to the Taiwan Environmental Protection Administration (TEPA) standard method (NIEA S104.32B). Sediment within 0−15 cm depth was collected using a stainless crab bucket. Sampled sediment was immediately measured for oxidation-reduction potential (ORP) and then sealed in bags and transported back to the laboratory within 4 h. Wet sediment was air-dried in a laboratory hood, picked out branches and benthic biota, then ground and sieved to pass through 20 mesh sieve. Dry sediment was stored in room temperature without sunlight.
Commercial AC was obtained as raw AC material (10−18 mesh). Received AC was first rinsed with DI water for several times and dried in 60°C for 24 h, then stored in a drying kettle. SAC was prepared by mixing 20 g of AC and 4 g of sulfur powder in a heating boat, heated to 400°C for 1 h and maintained for 2 h in a tubular furnace (Lindberg/Blue- M model STF55346C); 50 mL/min of nitrogen gas was constantly flowed through the furnace tube to maintain an oxygen-free environment. The prepared SAC was then sieved to 10−18 mesh and stored under the same condition as that for AC.
3.2.2 Physical and Chemical Analysis of Materials
Sediment pH was measured by pH meter (SunTex SP-2300) based on TEPA standard method (NIEA S410.62C); readings of pH value were recorded after adding 20 g of dried sediment and 20 mL DI water in a 50 mL beaker and set for 1 h. The texture of sediment was measured using a bouyoucos hydrometer [101]. The cation exchangeable capacity (CEC) of sediment was measured by available K, Na, Ca, and Mg, which were extracted
by leaching dry sediment through 1 N NH4OAc solution, based on TEPA standard method (NIEA S201.61C). Other elements including Fe, Mn, Al, K, Na, Ca, and Mg were extracted by citrate bicarbonate buffer solution [102] and then measured by ICP-OES (Agilent 710 Series, Agilent Technology). Sediment organic content was measured through Walkley-Black wet oxidation [103]. The concentrations of NH4+-N and NO3--N were measured by steam distillation using MgO and the Devarda’s alloy [104].
The specific surface area and pore size distribution of the adsorbents (AC and SAC) were measured using a physisorption analyzer (ASAP 2020M, Micromeritics Inc.).
Nitrogen adsorption-desorption isotherm at 77K was obtained using a Micromeritics ASAP 2020; the Brunauer-Emmett-Teller (BET) method was used to determine the specific surface area at relative pressure (P/P0) within 0.05 to 0.3 based on ASTM D4820- 96a. Micropore size distribution was determined by the quenched solid density functional theory (QSDFT) model. The surface morphology of adsorbent was measured by a scanning electron microscope (SEM, JSM-7600F, JOEL). X-ray photoelectron spectra (XPS) were recorded using a ULVAC PHI-5000 VersaProbe spectrometer with monochromatic Al Kα radiation. Element analysis was carried out by an elemental analyzer (Flash 2000, Thermo ScientificTM) to measure elements including C, H, O, N, and S in the adsorbents.
3.2.3 Aqueous Adsorption Experiment
The aqueous adsorption experiment was performed resembling Wang et al. [12] In brief, analysis-grade AAS Hg standard (1000 mg/L Hg, J.T.Baker) and MeHg standard (1 mg/L, BrooksRand) were used as Hg stocks and diluted to prepare Hg2+ and MeHg solution, respectively. Hg solution was adjusted to pH =7.0±0.1 using NaOH (0.01−0.1 M) and HCl (0.01−0.1 M) solution. Adsorbent (AC or SAC) of 50 mg and 50 mL Hg
solution were added into clean 100 mL HDPE bottles. The HDPE bottles were then placed in a water bath shaker (30°C, 125 rpm). After the adsorption tests, water samples were collected for analysis of THg and MeHg.
3.2.4 Sediment Competition Adsorption Experiment
Hg-containing sediment in this study was prepared by spiking Hg solution in the sampled sediment. Hg stock solution (5000 mg-Hg/L) was prepared by dissolving HgCl2
in DI water with 0.2% HCl. The spiking procedure was carried out by adding 200 g of dried sediment into a clean 400 mL glass jar; Hg stock was diluted with DI water and added to the glass jar to an anticipated Hg sediment concentration of 15−250 mg/kg. The glass jar was then filled with DI water, capped with stainless steels caps and sealed with parafilm. Spiked sediment jars were incubated for 117 d. After incubation, overlying water was removed, and sediment was freeze-dried and stored in a 4°C refrigerator.
Sediment competition adsorption experiments were carried out by adding 5 g of dried Hg sediment, 50 mg of adsorbent, and 50 mL of DI water in a HDPE bottle. The HDPE bottles were placed in the water bath shaker (30°C, 125 rpm) for 96 h. After the adsorption tests, water samples were collected, filtered through 0.45 μm mixed cellulose ester filter (DISMIC-25AS, Toyo Roshi Kaisha, Ltd), added 0.1% BrCl2 solution and stored in glass bottles. Sediment samples and adsorbents were separated, freeze-dried, and sieved (20 mesh). Microwave digestion was then carried out using aqua regia to treat the sediment and adsorbent samples to obtain the aqueous aliquots for subsequent Hg measurement.
3.2.5 Microcosm Experiment
Vertical upflow microcosms were constructed in this study to measure the Hg release from sediment to its overlying water (Figure 3-1). Vertical microcosms were designed to
have a total height of 30 cm with an internal height of 15 cm and an internal diameter of 6 cm and with glass fiber filter at the bottom. Tap water was initially filtered with MF filter and stored in a 20 L equalizer. Filtered water was then pumped into the columns as inflow fluid by a peristaltic pump with a flow rate of 1.0 mL/min.
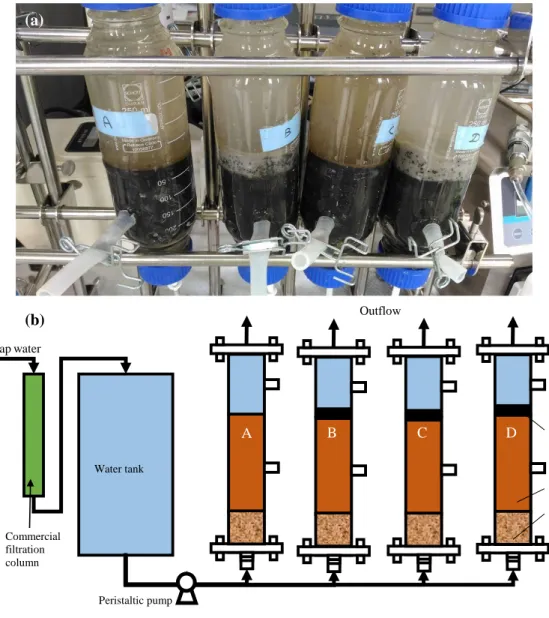
Figure 3-1. (a) photo image; (b) scheme diagram of vertical up-flow microcosms construction. Vertical flows were delivered from the bottom of the columns. The depth of sediment (TY03) is approximately 15 cm. From column A to D: (A) no caps; (B) SAC + bentonite; (C) SAC + additional TY03 sediment; (D) AC + bentonite.
(a)
(b)
Commercial filtration column Tap water
Water tank
A B C D
Outflow
Peristaltic pump
Sampling port
Porous support (glass fiber) Hg sediment Thin layer caps
Four columns were set in this study, with each column filled with 200 g of dried Hg sediment containing 250 mg-Hg/kg-sediment prepared as aforementioned. Active caps were deployed by mixing adsorbents with bentonite or clean sediment, described as follows. Column A was set with no caps as the control unit; column B was capped with the SAC (6 g; i.e. 3 wt% SAC added) and bentonite (6 g) mixture; column C was capped with the SAC (6 g) and additional TY03 sediment (6 g) mixture; column D was capped with the AC (6 g; i.e. 3 wt% added) and bentonite (6 g) mixture. To start up microcosms, dried Hg sediment was added into the column and filled with filtered water for 24 h to settle, then the mixtures of active caps were gently added on top of the column and let the mixtures be settled to the surface of the sediment. After 1 h of settling, 1.0 mL/min flow was given and counted as the operation day 1. Outflows of the systems were carried out with tubing and the top of the column was sealed without headspace. Temperature, ORP, and pH value of the overlying water were measured constantly, and water samples for THg and MeHg analyses were collected weekly.
3.2.6 Mercury and Methylmercury Analysis
Water samples for THg and MeHg analyses were filtered through 0.45 μm mixed cellulose ester filter (DISMIC-25AS, Toyo Roshi Kaisha, Ltd), then added 0.1% BrCl2
solution (THg) or 0.2% HCl (MeHg) and stored in 50 mL glass bottles (THg) or 40 mL brown glass bottles with Teflon caps (MeHg), respectively. THg in sediment and water was measured following USEPA 1631 and NIEA W331.50B, and measurement of MeHg in sediment and water followed NIEA S341.60B and NIEA W540.50B. Before analysis, Hg in THg sample was oxidized to Hg2+ by stored with 0.1% BrCl. Halogens in THg sample were destructed by H3NO3·HCl, and final reduction of Hg2+ to Hg0 was completed by SnCl2. The sample was purged and Hg0 was collected on a gold trap. After thermal
desorption, the Hg0 was injected to cold vapor atomic fluorescence spectroscopy (CVAFS;
Brooks Rand Automated Total Mercury System). MeHg sample was buffered by citrate buffer, and MeHg was ethylated by adding sodium tetraethyl borate (NaBEt4).
Ethylmercury was volatile and thus carried through purge and trap system and analyzed by GC/CVAFS (Brooks Rand MERX Integrated Automated MeHg Analyzer). Quality assurance (QA) and quality control (QC) were checked by analyzing duplicate samples, quality control samples, and spiked samples from each batch.
3.3 Results and Discussion
3.3.1Characteristics of Sediment and Adsorbent
The characteristics of sediment (TY03) are listed in Table S3-1. TY03 had a pH value of 5.23 and soil organic content (SOC) of 3.66 wt%. Organic content in sediment is an important parameter for adsorption. As shown in previous research, SOCs of sediments have been observed as low as 1−2%, while can be as high as 15−20% [65, 105, 106].
Therefore, TY03 may be considered acidic sediment with relatively low organic content.
THg of TY03 was averaged 0.6232 mg/kg. The texture of sediment can be categorized as sandy loam with sand, silt, and clay content of 73.6, 9.6, and 16.8 wt%, respectively.
The characteristics of adsorbent AC and SAC including BET surface area, total pore volume, median pore width, and element content (C, H, O, N, S) are shown in Table 3-1, indicating that the characteristic of ACs was different after sulfur treatment. Raw AC had a high specific area of 818.3 m2/g. After sulfurization, the BET specific area decreased to 728 m2/g for SAC. Similar results have been observed in several studies[12, 14, 41, 74].
Asasian and Kaghazchi [74] reported that sulfurization with elemental sulfur to coal- based AC resulted in a decrease in surface area by 58% (from 828 to 596 m2/g). Wang et
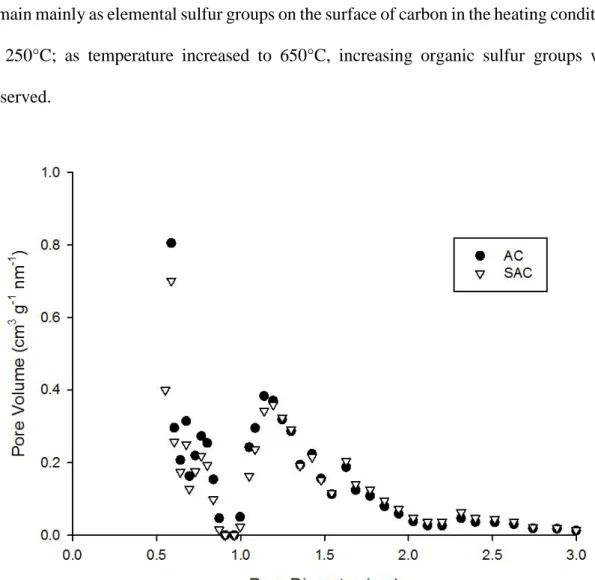
al. [12] also observed a marked decrease of surface area by 47% (from 1884 to approximately 1000 m2/g) as sulfurizing the coconut AC with elemental sulfur. In this study, only 10.9% of surface area were lost, the reason may be due to the large granular size (i.e., 10−18 mesh) of AC leading to less block and destruction of the internal porous structure of AC. Shifting of the average pore width toward a larger value and a decrease in total pore volumes were also observed after sulfurization of AC. Comparing the results from surface area analysis and SEM images (Figure S3-1), it may suggest that the reduction of surface area was mainly due to the collapse or block of micropores by heating and sulfur attachment. QSDFT micropore structure analysis (Figure 3-2) supported the reduction of micropores within a pore width of 0.5−1.0 nm after sulfurization.
Additionally, the morphology of AC and SAC obtained by SEM images showed no significant difference in the surface structure after sulfurization.
Tables 3-1. Physical and chemical properties of precursor AC and resulting SAC.
After sulfurization, the sulfur content increased from 0.47 to 4.09 wt%. This content was smaller compared to some SAC with sulfur content as large as 10−22 wt% reported in preview research [12, 74] because we intentionally kept the sulfur content less than 5 wt%. By doing so, most of the surface area and pore volume can be maintained because the pores were not markedly blocked by the impregnated sulfur. The sulfur content within
BET surface area Total pore volume Mean pore width C H O N S
(m2/g) (cm3/g) (nm) (wt%)
AC 818.4 0.462 0.9454 78.88 1.41 4.52 0.73 0.47
SAC 728.1 0.416 0.9809 75.42 1.22 6.32 0.73 4.10
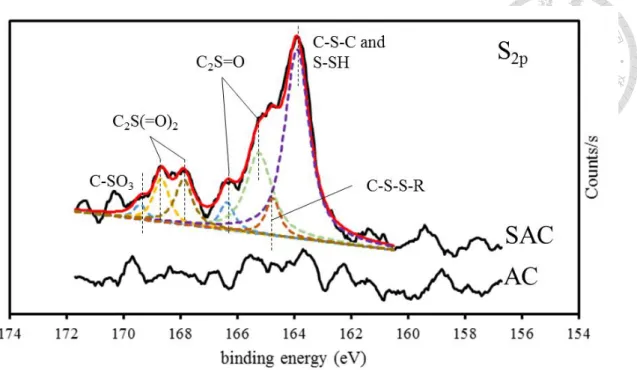
4−5 wt% should be sufficient for Hg capture with various sulfur functional groups in the SAC based on XPS results (Figure 3-3). The deconvoluted XPS S2p signals at binding energies of 163.90, 164.75, 165.24, 166.36, 167.88, 168.67, and 169.41 eV corresponded to functional groups such as sulfide (C-S-C) + thiophene (C-S-C) + thioethers (C-S-C) + mercaptans (C-SH), disulfide (C-S-S-C), sulfinyl group (C2S=O), sulfinyl group (C2S=O), sulfone (C2S(=O2)), sulfone (C2S(=O2)), and sulfonate (C-SO3) reported in previous studies[12, 107-109]. Hsi et al. [110] suggested that impregnated elemental sulfur would remain mainly as elemental sulfur groups on the surface of carbon in the heating condition of 250°C; as temperature increased to 650°C, increasing organic sulfur groups was observed.
Figure 3-2. Micropores size distribution of raw AC and SAC based on QSDFT model.
Figure 3-3. Deconvoluted S2p peak for AC and SAC.
3.3.2 Aqueous Adsorption Experiment
Kinetic adsorption tests were carried out with Hg2+ adsorbed to AC and SAC (Figure 3-4). The experimental results suggested that about 81% of THg adsorption occurred within the first 6 h, with removal efficiency of Hg2+ at approximately 56.3 and 79.1% by AC and SAC adsorption, respectively. The equilibrium was reached at a time between 16 and 24 h. The adsorption rate appeared to be slower due to the larger size of granular AC (i.e., 10−18 mesh), as compared to previous research. For example, Li et al. [13] observed 87% of total Hg adsorption in the first 3 h, achieving equilibrium at around 10 h.
The experimental data were further fitted by pseudo-first and pseudo-second order kinetic models, for which the equations were described as below:
Pseudo-first order rate equations:
𝑑𝑞𝑡
𝑑𝑡 = 𝑘𝑆1(𝑞𝑒− 𝑞𝑡) (eq. 1)
log(𝑞𝑒− 𝑞𝑡) = 𝑙𝑜𝑔(𝑞𝑒) − 𝑘𝑆1
2.303𝑡 (eq. 2) Pseudo-second order rate equations:
𝑑𝑞𝑡
𝑑𝑡 = 𝑘𝑆2(𝑞𝑒− 𝑞𝑡)2 (eq. 3)
1
(𝑞𝑒−𝑞𝑡)= 1
𝑞𝑒+ 𝑘𝑆2𝑡 (eq. 4) Whereas qt = sorption of sorbate concentration on the sorbent at given time t; qe = sorption of sorbate concentration on the sorbent at equilibrium state; kS1 =rate constant for pseudo-first order model; kS2 =rate constant for pseudo-second order model.
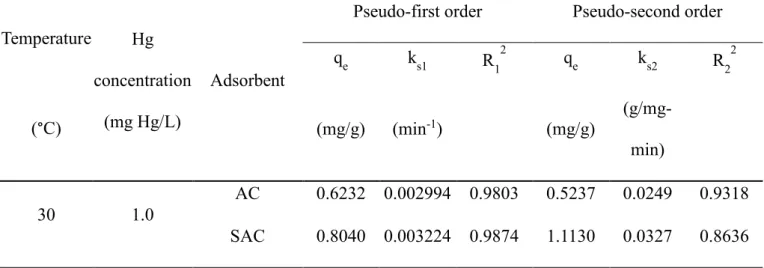
Pseudo-first and second order models can, therefore, being employed by eq. 2 and 4 to describe the adsorption data. The kinetic parameters were calculated and shown in Table 2-2. Both the adsorption data of AC and SAC had a better fitting to the pseudo-first order model (R2=0.9803 and 0.9827, respectively) than to the pseudo-second order model (R2= 0.9318 and 0.8636, respectively). The pseudo-first order kinetic constant for AC and SAC is 2.994×10⁻³ and 3.224×10⁻³ min-1, respectively, indicating that SAC had a faster rate of reaching adsorption equilibrium than AC. This adsorption rate appears to be lower than previous research [13], but it is in prediction since the AC used in this research is granular (> 300 μm in diameter) rather than in powder (< 300 μm in diameter). Coarser AC has been long regarded slower and less effective in adsorption reaction as compared to finer AC [5, 9, 47]. Zimmerman et al. [47] discovered that GAC (400−1700 μm in diameter) was less effective in reducing hydrophobic organic contaminant bioaccumulation in one-month tests. Cornelissen et al. [9] compared different field tests and found that finer AC (<45 μm in diameter) showed higher adsorption effectiveness than coarser AC (75−300 μm in diameter) but less capping stability. Although slower
adsorption rate of GAC was observed in previous studies and in this work, it is still reasonable to use coarser GAC because it is more stable to serve as the thin layer capping material [9].
Figure 3-4. Hg2+ adsorption by AC and SAC as a function of time. For here [Hg2+] = 1 mg/L, Hg solution = 50 mL, adsorbent dosage = 50 mg, and pH = 7.0±0.1.
Table 3-2. Fitting parameters of AC and SAC adsorption by pseudo-first and second
Temperature Hg concentration
(mg Hg/L)
Adsorbent
Pseudo-first order Pseudo-second order
qe ks1 R12 qe ks2 R22
(°C) (mg/g) (min-1) (mg/g) (g/mg-
min)
30 1.0
AC 0.6232 0.002994 0.9803 0.5237 0.0249 0.9318 SAC 0.8040 0.003224 0.9874 1.1130 0.0327 0.8636
order reaction models.
Distribution coefficient (KD) is a useful tool to describe the affinity of Hg to AC [64, 65] in a linear relationship, defined as the ratio of the concentration of sorbate sorbed to the sorbent divided by its concentration in solution. This concept includes an assumption that the solute concentration is very low that the sorption of sorbent only controls by concentration of solution rather than remaining sorption sites on the sorbent. It was recently discovered that the distribution of adsorbate on black carbon should be considered with two separated mechanisms (adsorption and partition) [111], and by definition, Hg uptake by black carbon should be mainly governed by adsorption mechanism because Hg uptake capacity does not increase after reaching maximum capacity, which was observed in previous research [13, 73, 74]. However, it may still be plausible to introduce KD concept since the Hg concentration used in this study was very low and far from reaching the maximum adsorption capacity of AC.
Adsorption isotherms of AC and SAC are shown in Figure 3-5. The results showed that KD of SAC (9.426×10⁴, R2=0.996) to Hg2+ was more than two-fold larger than that for AC (i.e., 3.694×10⁴, R2=0.958). Notably, the affinity of ACs to MeHg was almost 10- times larger than that to Hg2+, as shown in our results, that KD for AC and SAC to MeHg was 2.254×10⁵ (R2=0.983) and 7.661×10⁵ (R2=0.834), respectively. The reason for SAC having greater adsorption affinity to Hg2+ than AC is expected. As aforementioned, Hg can be immobilized by sulfide to form highly stable HgS (i.e., log K ≈ 52.7‒53.3) [23].
SAC had larger sulfur content (4.09 wt%) than that of AC (0.47 wt%). Additionally, based on the XPS results, SAC possessed various sulfur functional groups; all of which lead to the higher affinity to Hg2+ for SAC than for AC [12, 13, 74].
![Figure 2-1. Cho et al. [8] performed mechanical mixing amendment with (a) a rotary cultivator (Aquatic Environments, Inc.,) and (b) an injection system (Compass Environmental, Inc., GA)](https://thumb-ap.123doks.com/thumbv2/9libinfo/9608817.634303/24.892.121.801.571.788/performed-mechanical-amendment-cultivator-aquatic-environments-injection-environmental.webp)
![Figure 2-3. Cornelissen et al.[60] premixed AC, clay and seawater and preformed a spray thin layer capping by a spraying system on a ship](https://thumb-ap.123doks.com/thumbv2/9libinfo/9608817.634303/26.892.120.779.113.398/figure-cornelissen-premixed-seawater-preformed-spray-capping-spraying.webp)
![Figure 2-4. Menzie et al. [62] compared several remedies with a case study in Canal Creek, Maryland](https://thumb-ap.123doks.com/thumbv2/9libinfo/9608817.634303/27.892.131.751.513.888/figure-menzie-compared-remedies-study-canal-creek-maryland.webp)