國立臺灣⼤學理學院氣候變遷與永續發展國際學位學程 碩⼠論⽂
International Program in Climate Change and Sustainable Development College of Science
National Taiwan University Master Thesis
氣候變遷下臺灣包種春茶累積溫量的適採期地圖化 Mapping the Growing-Degree-Day of the Optimal Harvest
Timing of Spring Pouchong Tea in Taiwan under Climate Change
陳⽟蓮 Yu-Lien Chen
指導教授:羅敏輝博⼠
Advisor: Min-Hui Lo, Ph.D.
中華民國 108 年 8 月
⼝試委員會審定書
誌謝
碩⼠班就讀期間,在研究上遇到了許多⼈事物。經歷過,也體驗過。查找
⽂獻、確定⽅向、修改題目、搜集數據、處理資料、撰寫論⽂,當然在這些階
段中充滿著各種掙扎撞牆。因為接受了許多⼈的幫忙,最後才能如期完成這篇
作品。我將盡我所能地列舉,如有疏漏,請多包涵!
IPCS的⼤夥兒們;羅敏輝老師實驗室的各位;園藝系陳右⼈老師實驗室的
⼤家;慈⼼坪林淨源茶廠的呂美瑩廠長、侯又升師兄;茶業改良場的陳國任前
場長、林義豪助理研究員、賴正南技佐;坪林茶農白國良、陳易泰;園藝系林
書妍老師、海洋所王慧瑜老師、⼤氣系謝宜桓博⼠、臺⼤寫作教學中⼼江介
維、張晨和柯凱彣;園藝所的凃佩君學姊、南區氣象中⼼的珮雯學姊、渝靖;
林業試驗所的王相華博⼠;擔任⼝試委員的林博雄老師、陳右⼈老師、莊振義
老師、黃倬英老師(按姓名筆劃順序名列);指導教授羅敏輝老師;最後是我的
⽗母、弟弟和許多位家⼈。
謝謝在這段時間內我所遇到的⼈們的各種支持和提點,謝謝!
摘要
臺灣茶產業的韌性議題在面對氣候變遷的洪流是刻不容緩,因此亟需「最
適茶採收等時線圖」的建立。本研究採取歷史悠久並廣受運用的⽣長度日積溫
模型,作為茶採收時間的視覺性評估之⽅法。在獲得了茶業改良場的茶葉相關
紀錄與臺灣氣候變遷推估資訊平台的氣溫資料後,參考日本櫻花前線預測的資
料視覺化策略,獲得「最適茶採收等時線圖」的結果。氣候變遷的氣溫上升效
應對於茶採收產⽣了效期縮短的影響。最後,本研究提供了⼀種以茶園管理為
目標的視覺化途徑;倘若後續的資料搜集、記錄和積溫模型優化可被妥善執
⾏,本研究途徑將可被應用、推廣⾄常民⽣活之中。
關鍵字:茶、臺灣地區暖化現象、最適茶採收等時線圖、⽣長度日積溫模型。
Abstract
Climate change is adversely affecting the resilience of the tea industry, which is why the establishment of Optimal Tea HArvest Isochrone Maps (OTHAIMs) is needed.
In this study, we categorize tea growth into three dimensions: yield, quality, and timing.
And we provide insights into the trend of tea harvest in Taiwan in the future when the scenario of business-as-usual is to be expected. The profound and well-cited Growing Degree-Day (GDD) model is utilized in this study to evaluate the visualization of the timing of tea in Taiwan. Using data from the Tea Research and Extension Station (TRES) and the Taiwan Climate Change Projection and Information Platform (TCCIP), the outcomes of OTHAIMs are acquired with pruning date geneses in analogy with Sakura Zensen, cherry blossom blooming frontline maps, from Japan. Results indicate that the warming of climate change thus results in the shortened durations of tea harvest. In conclusion, this study provides a visualization approach for the government and the academia for further investigation of tea harvest and management, while extensive records of tea data and optimization of GDD model afterward may help this approach be put into application.
Keywords: Camellia sinensis (L.) O. Kuntze, reginal warming in Taiwan, Optimal Tea HArvest Isochrone Maps (OTHAIMs), heat accumulation unit.
List of Contents
⼝試委員會審定書 ... i
誌謝 ... ii
摘要 ... iii
Abstract ... iv
List of Contents ... v
List of Figures ...vii
List of Tables ... viii
List of Appendixes ...ix
1 Introduction ... 1
1.1 Tea as An Essential Economic Crop ... 1
1.2 The Three Dimensions in Tea Growth: Yield, Quality, and Timing ... 2
1.3 The Well-known and Widespread Formula: Growing Degree-Day ... 3
1.4 Climate Change as An Adversity for Tea Growth ... 3
1.5 The Question: Climate Change v.s. Harvest Timing of Tea ... 4
2 Methodology ... 7
2.1 Methods ... 7
2.1.1 Growing Degree-Day (GDD)... 8
2.1.2 Pruning Date Genesis ... 8
2.2 Materials ... 9
2.2.1 Tea Data ... 9
2.2.2 Temperature Data ... 10
3 Results ... 12
3.1 The Story Demonstrated in the Data ... 12
3.2 From the Past to the Future ... 14
3.3 When the Hypothesis Meets the Reality ... 14
4 Discussion ... 16
4.1 Conclusion ... 19
4.2 Limitation ... 20
4.2.1 Scarcity of Tea Data ... 20
4.2.2 Uncertainty of GDD formula ... 20
4.3 Future Work ... 21
4.3.1 Extensive Collection of Tea Data ... 21
4.3.2 Optimization of GDD model ... 22
4.4 Application ... 22
References ... 24
Figures ... 30
Tables ... 40
Appendixes ... 50
List of Figures
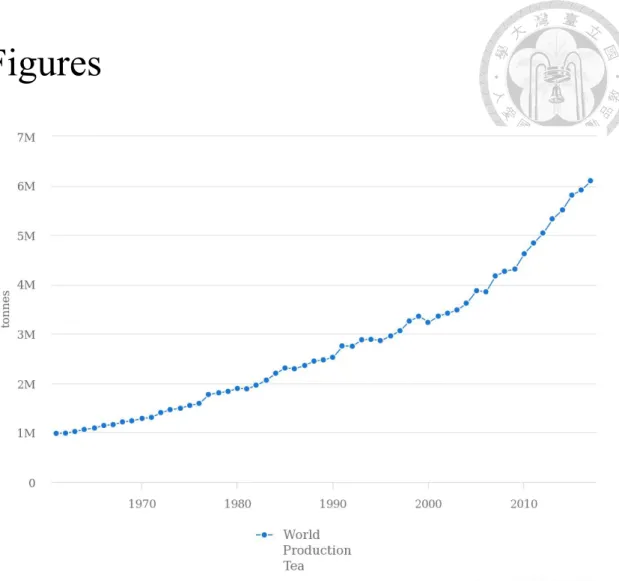
Figure 1. Statistics from FAO: world tea production from 1961 to 2018 (tonnes).
Source: FAO, Food and Agriculture Organization of the United Nations.
http://www.fao.org/faostat/en/#compare. ... 30 Figure 2. The concept frame from climate change, model, to the tea industry. Plotted
by the author. ... 31 Figure 3. The famework of methodology. Plotted by the author... 32 Figure 4. The Tea Map of Taiwan. Original source: Hsieh, Po-Chung; and revised by
the author. ... 33 Figure 5a. Middle: a normal tea bud waiting to expand. Photo taken by Wang, Ruei-
Jyuan in 2018/4/10 in Pinglin. Figure 5b. Left: an inert bud with three terminal- facing leaves; and right: a normal bud. Photo taken by the author in 2019/4/25 in NTU. ... 34 Figure 6. Averaged daily temperature in Taiwan from 1961 to 2000 (baseline). Color
bar: 5℃ (blue) to 25℃ (red). Plotted by the author... 35 Figure 7. The harvest timing of the OTHAIMs of Chin-Shin-Oolong spring Pouchong
tea in 2011 and 2081-2100 (ensemble) with different pruning dates with baseline 1961-2000. Red cross: Mt. Wen; and red circle: Mt. Ali. Color bar: date@ Julian day 50 (blue) to 200+ (red); duration@ 30 (blue) to 120+ (red) days. Plotted by the author. ... 36 Figure 8. The scatter plot for data from Table 5. Plotted by the author. ... 37 Figure 9. The sleet falling on tea trees in the plantation in Pinglin. Photo taken by
Wang, Ruei-Jyuan in 2016/1/24 in Pinglin. ... 38 Figure 10. Averaged monthly precipitation in Taiwan from 1960 to 2012. Colorbar:
100 mm (blue) to 400 mm (red). Plotted by the author. ... 39
List of Tables
Table 1. Pruning dates under experiments in 2011, 2012, and 2013, and assumptions
during 2081-2100... 40
Table 2. Tea data of statistical results from TRES ... 41
Table 3. Tea in Taiwan. ... 42
Table 4. Models in averaged ensemble. ... 43
Table 5. Temperature data from TCCIP. ... 45
Table 6. Harvest day / harvest duration of spring pouching in the OTHAIMs (ensemble) with baseline 1961-2000. ... 46
Table 7. Harvest day / harvest duration of spring pouching in the OTHAIMs (CESM) with baseline 1961-2000. ... 47
Table 8. Harvest timing differences between real experiments and hypothesis in the OTHAIMs at Mt. Wen (Wenshan Division, TRES). ... 48
Table 9. Standardization of the differences between reality and hypothesis by the durations from 2011 to 2013 at Mt. Wen. ... 49
List of Appendixes
Appendix 1. The Sakura Zensen, cherry blossom frontline maps, forecast issued by Japanese corporation in 2019. Source: Weathernews. ... 50 Appendix 2. The harvest dates of the OTHAIMs of Chin-Shin-Oolong spring
Pouchong tea in 2011, 2012, 2013, and 2081-2100 (ensemble) with different pruning dates with baseline 1961-2000. Red cross: Mt. Wen; and red circle: Mt.
Ali. Color bar: Julian day 50 (blue) to 200+ (red). Plotted by the author. ... 51 Appendix 3. The harvest durations of the OTHAIMs of Chin-Shin-Oolong spring
Pouchong tea in 2011, 2012, 2013, and 2081-2100 (ensemble) with different pruning dates with baseline 1961-2000. Red cross: Mt. Wen; and red circle: Mt.
Ali. Color bar: day 30 (blue) to 120+ (red). Plotted by the author. ... 52 Appendix 4. The harvest dates of the OTHAIMs of Jin-Shen spring Pouchong tea in
2011, 2012, 2013, and 2081-2100 (ensemble) with different pruning dates with baseline 1961-2000. Red cross: Mt. Wen; and red circle: Mt. Ali. Color bar:
Julian day 50 (blue) to 200+ (red). Plotted by the author. ... 53 Appendix 5. The harvest durations of the OTHAIMs of Jin-Shen spring Pouchong tea
in 2011, 2012, 2013, and 2081-2100 (ensemble) with different pruning dates with baseline 1961-2000. Red cross: Mt. Wen; and red circle: Mt. Ali. Color bar:
day 30 (blue) to 120+ (red). Plotted by the author... 54 Appendix 6. The harvest dates of the OTHAIMs of Chin-Shin-Oolong spring
Pouchong tea in 2011, 2012, 2013, and 2081-2100 (ensemble) with different pruning dates with baseline 2011-2013. Red cross: Mt. Wen; and red circle: Mt.
Ali. Color bar: Julian day 50 (blue) to 200+ (red). Plotted by the author. ... 55 Appendix 7. The harvest durations of the OTHAIMs of Chin-Shin-Oolong spring
Pouchong tea in 2011, 2012, 2013, and 2081-2100 (ensemble) with different pruning dates with baseline 2011-2013. Red cross: Mt. Wen; and red circle: Mt.
Ali. Color bar: day 30 (blue) to 120+ (red). Plotted by the author. ... 56 Appendix 8. The harvest dates of the OTHAIMs of Jin-Shen spring Pouchong tea in
2011, 2012, 2013, and 2081-2100 (ensemble) with different pruning dates with baseline 2011-2013. Red cross: Mt. Wen; and red circle: Mt. Ali. Color bar:
Julian day 50 (blue) to 200+ (red). Plotted by the author. ... 57 Appendix 9. The harvest durations of the OTHAIMs of Jin-Shen spring Pouchong tea
in 2011, 2012, 2013, and 2081-2100 (ensemble) with different pruning dates with baseline 2011-2013. Red cross: Mt. Wen; and red circle: Mt. Ali. Color bar:
day 30 (blue) to 120+ (red). Plotted by the author... 58 Appendix 10. The harvest dates of the OTHAIMs of Chin-Shin-Oolong spring
Pouchong tea in 2011, 2012, 2013, and 2081-2100 (CESM) with different pruning dates with baseline 1961-2000. Red cross: Mt. Wen; and red circle: Mt.
Ali. Color bar: Julian day 50 (blue) to 200+ (red). Plotted by the author. ... 59 Appendix 11. The harvest durations of the OTHAIMs of Chin-Shin-Oolong spring
Pouchong tea in 2011, 2012, 2013, and 2081-2100 (CESM) with different pruning dates with baseline 1961-2000. Red cross: Mt. Wen; and red circle: Mt.
Ali. Color bar: day 30 (blue) to 120+ (red). Plotted by the author. ... 60 Appendix 12. The harvest dates of the OTHAIMs of Jin-Shen spring Pouchong tea in
2011, 2012, 2013, and 2081-2100 (CESM) with different pruning dates with baseline 1961-2000. Red cross: Mt. Wen; and red circle: Mt. Ali. Color bar:
Julian day 50 (blue) to 200+ (red). Plotted by the author. ... 61 Appendix 13. The harvest durations of the OTHAIMs of Jin-Shen spring Pouchong
tea in 2011, 2012, 2013, and 2081-2100 (CESM) with different pruning dates with baseline 1961-2000. Red cross: Mt. Wen; and red circle: Mt. Ali. Color bar:
day 30 (blue) to 120+ (red). Plotted by the author... 62 Appendix 14. The harvest dates of the OTHAIMs of Chin-Shin-Oolong spring
Pouchong tea in 2011, 2012, 2013, and 2081-2100 (CESM) with different pruning dates with baseline 2011-2013. Red cross: Mt. Wen; and red circle: Mt.
Ali. Color bar: Julian day 50 (blue) to 200+ (red). Plotted by the author. ... 63 Appendix 15. The harvest durations of the OTHAIMs of Chin-Shin-Oolong spring
Pouchong tea in 2011, 2012, 2013, and 2081-2100 (CESM) with different pruning dates with baseline 2011-2013. Red cross: Mt. Wen; and red circle: Mt.
Ali. Color bar: day 30 (blue) to 120+ (red). Plotted by the author. ... 64 Appendix 16. The harvest dates of the OTHAIMs of Jin-Shen spring Pouchong tea in
2011, 2012, 2013, and 2081-2100 (CESM) with different pruning dates with baseline 2011-2013. Red cross: Mt. Wen; and red circle: Mt. Ali. Color bar:
Julian day 50 (blue) to 200+ (red). Plotted by the author. ... 65 Appendix 17. The harvest durations of the OTHAIMs of Jin-Shen spring Pouchong
tea in 2011, 2012, 2013, and 2081-2100 (CESM) with different pruning dates with baseline 2011-2013. Red cross: Mt. Wen; and red circle: Mt. Ali. Color bar:
Appendix 18. Harvest day / harvest duration of spring pouching in the OTHAIMs (ensemble) with baseline 2011-2013. ... 67 Appendix 19. Harvest day / harvest duration of spring pouching in the OTHAIMs
(CESM) with baseline 2011-2013. ... 68
1 Introduction
Tea has had a storied history: being destroyed by Boston Tea Party in Massachusetts in 1773, one of the causes of the Opium War during the middle of the 19th century, and one of the most popular drinks and beneficial economic crops all over the modern world.
Implementations in tea farmlands include planting, weeding, fertilizing, irrigating, pest and disease controlling, pruning, and harvesting. Farmers have to control the budget, manage workforce, and make strategies of manufactural processes and product marketing every season. Therefore, visualized maps of harvest timing of tea may help a public sector or individual farmers with policy and management.
1.1 Tea as An Essential Economic Crop
Tea, or Camellia sinensis (L.) O. Kuntze, is an essential economic crop in agriculture realm. Global tea production has been estimated to exceed 5,000,000 metric tons since 2012 (FAO; Figure 1). The status of tea in the history of Taiwan has been significant 300 years ago. Through Ming Dynasty, Qing Dynasty, Japanese Colonization, to the Republic of China Governance, Taiwan tea has been an essential beverage and involved in the global trade for centuries. Taiwan tea has once become famous throughout the world as “Formosa Oolong Tea”, and tea has become an everyday necessity for Taiwanese in the 21st century nowadays. Taiwanese contribute to not only tea consumption alone but also tea production for inland and international exchange. According to an official report on agriculture, annual tea production reached
19,836 metric tons, yearly output value achieved 3.7 billion New Taiwan dollars, there were approximately 25,000 households of tea farmers, and roughly 90,000 people were employed in the tea industry in Taiwan (Wu, 2003).
1.2 The Three Dimensions in Tea Growth:
Yield, Quality, and Timing
There are three main factors related to the tea production: (1) yield, (2) quality, and (3) timing. Yield is the amount of harvest production. For instance, Sri Lanka’s tea yield was detected by satellites for remote sensing (Samarasinghe, 2003) and by in-situ observation along with statistical methods (Barasuriya, 1999). Squire et al. (1993) reported that tea yields were impacted by the altitude and the temperature of plantation locations in Kenya, whereas Othieno et al. (1992) said that tea yield was influenced by temperature and precipitation. Another factor, quality, is the chemical components within tea leaves. Owuor et al. (2010) analyzed tea quality in Kenya, while Dutta (2013) and Dutta et al. (2011) used satellite data to investigate tea quality in northeast India.
The elevation of carbon dioxide was expected to affect tea quality in model simulations (Li et al., 2017). The other factor, timing, is the duration periods among various phases of growth of fauna or flora, which means the entwined phenology between meteorology and horticulture. The timing of tea is said to be influenced by the temperature under the effect of warming in China by Lou et al. (2015). There are means linking from environmental aspect to plants, and one of them is the concept of the heat unit, heat sum, or say heat accumulation, enlightening the possibility for us to explore the heat
with timing for the tea.
1.3 The Well-known and Widespread Formula: Growing Degree-Day
Since the 1730s, a model has been widely utilized to describe the growth or development of fauna and flora, which is called Growing Degree-Day (GDD) (Anandhi, 2016; McMaster and Wilhelm, 1997; Wang, 1960). It is the heat accumulation concept of fauna and flora to grow from one phase to another, especially used to describe maturation (Cannell and Smith, 1983; Franch et al., 2015; Gordon and Bootsma, 1993;
Perry et al., 1987). However, reading through the literature on models for crops in the world in recent days, the majority of them are related to the yield prediction for food crops like rice, wheat, malt, or corn, the major crops related to the food security and daily consumption (Ceglar et al., 2018; Iizumi et al., 2018; Mäkinen et al., 2018; Toreti et al., 2018). There is a gap between food crops and economic crops, e.g., tea, which
are also very important in our everyday life. And also, the growth and development of tea is rather stable among economic crops. Therefore, in this study, the relationship between the harvest timing of tea with meteorological factor, temperature, mainly influenced by climate change will be evaluated.
1.4 Climate Change as An Adversity for Tea Growth
The suitable environment for tea must meet these criteria: (1) between 38 N and 45
S latitude, (2) 1,800-3,000 mm of annual precipitation, (3) 18-25 ℃ average temperature, (4) 75-80 % average near surface air humidity, (5) 4.5-5.5 soil pH value, and (6) existence of various organism, etc. (TRES, 2016). As discussed in the earlier section, tea has been hugely impacted by climate change, recorded in the literature from Asia, for example, poor tea quality in Japan (Ashardionoa and Cassim, 2014), decreasing tea yield in India (Duncan et al., 2016), less tea yield in Sri Lanka under warming scenarios (Gunathilaka et al., 2017), and earlier germination and harvest dates in China (Lou et al., 2015). Climate change is an environmental phenomenon happening worldwide, resulting in global temperature rising at the rate of 0.74℃ and 1.4℃ during the past 100 years globally and regionally in Taiwan, respectively (Liu, 2015). Climate change has also resulted in extreme weather events such as concentrated heavy rainfall, heatwaves, and droughts. In Taiwan, people are encountering smaller diurnal temperature difference, shorter springs, warmer nights, higher precipitation intensity, and longer arid periods (Chou et al., 2017). Humans have been not only the main driver of climate change but also a victim of it. Nonetheless, agriculture, especially tea industry, is hugely influenced by the rising temperature and extreme weather events such as the abrupt sleet fall in January 2016 all over Taiwan region (UDN Video, 2016), and the unexpected hailfall in April 2018 in southwest Taiwan (NOW News, 2018). These abrupt events might impact the harvest timing and yield of tea.
1.5 The Question: Climate Change v.s.
Harvest Timing of Tea
While shifting of weather patterns can affect the three factors mentioned above for tea production (Ashardionoa and Cassim, 2014; Duncan et al., 2016; Gunathilaka et al., 2017; Lou et al., 2015), climate change is the major global issue perceived in recent decades. With different combination of duration, frequency, and intensity of temperature events, we are encountering smaller diurnal temperature difference, shorter springs, and warmer nights in Taiwan’s scientific report on climate change (Chou et al., 2017). In the study of Lou et al. (2015), harvest periods of Longjing Green Tea in several provinces in China, a region close to Taiwan, are reported to be affected by global warming under the influence of climate change.
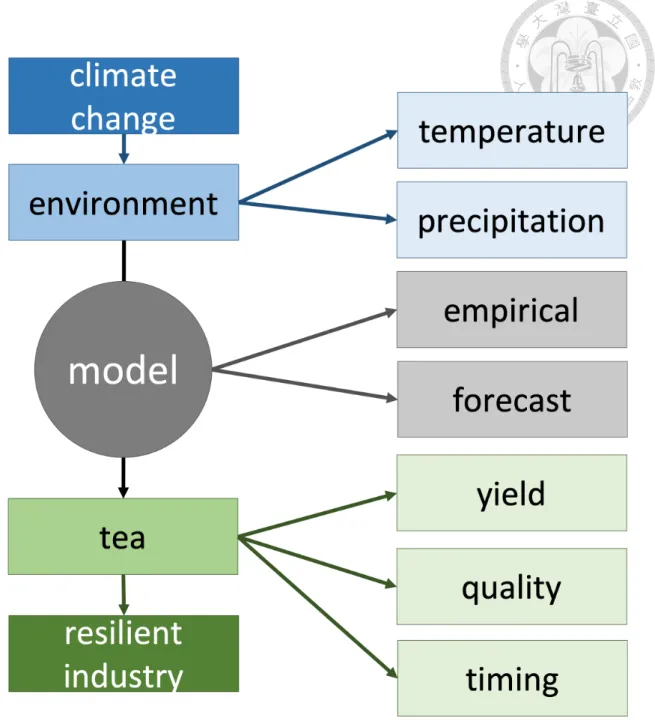
Climate change is an adverse environmental variation, comprising variables differences, i.e., temperature, precipitation, etc. With the support of models, no matter they are empirical ones, e.g., Growing Degree-Day (GDD) formula, or forecasting ones, tea industry can be more resilient under more investigation and management on yield, quality, and timing (Figure 2).
Harvesting is the main timing to reap the tea leaves developed in each season, thus resulting in the major profits for tea farmers. The well-known formula which can represent the relationship between temperature and harvest of tea, Growing Degree- Day (GDD), is utilized in this study. GDD was purported to have been established in the 1730s (Wang, 1960). The use of GDD is widespread all over the world and has been adapted by researchers in the Tea Research and Extension Station (TRES) in Taiwan.
In the study of Lin et al. (2016) from Taiwan, daily temperature data from the Central Weather Bureau (CWB) and tea harvest dates are evaluated and recorded. Researchers
derived some specific numbers of GDD and base temperature for several tea varieties with Pouchong Tea manufacture process by the statistical evaluation method (Yang et al., 1995) in the northern region of Taiwan (Lin et al., 2016). These results contribute
as the background of this application-oriented study for the construction of Optimal Tea HArvest Isochrone Maps (OTHAIMs), the data visualization of evaluation on the effect of climate change on the harvest timing of tea in Taiwan.
2 Methodology
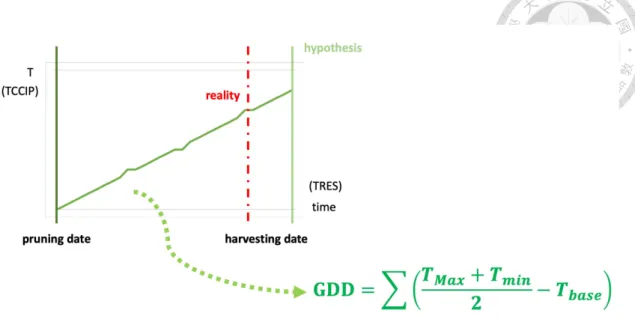
With the aim of visualization of The OTHAIMs, several methods and materials related to the phenology of tea are needed to be combined to estimate for the optimal tea harvest dates by MATLAB (MATrix LABoratory). By coding, temperature files from Taiwan Climate Change Projection and Information Platform (TCCIP) are computed by dates of tea with GDD formula, and plotting the OTHAIMs with the scope of Taiwan region in springs of 2011, 2012, 2013, and 2081-2100. Figure 3 shows the intercoupling relationship within the methodology in this study: with the tea timing data from TRES and temperature data from TCCIP, the harvesting dates in hypothesis can be computed from the pruning dates and compared with the harvesting dates in reality with the linear heat accumulation method, GDD model.
2.1 Methods
Considering the phenology between environmental meteorology and tea physiology, the profound GDD model is incorporated into this study as the main method for data analysis. The genesis of tea harvest development phase is also discussed in the section Methods.
2.1.1 Growing Degree-Day (GDD)
In this study, the well-cited, long-lasting, and original heat accumulation model, GDD formula (Anandhi, 2016; McMaster and Wilhelm, 1997; Wang, 1960), a model dates back to the 1730s, is utilized in order to evaluate the optimal harvest timing of tea with Pouchong Tea manufacture process in the region of Taiwan.
GDD formula features as:
GDD = %(𝑇()*+ 𝑇,-.
2 − 𝑇1)23)
In this formula, different compositions possess different meanings as (1) 𝑇1)23: base temperature, representing the minimum temperature threshold for tea to grow; (2) 𝑇()*: daily maximum temperature; (3) 𝑇,-.: daily minimum temperature; (4)
567895:;<
= : daily average temperature; and (5) GDD: Growing Degree-Day, meaning that the heat accumulation requirement for growth of tea within specific growth phases.
2.1.2 Pruning Date Genesis
In analogy with the genesis beginning at 1 January for heat accumulation of Sakura Zensen, cherry blossom frontline maps, of Japan (Japan Meteorological Agency, 1996;
Appendix 1), the starting points for tea harvest are being experimented on different dates in 2011, 2012, and 2013 from Lin et al. in 2016; therefore, the geneses in 2081- 2100 in the future are thus assumed to be Julian day 30, 40, and 50, approximated into rounded numbers with +/- 10 days (Table 1).
2.2 Materials
Tea and temperature data collected by two official institutes, TRES and TCCIP, in Taiwan are computed with the methods mentioned above in order to acquire The OTHAIMs for the outcomes of this study.
2.2.1 Tea Data
In this research, data of pruning and harvest dates of tea are collected by researchers at the TRES in Taiwan, the former Taiwan Tea Experiment Station (TTES), from tea plantations located in experiment fields inside Wenshan Division. The varieties of tea are Chin-Shin-Oolong, said to be dominating 58% of plantations harvested in Taiwan region in 2011, and TTES No. 12, Jin-Shen (hereafter Jin-Shen) which occupied 14% of area also harvested in Taiwan in 2011. The spatial scope of dates of implementation on tea ranges within several rows of trees, while the temporal scale of data ranges from 2010 to 2013 (Lin et al., 2016; Tables 1 and 2). The materials harvested under Pouchong Tea criteria in the analysis in Lin et al. (2016) are: (1) terminal buds becoming inert buds with the percentage around 70%; (2) the fresh leaves beside the inert buds becoming terminal facing-leaves; (3) one inert bud along with terminal facing three-leaves being plucked, harvested, for making Pouchong tea, light partly-fermented tea (Figure 4 and 5; Table 3; TRES, 1987). The data collected in Lin et al. (2016) are analyzed with Coefficients of Variation (CV) method statistically,
deriving the specific data of 𝑇1)23 and GDD, two numbers possess meanings only in statistical computation (Yang et al., 1995), for Pouchong Chin-Shin-Oolong and Jin- Shen.
2.2.2 Temperature Data
Weather data utilized in this study is obtained from the TCCIP. This weather data set is calculated into grids in order to present the characteristics of the complete spatial scope of a region in Taiwan. The spatial scope of weather data is the whole Taiwan region, and the main focus on weather gridded data is temperature. We used both the present date dataset with the time period from 1960 till 2014, and the downscaled climate change projections under Representative Concentration Pathway 8.5 (RCP8.5) scenarios of model-averaged ensemble, comprising of various conditions listed in Table 4, along with Community Earth System Model 1(CESM1) Community Atmosphere Model 5.1 (CAM5.1) Finite Volume 2 Degree (FV2) simulation from 2081 to 2100.
We want to evaluate the tea harvest timing variation with the most significant warming scenarios under the most extreme estimates and the closer edition to business- as usual pathway, so the RCP 8.5 pathway is chosen. While the ensemble mean is the average of up to 30+ model simulations, CESM-CAM5 is one of the most representative models in Coupled Model Intercomparison Project (CMIP5) released in the Fifth Assessment Report (AR5) by Intergovernmental Panel on Climate Change (IPCC) in 2013. Collier et al. (2018) compared the performance among the climate model established by the National Center for Atmospheric Research (NCAR) from the
United States and other fifteen climate models and they found that NCAR climate model performed comparatively better than other models in terms of several land- surface hydroclimatic variables, including evapotranspiration, runoff, sensible and latent heat fluxes. This is the reason why we select CESM simulation specifically other than the averaged ensemble for further discussion in this study. The resolution of the data collected in the past is represented daily with 1 km gridded, whereas the simulated data is monthly with 5 km gridded (Table 5). These temperature data from TCCIP are utilized because they are the most detailed gridded official temperature data for the Taiwan region.
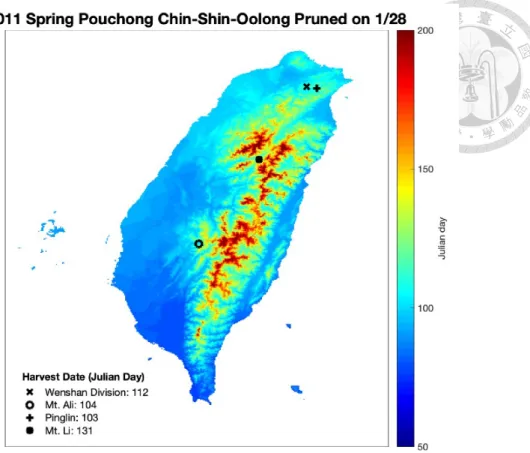
3 Results
The OTHAIMs are constructed for spring tea with Chin-Shin-Oolong and Jin- Shen, the two major varieties planted in Taiwan, of the Pouchong manufacture process for 2011, 2012, 2013, and 2081-2100 in the future. In order to evaluate harvest timing of tea more precisely, the data in the OTHAIMs are extracted from locations of Mt.
Wen (Wenshan Division, TRES) and Mt. Ali, the most famous mountainous region for High Mountain Tea in Taiwan. Figure 6 shows the overall averaged annual temperature in Taiwan from 1961-2000, the time period for the baseline utilized for future simulation in datasets from TCCIP. The figures (Appendixes 2 to 17; Figure 7) are plotted by computing the gridded temperature summations to reach the numbers of GDD with the numbers of 𝑇1)23 excluded for Chin-Shin-Oolong and Jin-Shen (Table 2). The fourth rows in Appendixes 2 to 17 are plotted by future scenarios with a coarser resolution than observations, thus resulting in jag-shaped Taiwan. Note that we show results in Taiwan-wide, but Pouchong light partly-fermented tea may not be produced all over Taiwan. We lack the official statistics of tea records in area harvested for tea plantations in which we can only say that Pouchong Tea is the most popular type of tea in Taiwan.
3.1 The Story Demonstrated in the Data
Appendixes 2, 4, 6, 8, 10, 12, 14, and 16 are the harvest dates in Julian day starting
from January 1st each year for spring Pouchong Tea of Taiwan region with colors ranging gradually from blue (small, 50) to red (large, 200+) for Chin-Shin-Oolong and Jin-Shen separately. Appendixes 3, 5, 7, 9, 11, 13, 15, and 17 are the harvest durations in days also for spring Pouchong Tea of Taiwan region with colors ranging gradually from blue (small, 30) to red (large, 120+) for Chin-Shin-Oolong and Jin-Shen. The graphs in the fourth row in Appendixes 2 to 5 and 10 to 13 are made with the ensemble, the model simulations listed in Table 4 averaged, whereas Appendixes 6 to 9 and 14 to 17 made by one of the models in ensemble, CESM-CAM5. With the shaded colors vary, we can see the harvest dates increase and the harvest durations decrease progressively as the tea pruned later and years elapsed from Appendixes 2 to 17 for both varieties in the whole Taiwan. We can see the harvest dates and durations of both varieties are earlier and shorter in the plains, and later and longer in the mountains in Appendixes 2 to 17, concluding that the timing computed from the temperature follows the altitude and also latitude of the spatial scope of Taiwan. The results of the two varieties are consistent with each other because the results come out with the same manufactural process, Pouchong Tea. Note that one variety can go under different manufacture processes to make different kinds of tea.
On the other hand, when we choose different baselines for warming scenarios in the future, i.e., 1961-2000 (the original baseline to construct the datasets of model simulations from TCCIP) and 2011-2013 (the observational periods discussed in this study), the resulting harvest dates and harvest durations can be slightly different from each other (Appendixes 2 to 19; Figure 7; Tables 6 and 7).
3.2 From the Past to the Future
Locations of Mt. Wen, latitude of 24.954293 °N and longitude of 121.628223 °E, in the northern Taiwan and Mt. Ali, latitude of 23.444624 °N and longitude of 120.759006 °E, in the central Taiwan are the main focus of the harvest timing evaluation as the representatives where Pouchong Tea, the light-fermented tea from Taiwan, are mainly produced (Table 3). There are different experiments on the pruning dates in 2011, 2012, and 2013, and also the geneses of tea growth in 2081-2100 are assumed to be Julian day 30, 40, 50 with the approximation into integers with +/- 10 days. The extracted data from Mt. Wen and Mt. Ali, show several trends: (1) intra- annually, as tea pruned later, the harvest durations shorten; (2) inter-annually, as years elapse, harvest durations shorten as well; (3) Chin-Shin-Oolong needs more heat units to achieve maturation for harvesting than Jin-Shen does because the former is a late- matured variety comparing to the latter mid-matured one (Appendixes 2 to 17; Figure7;
Tables 6 and 7); (4) the resulting findings in this study are consistent with that in the paper published in 2015 by Lou et al. from China related to Longjing Green Tea.
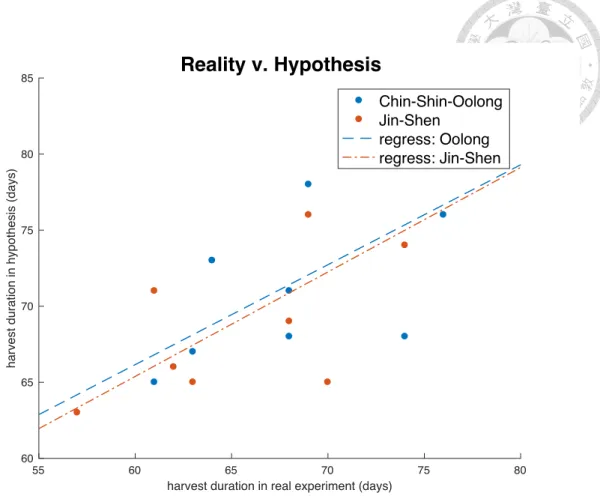
3.3 When the Hypothesis Meets the Reality
Table 8 indicates that the absolute error between optimal hypotheses and the real experiments can range from 5 to 10 days in 2011; 0 to 4 days in 2012; 0 to 6 days in 2013. That is, the uncertainty of the simple and linear GDD model can be as small as 0, or as huge as 10 days, revealing some uncertainties of this model. On the other hand,
when the differences between hypothesis and reality transformed into relative standardized percentage divided by the parameter durations, the error of the OTHAIMs comparing to the real experiments can range from 0 to less than 15% (Table 9).
4 Discussion
With the GDD model and previous results from researchers in TRES (Lin et al., 2016), the results of the OTHAIMs are established, in analogy with Sakura Zensen, cherry blossom blooming frontline map, from Japan (Arakawa, 1955). Here are some issues brought to the surface and worth investigating after the construction of the visualized mapping.
The concept of Sakura Zensen, cherry blossom blooming forecast, from Japan is applied in this study. Although the development between different phases in physiology may be different in different varieties, the concept and process of heat accumulation remain the same. Therefore, despite the realm of tea in this study, the GDD model can also be applied to various species. Moreover, climate change causes an effect of not only daily average temperature elevation but also smaller diurnal temperature difference and larger interannual or seasonal temperature variation, resulting in a variance of the timing of tea growth.
Taken the High Mountain Tea, for example, its high-praised flavor and fragrance are said to be contributed by the fog surrounded the mountains annually. When climate change may cause the foggy weather patterns to transform or even disappear, the quality of High Mountain Tea is deemed to be impacted. Another example is the extreme weather events, e.g., there was a sleet fall event in Pinglin in 2016, an important town for Wenshan-Pouchong Tea (Figure 9). Although the sleet might happen when the tea trees are still within the phase of dormancy before the phase of budbreak at that time,
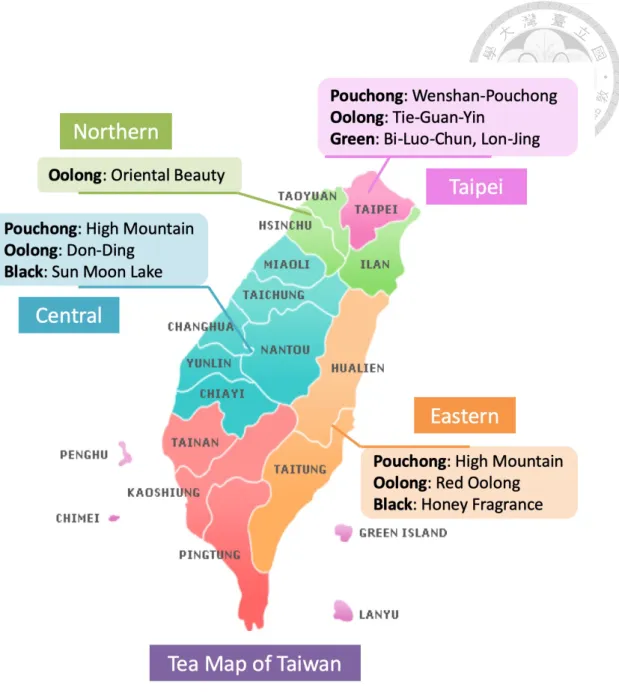
tea trees may be damaged if there is earlier budbreak under warming scenarios. Also, the original weather patterns suitable for many special kinds of tea in different local regions in Taiwan may be different under the ongoing changing climate, e.g., the Green Tea, Oolong Tea, and Pouchong Tea in Taipei region. The Oolong Tea in the northern region which needs the bites from an insect called Jacobiasca formosana, small tea green-leaf hopper, and the Pouchong Tea, Black Tea, and Oolong Tea in the central and eastern region in Figure 4 and Table 3. As a result, the accompanying issues of climate change should be investigated further in detail afterward.
Furthermore, the weather variable mainly considered in this study is temperature.
Nonetheless, there are several other parameters may be helpful if taken into consideration, e.g., precipitation, solar radiation, etc. Precipitation is said to be the most effective element within growing phase of plants or crops, while solar radiation contributes to the photosynthesis in the green leaves. Tea buds are said to break due to temperature; and that tea leaves are said to grow because of precipitation. The variation of precipitation in the future may affect the results of the timing in the mapping of OTHAIMs as well. Moreover, some remote yet large scale climate patterns may affect the weather of Taiwan, e.g., the El Niño Southern Oscillation (ENSO). There is a moderate La Niña happening during 2011-2012, which may result in variances from the ordinary patterns of temperature and precipitation (Figure 10) in Taiwan. On the other hand, the baselines chosen for the temperature datasets of the warming scenarios can also alter the results of mapping (Appendixes 2 to 19; Figures 7; Tables 6 and 7).
In addition, spring tea is the only target discussed in the OTHAIMs because the Pouchong Tea, light partly-fermented tea, manufactured in this season is the major
commodity produced in Taiwan, especially the Wenshan Pouchong Tea in the north and the High Mountain Tea all over Taiwan. Nevertheless, tea is produced also in the summer, autumn, or winter in Taiwan, while spring is the most profitable season in general. When tea can be manufactured in every season for many times, it can also be planted in plains, hills or mountains with different altitudes. Different locations of production may result in various kinds of tea with special features, i.e., Black Tea, Green Tea, or Oolong Tea. The Pouchong Tea mainly discussed in this study refers to the tea manufactured with light fermentation in Taiwan from the definition of the official institute TRES (Table 3; TRES, 1987). Although there are so many tea varieties cultivated by TRES or tea farmers alone, we only target the major two cultivars dominating the biggest percentage of plantation area harvested in Taiwan in this study.
Lastly, as warmer weathers deemed to happen in the upcoming future, it is still not sure if the conditions on tea growth will be better or worse. Due to the uncertainty on the extreme weathers, daily maximal or minimal temperatures are not yet to be predicted. Since then, we need more data on tea (Chen et al., 1991) or meteorology.
The report released in 1991 by Chen et al. recorded tea data from the experimental plantations all over Taiwan region. We do not use the data in this report due to the uncertainty whether these data match the methodology in this study or not. Although not utilized as the base of the OTHAIMs, successors can still investigate and examine this treasured and rare data source to the fullest. The bulletin released by TRES every season is a fine, stable, diversified, and compatible source on tea research from the official institute in Taiwan as well.
As mentioned above, the timing of tea harvest is to be affected while the
accompanied trends of quality and yield are actually unknown. The harvest timing of other tea kinds, Green Tea, Oolong Tea, and Black Tea, located all over Taiwan might be affected into an unexpected situation as well. When the tea farmers all over Taiwan region may manage their plantations with different methods or calendar, the results of OTHAIMs possess some limitations and shall be optimized with more future work for the enhancement of stability.
4.1 Conclusion
With the visualized maps, beholders can see the trend of tea harvest timing variation from the past to the future. Regional warming can result in a decreased duration on the tea harvest. We acquire similar results of climate change influence on tea harvest as Lou et al. (2015) of Longjing Green Tea from China. Also, different pruning dates result in different harvest timing; therefore, the key point of timing evaluation of harvest or not is the genesis of pruning dates, after which the buds begin to grow, implemented by tea farmers. Under the warming scenarios, the budbreak timing can be earlier and the growth phase can be shorter. On the other hand, the harvest duration of the late-matured variety, Chin-Shin-Oolong, is longer than that of the mid- matured variety, Jin-Shen, when they both start from the same pruning date. As for the performance of the GDD model, it can be sometimes stable yet sometimes uncertain.
4.2 Limitation
Although the results and conclusion in this study might seem interesting, there are still some limitations. The data of tea are too scarce and the certainty of the GDD model is questioned after the investigation of this study.
4.2.1 Scarcity of Tea Data
For example, the harvest timing can be different with different manufacture processes among Black Tea, Green Tea, White Tea, Yellow Tea, Oolong Tea, and Pouchong Tea. The criteria of data in Lin et al. (2016) only comes from the manufacturing process, Pouchong Tea, which is a typical kind of light partly-fermented tea mainly produced in Taipei and high-mountain regions, while many other different kinds of tea are produced in different regions in Taiwan. The main reason for this limitation comes from the fact that the amount of data is scarce. The scarcity results in the different pruning date geneses.
4.2.2 Uncertainty of GDD formula
On the other hand, the merit and demerit of GDD formula is its simplicity and linearity despite the fact that GDD is so popular among scholars worldwide. When it comes to abnormal weather or environment conditions such as the changing climate, the stability of GDD may be questioned and challenged.
4.3 Future Work
Corresponding to the limitations mentioned above, several means are listed below to cope with the shortcomings in this study for further studies. In order to deal with the issue of data scarcity, regular and extensive data recording will be the solution, whereas the optimization of GDD formula is to resolve the issue of model uncertainty. As some literatures remained uninvestigated for data related to climate change, successors may refer to the seasonal bulletin and the previous reports released by TRES.
4.3.1 Extensive Collection of Tea Data
First, due to the limitation of tea data scarcity, the regular and extensive tea collection is required to support more tea study in the upcoming future. To be more specific, it is important to collect extensive data of different phases, different altitudes, different seasons, different horticultural traits, major varieties, various manufactural kinds of tea from the experimental plantations all over Taiwan. With the extensive data, the needed Tbase, GDD, or other outputs may, therefore, be derived by statistical evaluation methods. In addition, the two dimensions of yield and quality are also important for the livelihoods of the tea farmers. Therefore, the reliable registration and statistics of tea production for yield, and the detecting systems of chlorophylls and catechins for quality, no matter these elements are at the pre-production or the post- production within the manufacture processes, are all needed at the same time for the
stability and assurance of the tea industry in Taiwan.
4.3.2 Optimization of GDD model
Second, the OTHAIMs may be more applicable with the revision of the GDD model. The changing climate provides the space for successors to revise and refine the model for tea. Due to the temperature issues generated by climate change and the spatial and temporal scope of tea production in Taiwan, the daily, seasonal, annual, or interannual temperature difference may cause variation of results within the heat accumulation model. The preliminarily foreseeable model can include the variables of precipitation, solar radiation, photoperiod, and wind, other than the only element temperature.
4.4 Application
After all, the application of the OTHAIMs may help the government design realistic agricultural policy, then to sponsor more research projects. For the academia, researchers may have more insights into tea harvest, contributing to more knowledge and information altogether. This study provides an effective approach of data visualization for the officials and tea farmers to respond to the circumstances nowadays, alter the existing strategies of management, and also mitigate the prospects in the near future. To sum up, since climate change can influence the harvest timing of tea, the visualization of data, the OTHAIMs, from the past to the future can help boost the
sustainability of the tea industry in Taiwan.
References
Ashardionoa, F and M. Cassim. 2014. “Climate Change Adaptation for Agro-Forestry Industries: Sustainability Challenges in Uji Tea Cultivation.” Procedia
Environmental Sciences 20: 823-831.
Barasuriya, J. 1999. “Shoot population density and shoot weight of clonal tea (Camellia sinensis) at different altitudes in Sri Lanka.” European Journal of Agronomy 11:
123-130.
Cannell M. G. R. and R. I. Smith. 1983. “Thermal Time, Chill Days and Prediction of Budburst in Picea sitchensis.” Journal of Applied Ecology 20(3): 951-963.
Ceglar, A., R. van der Wijngaart, A. de Wit, R. Lecerf, H. Boogaard, L. Seguini, M.
van den Berg, A. Toreti, M. Zampieri, D. Fumagalli, and B. Baruth. 2018.
“Improving WOFOST model to simulate winter wheat phenology in Europe:
Evaluation and effects on yield.” Agricultural Systems.
https://doi.org/10.1016/j.agsy.2018.05.002 Chen, C. S., NOW News, April 23, 2018.
https://www.nownews.com/news/20180423/2740953 (in traditional Chinese;
translated by the author).
Chen, X., M. L. Lin, I. Z. Chen, and X. G. Zeng. 1991. “Investigation of the Influence of Climate Factors on the Growth Period and Tea Quality of Tea Cultivar
Chingshin-Oolong.” Reports on the Studies and Utilization of Agro-Climate Resources in Taiwan Area:1-22 (in traditional Chinese; translated by the author).
(陳玄、林木連、陳右人、曾信光,1991,〈氣候因子對青心烏龍種茶樹生
長週期與茶菁品質之影響調查〉。《臺灣地區農業氣象災害調查與資源應用
研究報告專輯》:1-22。)
Chou, J., W. T. Chen, M. H. Lo, M. A. Li, H. X. Xu, Z. C. Hong, Z. H. Zou, M. M.
Lu, Z. W. Hong, Z. D. Chen, and Z. Z. Zheng. 2017. Climate Change in Taiwan:
Scientific Report 2017 -- Volume 1: Physical Phenomena and Mechanisms: 383-
508 (in traditional Chinese). (周佳、陳維婷、羅敏輝、李明安、許晃雄、
洪志誠、鄒治華、盧孟明、洪致文、陳正達、鄭兆尊,2017,《臺灣氣候變
遷科學報告。第一冊:物理現象與機制》:383-508。)
Collier, N., F. M. Hoffman, D. M. Lawrence, G. Keppel-Aleks, C. D. Koven, W. J.
Riley, M. Mu, and J. T. Randerson. 2018. “The International Land Model Benchmarking (ILAMB) system: design, theory, and implementation.” Journal of Advances in Modeling Earth Systems 10: 2731-2754.
Duncan, J. M. A., S. D. Saikia, N. Gupta and E. M. Biggs. 2016. “Observing climate impacts on tea yield in Assam, India.” Applied Geography 77: 64-71.
Dutta, R. 2013. “Monitoring green leaf tea quality parameters of different TV clones grown in northeast India using satellite data.” Food Chemistry 139: 689-694.
Dutta, R., A. Stein, and Bhagat R.M. 2011. “Integrating satellite images and spectroscopy to measuring green and black tea quality.” Food Chemistry 127: 866- 874.
FAO, Food and Agriculture Organization of the United Nations.
http://www.fao.org/faostat/en/#compare
Franch B., E. F. Vermote, I. Becker-Reshef, M. Claverie, J. Huang, C. Justice and J.
A. Sobrino. 2015. “Improving the timeliness of winter wheat production forecast in the United States of America, Ukraine and China using MODIS data NCAR Growing Degree Day information.” Remote Sensing of Environment 161: 131- 148.
Gordon R. and A. Bootsma. 1993. “Analyses of growing degree-days for agriculture in Atlantic Canada.” Climate Research 3: 169-176.
Gunathilaka, R. P. D., J. C. R. Smart, and C. M. Fleming. 2017. “The impact of
changing climate on perennial crops: the case of tea production in Sri Lanka.”Climatic Change 140: 577–592.
Iizumi, T., Y. Shin, W. Kim, M. Kim, and J. Choi. 2018. “Global crop yield
forecasting using seasonal climate information from a multi-model ensemble.”
Climate Services 11: 13-23.
Japan Meteorological Agency, 1996. “New Flowering Forecast of Cherry Blossom.”
Japan Meteorological Agency Commentary Material No. 24. (in Japanese;
translated by the author). (日本気象庁,1996。〈新しいサクラの開花予
想〉。《気象庁解説資料第24 號》。)
Li, X.., L. Zhang, G. J. Ahammed, Z. X. Li, J. P. Wei, C. Shen, P. Yan, L. P. Zhang, and W. Y. Han. 2017. “Stimulation in primary and secondary metabolism by elevated carbon dioxide alters green tea quality in Camellia sinensis L.” Scientific Reports 7(1):7937.
Lin, Y. H., C. Y. Hu, C. H. Chang, C. N. Lai, I. Z. Chen. 2016. “Establishing a Prediction Model of Tea Harvest Date.” Taiwan Tea Research Bulletin 35:1-20 (in traditional Chinese). (林義豪、胡智益、張振厚、賴正南、陳右人,
2016,〈茶樹產期預測模式之建構〉。《臺灣茶業研究彙報》35:1-20。)
Liu, C. M., 2015. Global Environmental Change (in traditional Chinese).
Lou, W. P., S. L. Sun, L. H. Wu, and K. Sun. 2015. “Effects of climate change on the economic output of the Longjing-43 tea tree, 1972–2013.” International Journal of Biometeorology 59: 593–603.
Mäkinen, H., J. Kaseva, M. Trnka, J. Balek, K.C. Kersebaum, C. Nendel, A. Gobin, J.
E. Olesen, M. Bindi, R. Ferrise, M. Moriondo, A. Rodríguez, M. Ruiz-Ramos, J.
Takáč, P. Bezák, D. Ventrella, F. Ruget, G. Capellades, and H. Kahiluoto. 2018.
“Sensitivity of European wheat to extreme weather.” Field Crops Research 222:
209-217.
McMaster, G. S. and W. W. Wilhelm. 1997. “Growing Degree-Days: One Equation, Two Interpretations.” Agricultural and Forest Meteorology 87: 291-300.
Othieno, C. O., W. Stephens, and M. K. V. Carr. 1992. “Yield variability at the Tea Research Foundation of Kenya.” Agricultural and Forest Meteorology 61: 237- 252.
Owuor, P. O., F. N. Wachira, and W. K. Ngetich. 2010. “Influence of region of production on relative clonal plain tea quality parameters in Kenya.” Food Chemistry 119: 1168-1174.
Perry K. B., S. M. Blankenship and C. R. Unrath. 1987. “Predicting harvest date of delicious and golden delicious apple using heat unit accumulation.” Agriculture and Forest Meteorology 39: 81-88.
Samarasinghe, G. B. 2003. “Growth and yields of Sri Lanka's major crops interpreted from public domain satellites.” Agricultural Water Management 58: 145-157.
Squire, G. R., S. M. O. Obaga, and C. O. Othieno. 1993. “Altitude, temperature and shoot production of tea in the Kenyan Highlands.” Experimental Agriculture 29(1):
107-120.
Toreti, A., A. Maiorano, G. de Sanctis, H. Webber, A. C. Ruane, D. Fumagalli, A.
Ceglar, S. Niemeyer, and M. Zampieri. 2018. “Using reanalysis in crop monitoring and forecasting systems.” Agricultural Systems.
https://doi.org/10.1016/j.agsy.2018.07.001
TRES. 1987. Lectures on Technical Training in Tea Industry: 281-289. Taoyuan County: TRES.
TRES. 2016. Introduction to Tea Industry: 3-2 Environment for Tea Cultivation. Tea Research and Extension Station.
https://www.youtube.com/watch?v=0SaWi1M5j14&feature=youtu.be (in traditional Chinese; translated by the author). (茶業改良場,2016。《茶業入 門篇:3-2 茶樹的栽培環境》。)
Wang, J. Y. 1960. “A Critique of the Heat Unit Approach to Plant Response Studies.”
Ecology 41(4): 785-790.
Wu, G. Y. 2003. “Current Circumstances and Prospects of Taiwan Tea Industry.”
Agricultural Administration and Circumstances 128. Council of Agriculture,
Executive Yuan, R.O.C. https://www.coa.gov.tw/ws.php?id=4354 (in traditional Chinese; translated by the author).
Yang, S. S., J. Logan, and D. L. Coffey. 1995. “Mathematical formulae for calculating the base temperature for growing degree days.” Agricultural and Forest
Meteorology 74: 61-74.
Zheng, C. W., Y. X. Liao, and X. Y. Peng. UDN Video, January 24, 2016.
https://video.udn.com/news/431723?fbclid=IwAR0sXw0Bym8ZCymMTNKVP 39Tz3VYqhrps0JjcegMQ9gJQUk19qKUT5A59W4 (in traditional Chinese;
translated by the author).
Figures
Figure 1. Statistics from FAO: world tea production from 1961 to 2018 (tonnes). Source:
FAO, Food and Agriculture Organization of the United Nations.
http://www.fao.org/faostat/en/#compare.
Figure 2. The concept frame from climate change, model, to the tea industry. Plotted by the author.
Figure 3. The famework of methodology. Plotted by the author.
Figure 4. The Tea Map of Taiwan. Original source: Hsieh, Po-Chung; and revised by the author.
Figure 5a. Middle: a normal tea bud waiting to expand. Photo taken by Wang, Ruei- Jyuan in 2018/4/10 in Pinglin. Figure 5b. Left: an inert bud with three terminal-facing leaves; and right: a normal bud. Photo taken by the author in 2019/4/25 in NTU.
a
b
Figure 6. Averaged daily temperature in Taiwan from 1961 to 2000 (baseline). Color bar: 5℃ (blue) to 25℃ (red). Plotted by the author.
Figure 7. The harvest timing of the OTHAIMs of Chin-Shin-Oolong spring Pouchong tea in 2011 and 2081-2100 (ensemble) with different pruning dates with baseline 1961-2000. Red cross: Mt. Wen; and red circle: Mt. Ali. Color bar: date@ Julian day
Figure 8. The scatter plot for data from Table 5. Plotted by the author.
55 60 65 70 75 80
harvest duration in real experiment (days) 60
65 70 75 80 85
harvest duration in hypothesis (days)
Reality v. Hypothesis
Chin-Shin-Oolong Jin-Shen
regress: Oolong regress: Jin-Shen
Figure 9. The sleet falling on tea trees in the plantation in Pinglin. Photo taken by Wang, Ruei-Jyuan in 2016/1/24 in Pinglin.
Figure 10. Averaged monthly precipitation in Taiwan from 1960 to 2012. Colorbar:
100 mm (blue) to 400 mm (red). Plotted by the author.
1960-2012 Monthly Precipitation in Taiwan
100 150 200 250 300 350 400
mm
Tables
Table 1. Pruning dates under experiments in 2011, 2012, and 2013, and assumptions during 2081-2100.
Year 2011 2012 2013 2081-2100
Date (Julian day)
1/31 (31) 1/31 (31) 1/28 (28) 1/30 (30) 2/11 (42) 2/10 (41) 2/8 (39) 2/9 (40) 2/21 (52) 2/21 (52) 2/19 (50) 2/19 (50) Source: Lin, Yi-Hao, Chih-Yi Hu, Cheng-Hou Chang, Cheng-Nan Lai, Iou-Zen Chen.
2016. “Establishing a Prediction Model of Tea Harvest Date.” Taiwan Tea Research Bulletin 35:1-20.
Table 2. Tea data of statistical results from TRES
Chin-Shin-oolong Jin-Shen
Spring Base temperature (Tbase) 1.8 ℃ 2.2 ℃
Growing degree-day (GDD) 989.1℃ 924.5 ℃
Source: Lin, Yi-Hao, Chih-Yi Hu, Cheng-Hou Chang, Cheng-Nan Lai, Iou-Zen Chen.
2016. “Establishing a Prediction Model of Tea Harvest Date.” Taiwan Tea Research Bulletin 35:1-20.
Table 3. Tea in Taiwan.
Level of fermentation Tea kinds Local tea kinds
Non-fermented 0% Green tea Bi-Luo-Chun (碧螺春)
Lon-Jing (龍井)
Partly-fermented
8-18% Pouchong tea Wenshan-Pouchong (文山包種) High Mountain (高山)
50-60% Oolong tea
Don-Ding (凍頂) Tie-Guan-Yin (鐵觀音) Oriental Beauty (東方美人)
Red Oolong (紅烏龍) Wholly-fermented 100% Black tea Sun Moon Lake (日月潭)
Honey Fragrance (蜜香) Source: TRES. 1987. Lectures on Technical Training in Tea Industry: 281-289. Taoyuan
County: TRES.
Table 4. Models in averaged ensemble.
ACCESS1-0 ACCESS1-3 bcc-csm1-1 bcc-csm1-1-m
BNU-ESM CanESM2
CCSM4 CESM1-BGC CESM1-CAM5 CESM1-CAM5-1-FV2
CMCC-CESM CMCC-CM CMCC-CMS CNRM-CM5 CSIRO-Mk3-6-0
EC-EARTH FGOALS-g2
FIO-ESM GFDL-CM3 GFDL-ESM2G GFDL-ESM2M
GISS-E2-H GISS-E2-H-CC
GISS-E2-R GISS-E2-R-CC HadGEM2-AO HadGEM2-CC HadGEM2-ES
inmcm4 IPSL-CM5A-LR IPSL-CM5A-MR IPSL-CM5B-LR
MIROC-ESM
MIROC-ESM-CHEM MIROC5 MPI-ESM-LR MPI-ESM-MR MRI-CGCM3
MRI-ESM1 NorESM1-M NorESM1-ME Source: TCCIP.
Table 5. Temperature data from TCCIP.
Data Temporal Scale
Spatial
Scale Criteria Remarks
In-situ Tmax,
Tmin
1960- 2014
Taiwan,
1km daily observation
Model
Simulation ∆T 2081-
2100
Taiwan,
5km monthly
AR5 RCP85 CESM- CAM5.1
FV2
Table 6. Harvest day / harvest duration of spring pouching in the OTHAIMs (ensemble) with baseline 1961-2000.
Chin-Shin-Oolong Jin-Shen
Pruning timing:
date (Julian day) Mt. Wen Mt. Ali Mt. Wen Mt. Ali 2011
1/31 (31) 113 / 82 106 / 75 111 / 80 103 / 72 2/11 (42) 120 / 78 114 / 72 118 / 76 112 / 70 2/21 (52) 125 / 73 121 / 69 123 / 71 119 / 67
2012
1/31 (31) 107 / 76 97 / 66 105 / 74 94 / 63 2/10 (41) 112 / 71 104 / 63 110 / 69 102 / 61 2/21 (52) 118 / 67 112 / 61 116 / 65 110 / 59
2013
1/28 (28) 96 / 68 92 / 64 93 / 65 90 / 62 2/8 (39) 107 / 68 103 / 64 105 / 66 100 / 61 2/19 (50) 115 / 65 113 / 63 113 / 63 111 / 61 2081-2100
(ensemble)
1/30 (30) 92 / 62 93 / 63 90 / 60 91 / 61 2/9 (40) 99 / 59 100 / 60 97 / 57 98 / 58 2/19 (50) 107 / 57 108 / 58 105 / 55 106 / 56
Table 7. Harvest day / harvest duration of spring pouching in the OTHAIMs (CESM) with baseline 1961-2000.
Chin-Shin-Oolong Jin-Shen
Pruning timing:
date (Julian day) Mt. Wen Mt. Ali Mt. Wen Mt. Ali 2011
1/31 (31) 113 / 82 106 / 75 111 / 80 103 / 72 2/11 (42) 120 / 78 114 / 72 118 / 76 112 / 70 2/21 (52) 125 / 73 121 / 69 123 / 71 119 / 67
2012
1/31 (31) 107 / 76 97 / 66 105 / 74 94 / 63 2/10 (41) 112 / 71 104 / 63 110 / 69 102 / 61 2/21 (52) 118 / 67 112 / 61 116 / 65 110 / 59
2013
1/28 (28) 96 / 68 92 / 64 93 / 65 90 / 62 2/8 (39) 107 / 68 103 / 64 105 / 66 100 / 61 2/19 (50) 115 / 65 113 / 63 113 / 63 111 / 61 2081-
2100 (CESM)
1/30 (30) 91 / 61 91 / 61 89 / 59 89 / 59 2/9 (40) 98 / 58 99 / 59 96 / 56 97 / 57 2/19 (50) 106 / 56 107 / 57 104 / 54 104 / 54
Table 8. Harvest timing differences between real experiments and hypothesis in the OTHAIMs at Mt. Wen (Wenshan Division, TRES).
Chin-Shin-Oolong Jin-Shen
real hypo diff real hypo diff
2011
1/31 4/18 4/23 +5 4/16 4/21 +5
2/11 4/21 4/30 +9 4/21 4/28 +7
2/21 4/27 5/5 +9 4/24 5/3 +10
2012
1/31 4/16 4/16 0 4/14 4/14 0
2/10 4/18 4/21 +3 4/18 4/19 +1
2/20 4/23 4/27 +4 4/23 4/25 +2
2013
1/28 4/12 4/6 -6 4/8 4/3 -5
2/8 4/17 4/17 0 4/11 4/15 +4
2/19 4/21 4/25 +4 4/17 4/23 +6
Note. 2012 is a leap year, resulting 29 days in February.
Table 9. Standardization of the differences between reality and hypothesis by the durations from 2011 to 2013 at Mt. Wen.
Chin-Shin-Oolong Jin-shen
diff dura diff (%) diff dura diff (%)
1/31 (31) 5 82 6.10 5 80 6.25
2011 2/11 (42) 9 78 11.54 7 76 9.21
2/21 (52) 9 73 12.33 10 71 14.08
1/31 (31) 0 76 0 0 74 0
2012 2/10 (41) 3 71 4.23 1 69 1.45
2/21 (52) 4 67 5.97 2 65 3.08
1/28 (28) -6 68 -8.82 -5 65 -7.69
2013 2/8 (39) 0 68 0 4 66 6.06
2/19 (50) 4 65 6.15 6 63 9.52
Appendixes
Appendix 1. The Sakura Zensen, cherry blossom frontline maps, forecast issued by Japanese corporation in 2019. Source: Weathernews.
Appendix 2. The harvest dates of the OTHAIMs of Chin-Shin-Oolong spring
Pouchong tea in 2011, 2012, 2013, and 2081-2100 (ensemble) with different pruning dates with baseline 1961-2000. Red cross: Mt. Wen; and red circle: Mt. Ali. Color bar:
Julian day 50 (blue) to 200+ (red). Plotted by the author.
Appendix 3. The harvest durations of the OTHAIMs of Chin-Shin-Oolong spring Pouchong tea in 2011, 2012, 2013, and 2081-2100 (ensemble) with different pruning dates with baseline 1961-2000. Red cross: Mt. Wen; and red circle: Mt. Ali. Color bar:
day 30 (blue) to 120+ (red). Plotted by the author.
Appendix 4. The harvest dates of the OTHAIMs of Jin-Shen spring Pouchong tea in 2011, 2012, 2013, and 2081-2100 (ensemble) with different pruning dates with
baseline 1961-2000. Red cross: Mt. Wen; and red circle: Mt. Ali. Color bar: Julian day 50 (blue) to 200+ (red). Plotted by the author.
Appendix 5. The harvest durations of the OTHAIMs of Jin-Shen spring Pouchong tea in 2011, 2012, 2013, and 2081-2100 (ensemble) with different pruning dates with baseline 1961-2000. Red cross: Mt. Wen; and red circle: Mt. Ali. Color bar: day 30 (blue) to 120+ (red). Plotted by the author.
Appendix 6. The harvest dates of the OTHAIMs of Chin-Shin-Oolong spring
Pouchong tea in 2011, 2012, 2013, and 2081-2100 (ensemble) with different pruning dates with baseline 2011-2013. Red cross: Mt. Wen; and red circle: Mt. Ali. Color bar:
Julian day 50 (blue) to 200+ (red). Plotted by the author.
Appendix 7. The harvest durations of the OTHAIMs of Chin-Shin-Oolong spring Pouchong tea in 2011, 2012, 2013, and 2081-2100 (ensemble) with different pruning dates with baseline 2011-2013. Red cross: Mt. Wen; and red circle: Mt. Ali. Color bar:
day 30 (blue) to 120+ (red). Plotted by the author.
Appendix 8. The harvest dates of the OTHAIMs of Jin-Shen spring Pouchong tea in 2011, 2012, 2013, and 2081-2100 (ensemble) with different pruning dates with
baseline 2011-2013. Red cross: Mt. Wen; and red circle: Mt. Ali. Color bar: Julian day 50 (blue) to 200+ (red). Plotted by the author.
Appendix 9. The harvest durations of the OTHAIMs of Jin-Shen spring Pouchong tea in 2011, 2012, 2013, and 2081-2100 (ensemble) with different pruning dates with baseline 2011-2013. Red cross: Mt. Wen; and red circle: Mt. Ali. Color bar: day 30 (blue) to 120+ (red). Plotted by the author.
Appendix 10. The harvest dates of the OTHAIMs of Chin-Shin-Oolong spring Pouchong tea in 2011, 2012, 2013, and 2081-2100 (CESM) with different pruning dates with baseline 1961-2000. Red cross: Mt. Wen; and red circle: Mt. Ali. Color bar:
Julian day 50 (blue) to 200+ (red). Plotted by the author.
Appendix 11. The harvest durations of the OTHAIMs of Chin-Shin-Oolong spring Pouchong tea in 2011, 2012, 2013, and 2081-2100 (CESM) with different pruning dates with baseline 1961-2000. Red cross: Mt. Wen; and red circle: Mt. Ali. Color bar:
day 30 (blue) to 120+ (red). Plotted by the author.
Appendix 12. The harvest dates of the OTHAIMs of Jin-Shen spring Pouchong tea in 2011, 2012, 2013, and 2081-2100 (CESM) with different pruning dates with baseline 1961-2000. Red cross: Mt. Wen; and red circle: Mt. Ali. Color bar: Julian day 50 (blue) to 200+ (red). Plotted by the author.
Appendix 13. The harvest durations of the OTHAIMs of Jin-Shen spring Pouchong tea in 2011, 2012, 2013, and 2081-2100 (CESM) with different pruning dates with baseline 1961-2000. Red cross: Mt. Wen; and red circle: Mt. Ali. Color bar: day 30 (blue) to 120+ (red). Plotted by the author.
Appendix 14. The harvest dates of the OTHAIMs of Chin-Shin-Oolong spring Pouchong tea in 2011, 2012, 2013, and 2081-2100 (CESM) with different pruning dates with baseline 2011-2013. Red cross: Mt. Wen; and red circle: Mt. Ali. Color bar:
Julian day 50 (blue) to 200+ (red). Plotted by the author.
Appendix 15. The harvest durations of the OTHAIMs of Chin-Shin-Oolong spring Pouchong tea in 2011, 2012, 2013, and 2081-2100 (CESM) with different pruning dates with baseline 2011-2013. Red cross: Mt. Wen; and red circle: Mt. Ali. Color bar:
day 30 (blue) to 120+ (red). Plotted by the author.
Appendix 16. The harvest dates of the OTHAIMs of Jin-Shen spring Pouchong tea in 2011, 2012, 2013, and 2081-2100 (CESM) with different pruning dates with baseline 2011-2013. Red cross: Mt. Wen; and red circle: Mt. Ali. Color bar: Julian day 50 (blue) to 200+ (red). Plotted by the author.
Appendix 17. The harvest durations of the OTHAIMs of Jin-Shen spring Pouchong tea in 2011, 2012, 2013, and 2081-2100 (CESM) with different pruning dates with baseline 2011-2013. Red cross: Mt. Wen; and red circle: Mt. Ali. Color bar: day 30 (blue) to 120+ (red). Plotted by the author.