1
103 學年度
休假研究報告書
休假研究計畫名稱:Intangibles Capitalization and the
Buyer-Supplier Relationship
單位:會計系
姓名:楊朝旭
中華民國 104 年 3 月 3 日
2
Intangibles Capitalization and the Buyer-Supplier Relationship 1. Introduction
In recent years, there has been a rising interest in the role that accounting information plays in the buyer-supplier relationships (Kulp 2002; Bowen et al. 1995; Raman and Shahrur 2008; Hui, Klasa and Yeung 2012; Dou, Hope and Thomas 2013). In this study, I investigate whether R&D capitalization can act as a signal of superior but unobservable innovation capability and thus enhance the partnerships between suppliers and buyers in the software industry.1 Software capitalization, the only exception in the United States to the full expensing rule of R&D (SFAS No. 2), pertains to the development component of R&D. I pose the following two questions: Do firms capitalize their software development costs more when they face a more concentrated buyer base? Do firms capitalize their software development costs more when the intensity of relationship-specific investments by actual buyers is higher?
Since supply chain transactions are becoming increasingly distant and international, buyers are more difficult to observe the qualifications of suppliers, which leads to the information asymmetry between buyers and suppliers. In the case of software development, its complexities and inherent uncertainties in requirement or cost estimation as well as performance unobservability exacerbate the information asymmetry problem. Consequently, buyers are faced with adverse selection problem that involve uncertainty about supplier characteristics (Mishra, Heide and Cort 1998). Among various supplier characteristics, intangible assets are believed to be the source of competitive advantage for the supply network (Ulaga and Eggert 2006). Prior research suggests that investments into R&D reflect and influence the level of intangible differences among organizations (Aboody and Lev 2000; Chauvin and Hirschey 1993; Cohen and Levinthal 1990). The software industry is a R&D intensive industry, thus R&D investments comprehensively reflect the extent of difficulty in observing software firms’ capabilities.
Moreira (2005) finds that “the suppliers’ capacity in developing R&D competencies” is the most critical factors that make the development of any technological innovation well succeeded in the supply chain. Since innovation is the most important source of competitive advantage (Barney 1991) and financial performance for the supply-chain as a whole, buyers are eager to understand their suppliers’ innovation capability—an important intangible organizational characteristic. Unfortunately, to protect innovations from expropriation, most firms protect the value of their R&D by keeping their innovations secret (Cohen, Nelson and
1 Software companies are required by SFAS No. 86 to capitalize certain development costs of software to be sold,
leased or otherwise marketed. Capitalization occurs once technological feasibility has been reached and costs are determined to be recoverable.
3
Walsh 2000), which making it difficult for buyers to assess a supplier’s innovative capability. This is consistent with Aboody and Lev’s (2000) argument that R&D investments create information asymmetries.
One solution to the resulting asymmetric information problem may be provided by financial reporting information. R&D capitalization can play an informational role by communicating favorable prospects. Wyatt’s (2005) empirical results suggest that management's choice to recognize intangible assets is associated with underlying economic attributes. Moreover, she also indicate that firms with incentives to report intangible assets would be those with intangible assets that management expects will lead to superior, future performance. Consistent with this argument, Kimbrough (2007) shows that financial statement recognition of R&D capital is a useful mechanism to reveal private information about firms' R&D activities to investors and in turn increase the degree to which equity values impound the estimated fair values of R&D. Thus, I argue that recording of unobservable intangible assets could signal expected growth to buyers and help differentiate the firm from lower quality firms (e.g., Leland and Pyle 1977; Hughes 1986; Wyatt 2005).
2. Literature Review
2.1 Accounting information and the buyer-supplier relationships
In light of the fact that firms are increasingly interconnected with supply-chain-models of competition, accounting scholars are increasing concerned with how a firm’s powerful suppliers and customers are associated with its accounting practices. For example, recognizing the importance of stakeholders to accounting decisions, Bowen et al. (1995) find that stakeholders’ implicit claims affect firms’ choice of income-increasing accounting methods. Similarly, Raman and Shahrur (2008) find that the firm’s earnings management is higher if it operates in environments where relationship-specific investments by its suppliers and customers are more prevalent. In light of the information asymmetry problem and stakeholders’ asymmetric payoffs with respect to the firm’s performance, Hui, Klasa and Yeung (2012) argue that a firm’s powerful suppliers and customers are associated with its accounting practices. Consistent with this argument, they find that when a firm’s suppliers or customers have greater bargaining power, the firm recognizes losses more quickly (i.e. more accounting conservatism). Arya, Mittendorf and Yoon (2014) shows that input procurement from an outsider serves to provide suppliers a credible signal of the firm’s profitability information and strategic positioning, and this phenomena is more pronounced the more accurate the firm’s accounting system. Dou, Hope and Thomas (2013) show that firms engage in income smoothing to send a signal of their willingness to fulfill implicit claims and
4
maintain long-term relationships to their suppliers. Using a sample of long-term supply contracts collected from SEC filings, Costello (2013) shows that holdup concerns and information asymmetry are important determinants of contract design. Asymmetric information between buyers and suppliers leads to shorter term contracts. However, when longer duration contracts facilitate the exchange of relationship specific assets, the parties substitute short-term contracts with financial covenants in order to reduce moral hazard. Taken together, investigating the accounting issues in the buyer-supplier-relationship context is a promising emerging research field.
2.2 Introduction of FASB Statement No. 86
Modern companies consist of an increasing amount of intangible assets. However, the accounting treatment for intangible assets is probably the most controversial issue. In fact, intangibles-rich companies have indeed higher upside earnings potential, but they also have higher downside risk compared to other firms (Chung and Charoenwong 1991). The high uncertainty of the future benefits of R&D (Kothari, Laguerre and Leone 2002) impedes managers from providing reliable information about these benefits. Sharing this view, the U.S. GAAP requires an immediate expensing rule for all R&D spending except for software development costs for which technological feasibility has been established (SFAS No. 2).
In the U.S., Financial Accounting Standard Board (FASB) mandates that all R&D expenditures must be expensed immediately as incurred (SFAS 2: Accounting for Research
and Development), except of the accounting treatment of computer software (SFAS 86: Accounting for the Costs of Computer Software to be Sold, Leased, or Otherwise Marketed).
Statement No. 86 was issued by the Financial Accounting Standards Board (FASB) in 1985.2 SFAS 86 provides guidance for the accounting of software to be sold, leased, or otherwise marketed. This statement supersedes SFAS 2 for software development costs. It requires the capitalization of software development costs when the products’ technological feasibility been established. Technological feasibility is established when the firm has the necessary skills and hardware and software technology to produce the product. Unamortized computer software costs that have been capitalized are reported at net realizable value and costs that have been written down are charged to income and are not to be restored in any future period.
FASB Statement No. 86 breaks spending on software development into the following three stages: (1) Research & Development costs; (2) Software development costs once technological feasibility is established; and (3) Costs incurred once the product is available for
2 Financial Accounting Standards Board, SFAS No. 86, Accounting for the Costs of Computer Software to Be
5
general sale to customers. Costs incurred in the first and third stages are expensed as incurred. Costs in the second stage are capitalized. Once technological feasibility has been reached – but before general release to customers – all costs associated with bringing the product to market are eligible for capitalization. According to FASB statement No. 86, technological feasibility
“… is established when the enterprise has completed all planning, designing, coding, and
testing activities that are necessary to establish that the product can be produced to meet its design specifications including functions, features, and technical performance requirements.” In complying with FASB Statement No. 86, management must make an important judgment concerning technological feasibility of its software products. This decision affects at what point the company will begin to capitalize its software development costs. Aboody and Lev (1998) report evidence in favor of capitalization of software development costs for their sample of U.S. firms.
2.3 Signaling theory
As mentioned above, there exist information asymmetries between buyers and suppliers/contractors in the software industry. In such a buyer-supplier-relationship setting, this study extends signaling theory to research on R&D capitalization. Signalling refers to activities by which the effects of informational asymmetries can be reduced. Signalling was first formulated as part of economic theory by Spence (1973; 1974). A customer's inability to ascertain a supplier's inherent skills represents an "adverse selection" problem (Akerlof 1970). That is, suppliers without the skills required to provide certain quality levels might misrepresent themselves by making false quality claims (Eisenhardt 1989). The extant literature has identified that adverse selection problems could be resolved by signals designed to reveal parties' private information about their inherent characteristics. For example, non-salvageable investments (such as signs and logos) that serve as a customer bond or hostage (Milgrom and Roberts 1986) could serve this purpose.
Software suppliers’ underlying quality attributes often are complex, embedded, and thus difficult for buyers to observe. As such, buyers often have difficulties identifying (ex-ante) suppliers that provide consistent software quality. Especially, a central difficulty in supply chain interactions is the identification of software suppliers with high innovation capability. Consistent with prior research (e.g., Montgomery and Wernerfelt 1992), I expect that a buyer's information problems are managed by signals. The need for information about underlying supplier attributes lends further credence to the idea that R&D capitalization may act as a market signal.
6
because of information asymmetry. Deloof and Jegers (1996) suggest that firms with greater R&D expenses produce high-tech goods for which product quality is difficult to determine. Software firms are R&D intensive (Aboody and Lev 1998) and they thus will have a greater need to capitalize their development costs to signal quality. Capitalizing R&D has been proposed to reduce information asymmetry (Aboody and Lev 2000; Boone and Raman 2001). When firms capitalize R&D they convey information to the market about the success of these activities, which in turn affects investors' beliefs about R&D future payoffs, resulting in a reduction in information asymmetry. Aboody and Lev (1998) demonstrate the relevance to investors of information on the capitalization of software development costs, in accordance with the Financial Accounting Standards Board's Statement No. 86 (SFAS No. 86). The benefit of using R&D capitalization to lessen asymmetric information regarding the quality of products will be promising in the software industry. Signaling theory lends support to the idea that a supplier’s recognition of R&D assets could be a signal to buyers that the supplier has high innovation capability that is beneficial for them. For example, a supplier’s innovation capability can help buying companies achieve rapid innovation3 and bring success on business performance.
Note that there exists direct evidence showing that capitalizers use R&D capitalization to manage earnings. Percy (2000) finds that information asymmetry and agency costs provide incentives for managers to discretionarily capitalize R&D expenditures. Oswald and Zarowin (2007) demonstrate that capitalizers change the percentage of expenditures capitalized to meet earnings benchmarks. Using Italian listed companies as the sample, Markarian et al. (2008) find that companies tend to use R&D capitalization for earnings-smoothing purposes. Moreover, Thi, Kang and Schultze (2009) find that German firms capitalize R&D investment to avoid violating debt covenants. Finally, Landry and Callimaci (2003) also indicate that Canadian firms use the decision which capitalize or expense R&D spending as an earning management tool to either meet debt covenants or to smooth income. When market participants are wary of earnings management, capitalization of R&D expenditure can be perceived as bad news (Chan, Faff, Gharghori and Ho 2007). These prior studies neglect the existence of key stakeholders. In the supply chain context, I argue that the signals delivered from R&D capitalization are credible. I explain this point as follows. Hui, Klasa and Yeung (2012) suggest that like creditors, a firm’s suppliers and customers should prefer it to recognize bad news more quickly than good news (i.e., reporting more conservatively) as they could incur significant costs if the firm went out of business, but potentially gain little from the firm performing above expected levels. Their empirical results do support this prediction. If this is the case, I argue that the signals delivered from R&D capitalization in the supply
3 Bell (2009) suggests that interaction with suppliers and other partners may become important source of
7
chain setting will have strong credibility. R&D capitalization is a less conservative way of accounting treatment to R&D expenditures, which thus would be more stringently monitored and assessed by the firm’s stakeholders. In this sense, firms that “dare” to capitalize their R&D expenditures should be those having strong belief that their R&D efforts will be successful in the end.
3. Research Methods
3.1 Hypothesis development
In this study, I examine whether buyer-related factors play a role in determining the extent of supplier firms’ accounting decision as to capitalize software development costs.
Since supply chain transactions are becoming increasingly distant and international, buyers are more difficult to observe the qualifications of suppliers, which leads to the information asymmetry between buyers and suppliers. In the case of software development, its complexities and inherent uncertainties in requirement or cost estimation as well as performance unobservability exacerbate the information asymmetry problem. In this setting, I argue that signaling through R&D capitalization could serve as a mechanism to mitigate the information asymmetry problem.
Due to factors such as the ever-increasing volatility in the software marketplace, the heightened level of competition and the divergence of technology platforms, and the compression of product cycles, realization of benefits from software R&D investments has become increasingly uncertain. SFAS No. 86 conditions capitalization on the technological aspects of software development. For example, the "product design" or a "working model" must be completed prior to capitalization. An asset should be recognized in the financial statement only if ultimate realization of the asset is reasonably assured. Therefore, capitalization of software development costs is a useful predictive factor of future product sales. Prior literature has documented capitalization is informative about the success of software development programs. Aboody and Lev (1998) find that annually capitalized development costs are positively associated with stock returns and the cumulative software asset reported on the balance sheet is associated with stock prices. Furthermore, software capitalization data are associated with subsequent reported earnings, indicating another dimension of relevance to investors. Moreover, Mohd (2005) finds that information asymmetry is significantly lower for firms that capitalize (capitalizers) than for those who expense (expensers) software development costs within the software industry. As well, investors' uncertainty about the future benefits of software development costs is reduced when firms capitalize these costs. Based on this line of literature, firms can use R&D capitalization
8
to better inform their buyers, and thus help them distinguish good-quality from poor-quality supplier firms.
To the extent that R&D capitalization reveals information about intangible supplier differences, it should provide a greater return for supplier firms with more concentrated buyer base or those with their buyers investing more relationship-specific investments. These two effects are delineated as follows and the two hypotheses are then developed.
3.1.1 Stakeholders’ bargaining power and accounting practices
Buyer-supplier relationships are often characterized by considerable power asymmetries. Especially, relationships with major customers are conventionally considered to have a negative impact on supplier firm performance (for example, see Etgar 1976; Galbraith and Stiles 1983; Kelly and Gosman 2000). The reasons include that major customers pressure their dependent suppliers to provide concessions such as lowering prices, extending trade credit, and carrying extra inventory (e.g., Galbraith 1952; Scherer 1970; Porter 1974). Buyer power is generally derived from the dependence of the supplier on the buyer. Using buyer concentration to proxy for the supplier’s dependence on the buyer, the evidence of prior studies suggests that increased buyer concentration leads to lower supplier profitability. For example, Gosman and Kohlbeck (2009) investigate how buyer power in the retail market affects suppliers' profitability. They find that as sales to major customers increase, supplier gross margins and return on assets decrease while their inventory and payables management improves. Patatoukas (2012) documents those suppliers with more concentrated customer bases report lower gross margins although they tend to be more profitable on the whole. In summary, suppliers partially compensate for the adverse gross margin consequences by carrying less inventory and extending payment periods to their suppliers. Contrast to prior research only emphasizes the impact of customer power on supplier gross margins, this current study tries to understand whether downstream bargaining power is associated with higher upstream R&D capitalizations.
Moreira (2005) finds that “the suppliers’ capacity in developing R&D competencies” is the most critical factors that make the development of any technological innovation well succeeded in the supply chain. It is important to let your partners know what you can do and contribute to the whole supply-chain network. Communicating through “words of mouth” is less convincing than capitalizing an asset in the financial statements. The reasons are that, first, the capitalization figure is verified by external public auditors and, second, any earnings inflation through intentional manipulation of R&D capitalization could be costly because intangible assets are subject to impairment accounting. Thus, when supplier firms are
9
vulnerable to the exercise of power by the more powerful buyer firm, they may tend to capitalize their R&D expenditures. By doing so, supplier firms enhance the buyer perceived innovation capability, which gives them countervailing power relative to powerful buyers. Buyer firms will find it more difficult to squeeze suppliers when innovative suppliers have greater bargaining power or when buyer firms rely on innovative suppliers for specialized inputs.
Moreover, suppliers and customers involved in long-term transactions with a firm will consider its accounting performance when evaluating the risk that the firm might experience financial distress and no longer honor their implicit claims (Raman and Shahrur 2008).4 Capitalization can boost current year profits and operating cash flow.5 Given the importance of operating cash flow to assessments of financial performance and valuation, capitalization of software development costs can thus shed a more favorable light on a company's financial performance. Most important of all, through R&D capitalization to better inform buyers about their intangibles performance and healthy operating performance, supplier firms regain some power in the buyer-supplier relationship. Based on the discussions above, I propose the following hypothesis 1:
H1: (Bargaining Power Hypothesis) The rate at which a supplier capitalizes software
development costsis positively associated with the extent to which its buyer-base is more
concentrated.
3.1.2 Stakeholders’ relationship-specific investments and the capitalization decisions
The software firm’s dealings in the input and output markets often entail relationship-specific investments by its suppliers and customers (Gorgoglione and Roselli 1997).6 For example, software companies invest in R&D to develop software products that work within a specific operating system developed by a particular firm such as Apple
4 Raman and Shahrur (2008) find that earnings management is used opportunistically to influence the perception
of suppliers/customers about the firm’s prospects.
5 Since most companies that capitalize software development costs report such expenditures as an investing use
of cash, capitalization has the effect of boosting operating cash flow. Even in a "steady state," where the amortization of previously capitalized software development costs are equal to new amounts capitalized such that earnings do not benefit from capitalization, operating cash flow is boosted through the shift of capitalized software costs to the investing section of the statement of cash flows.
6 Gorgoglione and Roselli (1997) suggest that object-oriented software technology (OOT) features the high
modularity of the applications and reusability of components, which makes standardization and specialization possible and would make the software development similar to a manufacturing process. The new client-supplier relationships lead to high level of relationship-specific investments by both suppliers and buyers. For example, assume that a class user (CU) needs the supply of a certain class of graphical interface units for the Macintosh operating system. The CU will likely propose it to one of its strategic suppliers specialized in the production of graphical interface units. If the class producer (CP) has so far produced this applications for MS Windows, it has to switch from a technology to another in conditions of uncertainty about the new supply contract duration.
10
Computers (Milgrom and Roberts 1992). Since these investments are specialized to the firm, their value to the customers and suppliers depends on the future prospects of the business relationship with the firm. There are two reasons for this argument. First, when the firm’s future prospects are more favorable, the size of future transactions between buyers and the firm could be higher, which increases the buyers’ expected return from the relationship-specific investments. Second, the buyer’s investment will lose value if the supplier firm goes out of business; or if the supplier firm reneges on the terms of trade, which is more likely when the firm’s future prospects worsen. Consequently, the perception of these stakeholders about the firm’s business prospects affects their incentive to undertake such investments. If a supplier’s R&D capitalization helps the firm influence its stakeholders, then the characteristics of the relationship between a firm and its suppliers and customers should affect the intangibles capitalization decision.
A firm’s corporate suppliers and customers use its accounting performance to gauge its underlying economic performance (Hui, Klasa and Yeung 2012), which help these stakeholders assess whether it can meet its short-term trading obligations, its long-term financial viability and the risk of making relationship-specific investments. Raman and Shahrur (2008) identify that earnings management is a tool to deliver positive signals about the firm’s prospect. They find that the intensity of relationship-specific investments by suppliers/customers is positively associated with the magnitude of earnings management. In turn, earnings management by the firm in one period is positively related to the magnitude of R&D investments by suppliers and customers in the next period. In contrast to Raman and Shahrur (2008), I argue that R&D capitalization is a more promising way of signaling in the buyer-supplier network with a high research-intensity.
Prior literature has shown that a better flow of information is especially important in the presence of relationship-specific investments because it helps buyers better assess the risk of investing in specialized assets (Baiman and Rajan 2002). Understanding the stakeholders’ concerns of the risks associated with relationship-specific investments, I argue that suppliers have an incentive to deliver signals about its good prospects through R&D capitalization. Through this signaling activity, the supplier firm could benefit from being perceived by buyers as having high innovation capability to flourish the supply chain as a whole and having good future prospects that deserves buyers investing relationship-specific assets.
Moreover, Banerjee and Duflo (2000) find that reputational concerns of the contracting parties mitigate the incentive problems arising from simple contracts in the Indian software industry. Seybert (2010) suggests that CEOs have reputational concerns when they capitalize R&D expenditures. As such, R&D capitalization could serve as an insurance mechanism that
11
allows stakeholders being more rest assured about their returns on relationship-specific investments.
Note that managers may opportunistically use accounting discretion to window-dress financial report. The evidence in Bowen et al. (1995) suggests that firms use accounting discretion to increase reported income when stakeholders’ implicit claims are high. Raman and Shahrur (2008) also find that the firm’s earnings management is higher if it operates in environments where relationship-specific investments by its suppliers and customers are more prevalent. Consistent with this line of reasoning, I argue that R&D capitalization leads to higher earnings number that could favorably influence the perception of buyers about the firm’s future prospects. Thus, irrespective of whether capitalization plays an informational role or an opportunistic role, the supplier firm’s capitalization rate of software development costs is higher if buyers investment more in relationship-specific assets.7
I use the R&D investments undertaken by customers as a measure of relationship-specific investments that are specific to their relationship with the supplier firm. I therefore summarize the preceding discussions with the following hypothesis:
H2: (Relationship-specific Investment Hypothesis) The greater the level of the buyer’s R&D investments, the greater the supplier's capitalization for development costs will be.
3.2 Data
The data used in this study comes from the annual financial statement filings made between 2001 and 2012 for identifiable software companies classified as computer programming and prepackaged software (SIC codes 7370-7372), for which I can identify the firm’s actual key customers. The software industry is the only industry that US GAAP allows to capitalize R&D costs. The software industry is a R&D intensive industry. Armour and Teece (1980) suggest that vertical chains that are R&D intensive are likely to have complex inter-stage interdependencies.
I exclude companies from the study if I am unable to determine capitalization rates for software development from available disclosures. This generally happened when companies combined their reporting of internally developed software and purchased software and there
7 With regard to the debate on the “signaling” vs. “earnings management” role of discretionary R&D
capitalization, extant single-country evidence (Abrahams and Sidhu 1998; Ahmed and Falk 2006; Ang, Church and Feng 2008; Green, Stark and Thomas 1996; Oswald and Zarowin 2007a; Callimaci and Landry 2004; Choi 1994; Cho and Chung 2001; Han and Manry 2004), and cross-country evidence (Smith, Percy and Richardson 2001) generally support the view that the discretionary capitalization of development costs plays a potentially useful “signaling” role in the prospect of R&D investment.
12
was no reliable way to separate them. Moreover, I exclude firms without required data available. I collect this data from Compustat’s Segment Tapes for 2001-2012.
Because Compustat generally aggregates the capitalized software asset with other assets and includes the related amortization with cost of sales, I need to obtain the financial statements of the sample companies from Laser Disclosure and Lexis/Nexis databases. I collect the following data: net capitalized software asset, the annual software development expense, the annual capitalized software amount, the annual amortization of the software asset, and the occasional write-offs of capitalized software.
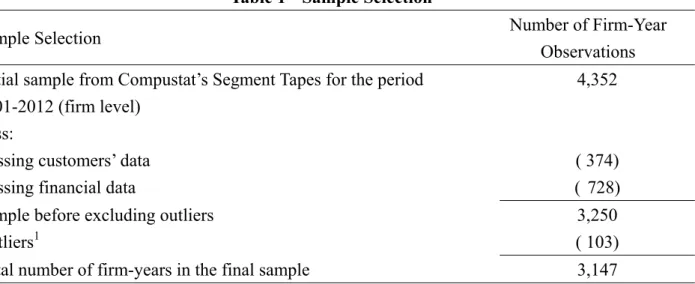
I examine hypotheses using this hand-collected database of publicly held suppliers that identify major customers. The collection of buyer-supplier relationships is based on FASB’s and SEC’s requirements that public firms disclose the amount of revenue derived from each major customer. In accordance with SFAS Nos. 14 and 131, public firms have to disclose the identity of any customer whose purchases represent more than 10 percent of the firm’s total revenues. This information is available in the Compustat Segment Files. The Compustat Segment Files provide the type and name of a major customer along with the dollar amount of annual revenues generated from each major customer. This dataset then merged with the aforementioned capitalization data. As shown in Table 1, the final sample used to run the tests includes 3147 observations.
Table 1 Sample Selection
Sample Selection Number of Firm-Year
Observations Initial sample from Compustat’s Segment Tapes for the period
2001-2012 (firm level)
4,352
Less:
Missing customers’ data ( 374)
Missing financial data ( 728)
Sample before excluding outliers 3,250
Outliers1 ( 103)
Total number of firm-years in the final sample 3,147
1 The observations with the absolute value of studentized residual from regression greater than two
are deleted for mitigating the outliers (Belsley et al. 1980).
13
I use the following model to test H1 and H2:
2011 0 1 2 3 4 2001 5 6 7 1 _ int it Y it it it it it Y it it it it
CAPVAL YR BBC RSI Buyer LNAT X
Dev Leverage CAPVAL
(1)Variable definitions: CAPVAL is the annually capitalized development cost divided by year-end market value (zero for "expensers"). Following Patatoukas (2012), I use buyer-base concentration (BBC) to proxy buyers’ bargaining power. Firm i’s buyer-base concentration (BBC) in year t measured across the firm’s J major buyers, as described below:
2 1 ( ) , J ijt it j it Sales BBC Sales
where Salesijt represents firm i’s sales to buyer j in year t and Salesit represents firm i’s
total sales in year t. In essence, BBC is an application of the Herfindahl-Hirschman index, capturing two elements of diversification—namely, the number of major buyers with which the firm interacts and the relative importance of each major buyer in the firm’s annual revenue.
BBC ranges between 0 and 1, where lower values correspond to less concentrated buyer bases
and vice versa. According to H1, I expect the coefficient on BBC (1) to be positive, indicating that when firms face buyers with strong bargaining power, they are more likely to capitalize software development costs to signal their innovation capability and good future prospects. Following Raman and Shahrur (2008), I use the R&D intensity of the firm’s actual buyers to capture the presence of relationship-specific investments by buyers. Some of the R&D investments undertaken by suppliers and customers can be specific to their relationship with the firm. For example, software companies invest in R&D to develop software products designed for a particular business or that work within a specific operating system developed by a particular firm such as Apple Computers (Milgrom and Roberts 1992). I construct the R&D intensity of the firm’s key customers as follows:
RSI_Buyer (measured by Key Buyers R&D) =
1
& * n
j j
j
Key Buyer R D Buyer Percentage Sold
where n is the number of buyers, Key Buyer R&Dj is equal to the R&D expense (scaled by
assets) of the jth buyer, and Buyer Percentage Soldj is the percentage of the firm’s sales to the jth buyer. According to H2, I expect the coefficient on RSI_Buyer (2) to be positive,
14
intention to capitalize software development costs to signal their innovation capability and good future prospects.
LNAT (size) is the log of total assets. X (profitability) is net income plus the annual
software amortization minus the annual capitalized software (that is, earnings under full expensing) divided by equity. Devint (development intensity) is the annual software development costs (capitalized software development plus software development expense) divided by sales. Leverage is the long-term debt divided by equity (minus the software asset). I also use the lagged dependent variable (CAPVALt-1) in the regression model to control some
unobserved factors that affect a firm’s R&D capitalization decision.
The following section explains the predicted signs of the control variables. Large firms are expected to expense a larger share of development costs than smaller firms because they tend to spend a substantial part of software development costs on basic research and on maintenance and upgrades of their products, which are required to be expensed according to
SFAS No. 86. As to software development intensity (Devint), I expect a positive association
between development intensity and capitalization rate, since firms that spend more on software development will experience, on average, a higher success rate in developing products, leading to a larger capitalization share. Profitability (X) is expected to be negatively associated with capitalization in light of the fact that profitable companies may avoid capitalization in order not to taint the perceived quality of their earnings in analysts' eyes. Firms closer to loan restrictions may favor capitalization which increases equity and earnings, therefore, the coefficient on Leverage is expected to be positive.
15 Variable Definitions Variables Predicted Sign Definitions Dependent Variable
CAPVAL The annually capitalized development cost divided by year-end market value (zero for "expensers").
Independent Variable
BBC +
The proxy variable of buyers’ bargaining power, which is
measured by 2 1 ( ) J ijt it j it Sales BBC Sales
. Salesijt represents firm i’ssales to buyer j in year t and Salesit represents firm i’s total
sales in year t.
RSI_Buyer +
The R&D intensity of the firm’s key customers, which is measured by 1 & * n j j j
Key Buyer R D Buyer Percentage Sold
.n is the number of buyers, Key Buyer R&Dj is equal to the
R&D expense (scaled by assets) of the jth buyer, and Buyer
Percentage Soldj is the percentage of the firm’s sales to the jth
buyer. Control Variables
LNTA - The log of total assets.
X -
Net income plus the annual software amortization minus the annual capitalized software (that is, earnings under full expensing) divided by equity.
Devint +
The annual software development costs (capitalized software development plus software development expense) divided by sales.
Leverage + The long-term debt divided by equity (minus the software
asset)
16
4. Results and Disscussions
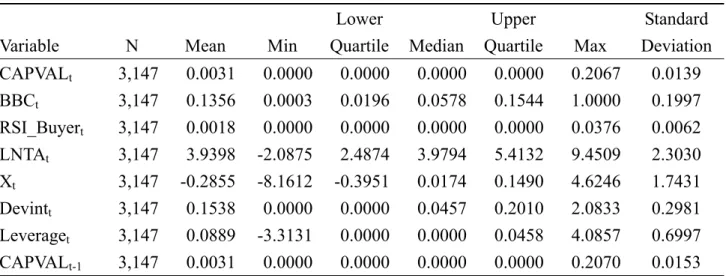
Table 2 Descriptive Statistics
Variable N Mean Min
Lower Quartile Median Upper Quartile Max Standard Deviation CAPVALt 3,147 0.0031 0.0000 0.0000 0.0000 0.0000 0.2067 0.0139 BBCt 3,147 0.1356 0.0003 0.0196 0.0578 0.1544 1.0000 0.1997 RSI_Buyert 3,147 0.0018 0.0000 0.0000 0.0000 0.0000 0.0376 0.0062 LNTAt 3,147 3.9398 -2.0875 2.4874 3.9794 5.4132 9.4509 2.3030 Xt 3,147 -0.2855 -8.1612 -0.3951 0.0174 0.1490 4.6246 1.7431 Devintt 3,147 0.1538 0.0000 0.0000 0.0457 0.2010 2.0833 0.2981 Leveraget 3,147 0.0889 -3.3131 0.0000 0.0000 0.0458 4.0857 0.6997 CAPVALt-1 3,147 0.0031 0.0000 0.0000 0.0000 0.0000 0.2070 0.0153
1 Variable definitions are shown in Table 1.
Table 2 shows the descriptive statistics of research variables. The mean (median) value of CAPVAL is 0.0031 (0.00). This indicates that R&D capitalization is not a common accounting practice in the software industry. Devint has a mean value of 0.1538, which indicates that sample firms are R&D intensive. The mean value of X (the ROE under full expensing of software development costs) is -0.2855, which is reasonable in light of the fact that sample firms have a huge amount of R&D investments.
17
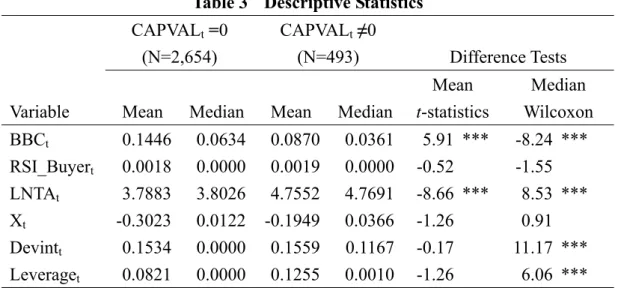
Table 3 Descriptive Statistics
CAPVALt =0
(N=2,654)
CAPVALt ≠0
(N=493) Difference Tests
Variable Mean Median Mean Median
Mean Median t-statistics Wilcoxon BBCt 0.1446 0.0634 0.0870 0.0361 5.91 *** -8.24 *** RSI_Buyert 0.0018 0.0000 0.0019 0.0000 -0.52 -1.55 LNTAt 3.7883 3.8026 4.7552 4.7691 -8.66 *** 8.53 *** Xt -0.3023 0.0122 -0.1949 0.0366 -1.26 0.91 Devintt 0.1534 0.0000 0.1559 0.1167 -0.17 11.17 *** Leveraget 0.0821 0.0000 0.1255 0.0010 -1.26 6.06 ***
1 Variable definitions are shown in Table 1.
As shown in table 3, only about 18.6% (493/2654) of sample firms capitalize their software development costs. Moreover, as shown in Table 3 and Table 4, capitalizing firms present a statistically significant larger size, higher leverage and higher R&D intensity, consistent with the results of prior literature.
18
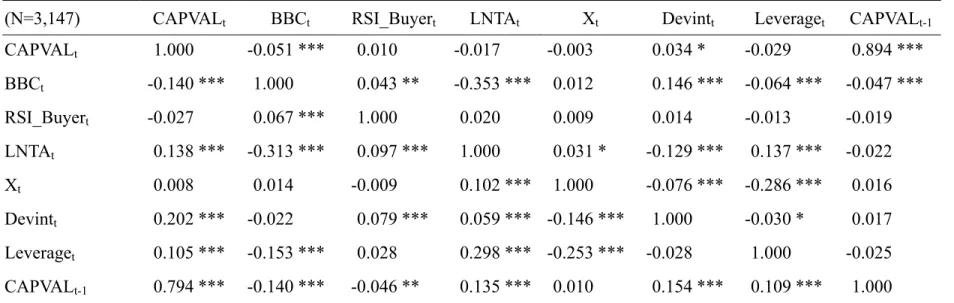
Table 4 Correlation Matrix
(N=3,147) CAPVALt BBCt RSI_Buyert LNTAt Xt Devintt Leveraget CAPVALt-1
CAPVALt 1.000 -0.051 *** 0.010 -0.017 -0.003 0.034 * -0.029 0.894 *** BBCt -0.140 *** 1.000 0.043 ** -0.353 *** 0.012 0.146 *** -0.064 *** -0.047 *** RSI_Buyert -0.027 0.067 *** 1.000 0.020 0.009 0.014 -0.013 -0.019 LNTAt 0.138 *** -0.313 *** 0.097 *** 1.000 0.031 * -0.129 *** 0.137 *** -0.022 Xt 0.008 0.014 -0.009 0.102 *** 1.000 -0.076 *** -0.286 *** 0.016 Devintt 0.202 *** -0.022 0.079 *** 0.059 *** -0.146 *** 1.000 -0.030 * 0.017 Leveraget 0.105 *** -0.153 *** 0.028 0.298 *** -0.253 *** -0.028 1.000 -0.025 CAPVALt-1 0.794 *** -0.140 *** -0.046 ** 0.135 *** 0.010 0.154 *** 0.109 *** 1.000
1 The Pearson correlations are in the above diagonal and Spearman correlations are in the below diagonal. 2 *, **, *** denote two-tailed significance at the 0.10, 0.05, and 0.01 levels, respectively. 3Variable definitions are shown in Table 1.
19
4.1 Tests and discussions for H1
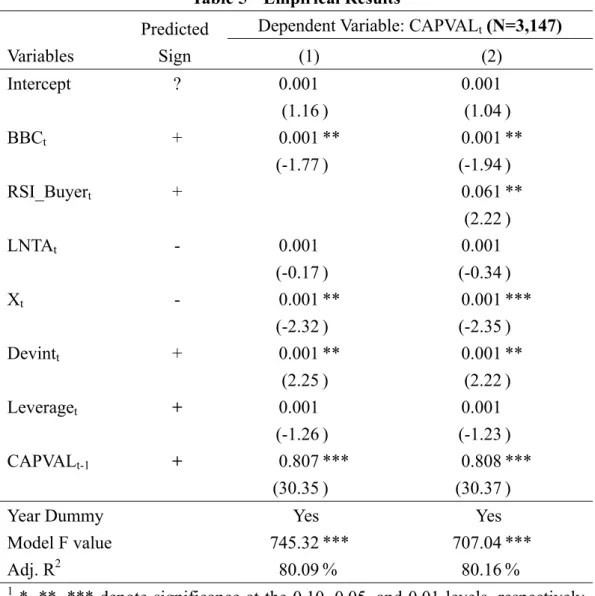
Table 5 Empirical Results
Variables
Predicted Sign
Dependent Variable: CAPVALt (N=3,147)
(1) (2) Intercept ? 0.001 0.001 (1.16 ) (1.04 ) BBCt + 0.001 ** 0.001 ** (-1.77 ) (-1.94 ) RSI_Buyert + 0.061 ** (2.22 ) LNTAt - 0.001 0.001 (-0.17 ) (-0.34 ) Xt - 0.001 ** 0.001 *** (-2.32 ) (-2.35 ) Devintt + 0.001 ** 0.001 ** (2.25 ) (2.22 ) Leveraget + 0.001 0.001 (-1.26 ) (-1.23 ) CAPVALt-1 + 0.807 *** 0.808 *** (30.35 ) (30.37 )
Year Dummy Yes Yes
Model F value 745.32 *** 707.04 ***
Adj. R2 80.09 % 80.16 %
1 *, **, *** denote significance at the 0.10, 0.05, and 0.01 levels, respectively
(a one-tailed test for the coefficients with predicted sign, and a two-tailed test otherwise). 2An analysis of the Variance Inflationary Factor (VIF) for each
model reveals that VIFs are all smaller than 2.7, suggesting that multicollinearity is not an issue. 3Variable definitions are shown in Table 1.
As shown in the first column of Table 5, the coefficient on BBC is significantly positive (coefficients=0.01, p<0.05), indicating that the rate at which a supplier capitalizes software development costs is positively associated with the extent to which its buyer-base is more concentrated. This result supports H1. Software developments are more innovative and exploratory than definitive in nature, thus embody specification uncertainties (Whang 1992). Since many clients do not know
20
what they want until they actually see the system, Richmond et al. (1992) argue that many suppliers/contractors do not really know the required specifications in the beginning of software development projects. Moreover, Kirsch (1992) suggests that the desired performance of software development is difficult to predict. Clients may have too little expertise to evaluate the development process or the quality of the delivered software. Under conditions of information asymmetry, high-quality suppliers face difficulty in indistinguishing themselves from those of low-quality ones. Through R&D capitalization, a supplier demonstrates it possesses state-of-the-art skills, knowledge, or technology for developing a particular software system.
Suppliers often make some client-specific investments prior to contracting with a client, such as developing a client relationship and acquiring client-specific domain knowledge. Like “low balling” in audit pricing, software suppliers may underbid a contract aiming to get future contracts for maintenance, enhancements or additional software. Suppliers may thus become reliant on a client for subsequent businesses. I argue that the dependence worsens when the supplier face a more concentrated client base. As such, high-quality software suppliers have stronger incentives to reveal their private information or self-identify to the customers when facing some dominant buyers. Capitalizing development costs serves as a signal informing those dominant buyers about the firm’s product strength and strategic positions in the marketplace.
Note that signaling through R&D capitalization is costly. As an intangible asset, R&D capitalization signals information about a firm’s quality and performance (Lev 2001). To be effective, the signal should be differentially costly to provide for agents of different quality (Rao and Ruekert 1994; Spence 1973). This signaling activity does have costs since managers are obligated to write down an impaired asset. The signal sent to buyers is that such R&D capitalization would not be worthwhile for a supplier with a lower probability of research success that would not enjoy repeat purchases. Low-R&D-success-probability suppliers that made such capitalizations would face a reputation loss caused by subsequent write-downs (Seybert 2010) and be worse off than if no signal had been sent (Wernerfelt 1988). In contrast, high-R&D-success-probability suppliers that can expect repeat business will enjoy a return on R&D capitalizations.
4.2 Tests and discussions for H2
The coefficient on RSI_Buyer is also significantly positive (coefficient=0.061, p <0.05). This result supports H2, indicating that the greater the level of the buyer’s
21
R&D investments, the greater the supplier's capitalization for development costs will be. Costello (2013) shows that buyers and suppliers are less likely to rely on financial covenants when financial statement reliability is low. For robustness test, I further decompose capitalized software development costs into ‘‘informational’’ and ‘‘garbled’’ components and find that results are driven by the informational component of intangibles capitalization.
Software development outsourcing is increasingly prevalent (Ang and Beath 1993). Often the case, both clients and contractors are required to invest in specific assets prior to or during the process of a software development project. In the software industry, buyers must make relationship-specific investments in order to deal with suppliers/contractors. For instance, learning to use a vendor’s software product takes time, and the skill may hardly transferable to alternative products or operating systems. For example, the level of intangibles investments in specialized ERP systems could be tremendous.
There also exists transaction costs associated with finding and establishing a working relationship with a new supplier. For clients, required transaction-specific investments include efforts invested in teaching a particular supplier exactly what is desired of the software; efforts invested in learning idiosyncratic aspects of communicating with a supplier (e.g., learning a supplier’s lingo or techniques); or efforts invested in learning how to monitor the performance of a particular supplier. Moreover, a buyer’s post-adoption investments, such as training or changes in organization structure or incentive systems, often are hardly transferable to alternative software.
Since the relationship-specific investments are specialized to the firm, their value to the customers depends on the future prospects of the business relationship with suppliers. Thus, suppliers have incentives to capitalize development costs to demonstrate their favorable future prospects. When the supplier’s future prospects are more favorable, the size of future transactions between buyers and the supplier firm could be higher, which increases the buyers’ expected return from the relationship-specific investments.
The buyer’s investment will lose value if the supplier firm goes out of business; or if the supplier firm reneges on the terms of trade, which is more likely when the firm’s future prospects worsen. Consequently, the perception of buyers about the firm’s business prospects affects their incentive to undertake such investments. As
22
such, those software firms with distributors as main customers may capitalize R&D development costs to convince customers to devote resources necessary to provide effective sales for their products (but not competitors' products).
5. Conclusions
There is an increasing importance on the role that accounting information plays in the buyer-supplier relationships (Kulp 2002). However, few studies have examined the role of the firm’s suppliers and customers in determining financial reporting decisions. Using a sample of software firms, this study shows that buyers’ bargaining power and buyers’ relationship specific investments are important determinants of suppliers’ R&D capitalization decisions. My results complement prior accounting studies indicating that powerful suppliers and customers are associated with the focal firm’s accounting practices (Bowen et al. 1995; Raman and Shahrur 2008; Hui, Klasa and Yeung 2012). This study contributes to the literature by integrating a typical management accounting research topic, buyer-supplier relationship management, with two standard financial accounting topics (namely, intangibles capitalization and signaling by financial accounting information).
For practitioners, I suggest those firms with powerful customers could send a positive signal of their innovation capability by choosing R&D capitalization to mitigate asymmetric information problem. Moreover, R&D capitalization can reduce holdup concerns. Therefore, to the extent that customers invest in relationship specific investments, software supplier firms could engage in R&D capitalization to send a signal of their willingness to fulfill implicit claims and maintain long-term relationships to their customers.
References
Aboody, D. and B. Lev. 1998. The Value-relevance of Intangibles: the Case of Software Capitalization, Journal of Accounting Research, 36: pp.161-191.
Aboody, D. and Lev, B. 2000. Information asymmetry, R&D, and insider gains. The
Journal of Finance 55, 2747-67.
Abrahams, T., and B. K. Sidhu. 1998. The role of R&D capitalizations in firm valuation and performance measurement. Australian Journal of Management 23 (2): 169−184.
Ahmed, A. S., E. Kilic, and G. J. Lobo. 2006. Does Recognition versus Disclosure Matter? Evidence from Value-Relevance of Banks’ Recognized and Disclosed Derivative Financial Instruments. Accounting Review 81 (3): 567-588.
23
Mechanism. Quarterly Journal of Economics 84(3): 488 – 500.
Allen, J., and G. M. Phillips. 2000. Corporate equity ownership, strategic alliances and product market relationships. The Journal of Finance 55 December:
2791–2815.
Allison, P. D. 1995. Survival Analysis Using SAS: A Practical Guide. Cary, NC: SAS Institute Inc.
Almus, M., & Nerlinger, E. A. 1999. Growth of new technology-based firms: Which factors matter? Small Business Economics, 13: 141-154.
Amir, E., and B. Lev. 1996. Value-relevance of non-financial information: The wireless communication industry. Journal of Accounting and Economics 22 (1-3): 3–30.
Armour, H. O., and D. J. Teece. 1980. Vertical integration and technological innovation. The Review of Economics and Statistics 62 (August): 470–474.
Arya, A., B. Mittendorf, and D. H. Yoon. 2014. Revisiting the Make-or-Buy Decision: Conveying Information by Outsourcing to Rivals. Accounting Review 89 (1): 61–78.
Baiman, S., and M. V. Rajan. 2002. The role of information and opportunism in the choice of buyer-supplier relationships. Journal of Accounting Research 40 (May): 247–278.
Banerjee, A. V., and E. Duflo. 2000. Reputation Effects and the Limits of Contracting: A Study of the Indian Software Industry, Quarterly Journal of Economics, 115: 989–1017.
Barney, J. 1991. Firm Resources and Sustained competitive Advantage. Journal of
Management Vol. 17, No. 1: 99-120.
Bell, M. Innovation Capabilities and Directions of Development. STEPS Working Paper 33, Brighton: STEPS Centre. 2009.
Biais, B., & Gollier, C. 1997. Trade credit and credit rationing. Review of Financial
Studies 10: 905-937.
Bigliardi, B., and Dormio, A. I., 2008. An empirical investigation of innovation determinants in food machinery enterprises. European Journal of Innovation
Management, Vol. 12, No. 9, pp. 223-242.
Bönte, W. and Nielen, S. (2011), Product Innovation, Credit Constraints, and Trade Credit: Evidence from a Cross-country Study. Managerial and Decision
Economics 32 (6): 413–424.
Bowen, R., L. DuCharme, and D. Shores. 1995. Stakeholders implicit claims and accounting method choice. Journal of Accounting and Economics 20 (December): 255–295.
Brown, D. T., C. E. Fee, and S. E. Thomas. 2009. Financial leverage and bargaining power with suppliers: Evidence from leveraged buyouts. Journal of Corporate
Finance 15 (2): 196–211.
Campbell TS, Kracaw WA. 1980. Information Production, Market Signalling, and the Theory of Financial Intermediation. Journal of Finance 35(4): 863 – 882.
Capó-Vicedo, J., Mula, J., and Capó, J. 2011. A Social Network-based Organizational Model for Improving Knowledge Management in Supply Chains. Supply Chain
Management: An International Journal, 16 (5): 379 – 388.
Costello, A. M. 2013. Mitigating incentive conflicts in inter-firm relationships: Evidence from long-term supply contracts. Journal of Accounting and Economics 56: 19–39.
24
Venture Capital in a Market with Imperfect Information. Journal of Finance 38(5): 1543 – 1568.
Chan, L. K. C., J. Lakonishok, and T. Sougiannis. 2001. The stock market valuation of research and development expenditures. Journal of Finance 56 (6): 2431−2456. Chauvin, K.W, Hirschey, M. 1993. Advertising, R&D expenditures and the market
value of the firm. Financial Management 22: 128 -141.
Chee K. NG, C. K., Smith, J. K. and Smith, R. L. 1999. Evidence on the determinants of credit terms used in interfirm trade. The Journal of Finance, Vol. 54 No. 3 , 1109-1129.
Coad, A., & Rao, R. 2008. Innovation and firm growth in high-tech sectors: A quantile regression approach. Research Policy, Vol. 37 , 633-648.
Cohen, W.M. and Levinthal, D.A. 1990. Absorptive Capacity: A New Perspective on Learning and Innovation. Administrative Quarterly, Vol. 35, 128-152.
Cohen, W.M., Nelson, R.R., & Walsh, J.P. 2000. Protecting their intellectual assets: Appropriablity conditions and why U.S. manufacturing firms patent (or not). NBER Working paper # 7552. National Bureau of Economic Research.
Cowley, P. R. 1988. Market structure and business performance: An evaluation of buyer/seller power in the PIMS database. Strategic Management Journal 9 (3): 271–278.
Cox, D. R. 1972. Regression models and life tables (with discussion). Journal of the
Royal Statistical Society. Series A (General) B34: 187–220.
Dou, Y., O. Hope, and W. B. Thomas. 2013. Relationship-specificity, contract enforceability, and income smoothing. Accounting Review 88 (5): 1629-1656. Ely, K., and G. Waymire. 1999. Intangible assets and stock prices in the Pre-SEC era.
Journal of Accounting Research 37 (1): 17−44.
Etgar, M. 1976. Channel domination and countervailing power in distributive channels. Joumal of Marketing Research 13 (3): 254-262.
Fee, C. E., and S. E. Thomas. 2004. Sources of gains in horizontal mergers: Evidence from customer, supplier and rival firms. Journal of Financial Economics 74 (3): 423–460.
Fee, E. C., and C. J. Hadlock, and S. Thomas. 2006. Corporate equity ownership and the governance of product market relationship. The Journal of Finance 61 (June): 1217–1251.
Galbraith, C. S., and C. H. Stiles. 1983. Firm profitability and relative firm power.
Strategic Management Journal 4 (3): 237–249.
Galbraith, J. K. 1952. American Capitalism: The Concept of Countervailing Power. Boston, MA: Houghton Mifflin.
Gorgoglione M., Roselli V., 1997, “The Object-Oriented Technology in the Software Industry: Perspectives for Client-Supplier Relationships”, Proceedings of the 6th
International Annual IPSERA Conference (International Purchasing & Supply Education & Research Association), Ischia (Italy), March 24-26.
Gosman, M. L., and M. J. Kohlbeck. 2009. Effects of the Existence and Identity of Major Customers on Supplier Profitability: Is Wal-Mart Different? Journal of
Management Accounting Research, Vol. 21: pp. 179-201.
Gosman, M., T. Kelly, P. Olsson, and T. Warfield. 2004. The profitability and pricing of major customers. Review of Accounting Studies 9 (1): 117–139.
25
retailers' power. Commercial Lending Review (March): 25-31.
Grinblatt M, Hwang CY. 1989. Signalling and the pricing of new issues. Journal of
Finance 44: 383 – 420.
Gruner, K.E., and Homburg, C., 2000. Does customer interaction enhance new product success? Journal of Business Research, Vol. 49, No. 1, pp. 1−14. Guimón, J. 2005. Intellectual capital reporting and credit risk analysis. Journal of
Intellectual Capital, Vol. 6 No. 1, pp. 28-42.
Guiso, L. 1998. High-tech firms and credit rationing. Journal of Economic Behavior
& Organization, Vol. 35 , 39-59.
Hughes, P. 1986. Signaling by direct disclosure under asymmetric information.
Journal of Accounting and Economics 8: 119-142.
Hui, K. W., S. Klasa, and E. Yeung. 2012. Corporate Suppliers and Customers and Accounting Conservatism. Journal of Accounting and Economics 53 (1-2): 115-135.
Hyytinen, A., & Toivanen, O. 2005. Do financial constraints hold back innovation and growth?: Evidence on the role of public policy. Research Policy, 34 , 1385-1403. Inkpen, A. C. and P. W. Beamish. 1997. Knowledge, Bargaining Power, and the
Instability of International Joint Ventures. The Academy of Management Review 22
(1): 177-202.
Jones, S. 2011. Does the Capitalization of Intangible Assets Increase the Predictability of Corporate Failure?. Accounting Horizons 25 (1): pp. 41-70.
Kelly, T., and M. Gosman. 2000. Increased buyer concentration and its effects on profitability in the manufacturing sector. Review of Industrial Organization 17 (1): 41–59.
Kimbrough, M.D. 2007. The Influences of Financial Statement Recognition and Analyst Coverage on the Market's Valuation of R&D Capital. Accounting Review 82 (5): 1195-1225.
Kirsch, L. J. 1992. Formal, Informal, and Self Controls: An Analysis of Working Relationships During Systems Development Projects. Unpublished doctoral dissertation, University of Minnesota, Minneapolis, MN.
Klein B, Leffler KB. 1981. The Role of Market Forces in Assuring Contractual Performance. Journal of Political Economy 89(4): 615 – 641.
Kulp S. C. 2002. The effect of information precision and information reliability on manufacturer-retailer relationships. Accounting Review 77 (3):653–677.
LaFrance, V. A. 1979. The impact of buyer concentration: An extension. Review of
Economics and Statistics 61 (3): 475–476.
Leland HE, Pyle DH. 1977. Informational Asymmetries, Financial Structure, and Financial Intermediation. Journal of Finance 32(2): 371 – 387.
Leland, H., and D. Pyle. 1977. Information asymmetries, financial structure, and financial intermediation. Journal of Finance 32: 371-387.
Lev, B. 2001. Intangibles: management, measurement, and reporting. Brookings Institute Press, Washington, D.C.
Lev, B. 2001. Intangibles: Management, Measurement, and Reporting. Washington, D.C.: Brookings Institution Press.
Lev, B., and P. Zarowin. 1999. The boundaries of financial reporting and how to extend them. Journal of Accounting Research 37 (2): 353–385.
26
of R&D. Journal of Accounting and Economics 21 (1): 107−138.
Lustgarten, S. 1975. The impact of buyer concentration in manufacturing industries.
Review of Economics and Statistics 57 (2): 125–132.
Matopoulos, A., Vlachopoulou, M., and Manthou, V. 2007. Exploring the impact of E-business adoption on logistics processes: Empirical evidence from the food industry. International Journal of Logistics: Research and Applications, 10 (2), pp. 109-122.
Milgrom, P., and J. Roberts. 1992. Economics, Organization and Management. Englewood Cliffs, NJ: Prentice Hall.
Mishra, D. P., J. B. Heide and S. G. Cort. 1998. Information Asymmetry and Levels of Agency Relationships. Journal of Marketing Research, Vol. 35, No. 3: 277-295. Mohd, E. 2005. Accounting for Software Development Costs and Information
Asymmetry. Accounting Review 80 (4): 1211-1231.
Monahan, S. 2005. Conservatism, growth and the role of accounting numbers in the fundamental analysis process. Review of Accounting Studies 10 (2-3): 227−260. Moreira A.C., 2005. Supplier-buyer collaboration in New Product Development: Four
case studies involving SMEs. Brazilian Journal of Operations & Production
Management, Vol. 2, No. 1, pp. 5-24.
Mouritsen, J., Bukh, P., Larsen, H. and Johansen, M. 2002. Developing and managing knowledge through intellectual capital statements, Journal of Intellectual Capital, Vol. 3 No. 1, pp.10-29.
Mouritsen, J., Larsen, H., Bukh, P. and Johansen, M. 2001. Reading an intellectual capital statement: describing and prescribing knowledge management strategies,
Journal of Intellectual Capital, Vol. 2 No. 4, pp. 359-83.
Mulford, C. and J. Roberts. 2006. Capitalization of Software Development Costs: A Survey of Accounting Practices in the Software Industry. College of Management, Georgia Institute of Technology, Atlanta, GA 30332-0520 http://smartech.gatech.edu/handle/1853/15598
Myers SC, Majluf NS. 1984. Corporate financing and investment decisions when firms have information that investors do not have. Journal of Financial Economics 13: 187 – 221.
Neely, A. and Powell, S. 2004. The challenges of performance measurement,
Management Decision, Vol. 42 No. 8, pp. 1017-23.
Parise, S. and A. Casher. 2003. "Alliance Portfolios: Designing and Managing Your Network of Business-Partner Relationships." Academy of Management Executive 17(4): 25-39.
Patatoukas, P. N. 2012. Customer-Base Concentration: Implications for Firm Performance and Capital Markets. Accounting Review 87 (2): 363–392.
Petersen, M. A., & Rajan, R. G. 1997. Trade credit: Theory and evidence. The Review
of Financial Studies, Vol. 10 No. 3: 661-691.
Pike, R., Cheng, N. S., Carvens, K., & Lamminmaki, D. 2005. Trade credit terms: Asymmetric information and price discrimination evidence from three continents.
Journal of Business Finance & Accounting, 32(5) & (6), 1197-1236.
Porter, M. E. 1974. Consumer behavior, retailer power and market performance in consumer goods industries. Review of Economics and Statistics 56 (4): 419–436.
27
Power, D., 2005 .Supply chain management integration and implementation: a literature review .Supply Chain Management: An International Journal, 10 (4), pp. 252-263.
Raman, K. and H. Shahrur. 2008. Relationship-Specific Investments and Earnings Management: Evidence on Corporate Suppliers and Customers. Accounting Review 83 (4): 1041-1081.
Richmond, W. B., A. Seidmann and A. B. Whinston. 1992. Contract theory and
information technology outsourcing. Decision Support Systems Vol. 8 (5): 459-477. Scherer, F. M. 1970. Industrial Market Structure and Economic Performance. Chicago,
IL: Rand McNally.
Schwartz, R. A. 1974. An economic model of trade credit. Journal of Financial and
Quantitative Analysis, September , 643-657.
Seybert, N. 2010. R&D Capitalization and Reputation-Driven Real Earnings Management. Accounting Review 85 (2): 671-693.
Song M., and Di Benedetto C. A., 2008. Supplier's involvement and success of radical new product development in new ventures. Journal of Operations Management, Vol. 26, No. 1, pp. 1−22.
Spence AM. 1973. Job Market Signaling. Quarterly Journal of Economics 87(3): 355 –374.
Su H., Fang S., Young C. 2012. Influences of relationship transparency from intellectual capital reporting on supply chain partnerships with suppliers: A field experiment. Supply Chain Management: An International Journal (forthcoming). Terlaak, A and A. A. King, 2006. The effect of certification with the ISO 9000 quality
management standard: A signaling approach. Journal of Economic Behavior and
Organization, 60(4): 579-602.
Thomke S., and Von Hippel E., 2002. Customers as innovators: A new way to create value. Harvard Business Review, Vol. 80, No. 2, pp. 5−11.
Ughetto, E. 2009. Industrial districts and financial constraints to innovation.
International Review of Applied Economics, 23 , 597-624.
Ulaga, W. and Eggert, A. 2006. Value–Based Differentiation in Business
Relationships: Gaining and Sustaining Key Suppliers Status, Journal of Marketing 70 (January): 119-136.
Wagner S.M., 2003. Intensity and managerial scope of supplier integration. Journal of
Supply Chain Management, Vol. 39, No. 4, pp. 4−15.
Welch I. 1989. Seasoned offerings, imitation costs, and the underpricing of initial public offerings. Journal of Finance 44: 421 – 449.
Whang, S. J. 1992. Contracting for software development. Management Science Vol. 38 (3): 307-324.
Wyatt, A. 2005. Accounting Recognition of Intangible Assets: Theory and Evidence on Economic Determinants. Accounting Review 80 (3): 967-1003.