國立台東大學資訊管理學系 碩士論文
應用具模糊主觀與客觀觀點之整合決策 模型-以評估教育網站為例
An Integrated Decision Model for Evaluating Educational Web Sites from
Fuzzy Subjective and Objective Perspectives
研究生:黃智鴻 撰 指導教授:黃正魁博士 王文清博士
中華民國九十八年六月
致謝
天啊!現在心情真是非常的興奮,因為我畢業了耶!真是不敢相信,回想當 日來東大時仍歷歷在目,東大有著全國大學最美的讀書環境,靜謐的夜晚總是能 清楚看到閃亮的星星,早晨總是能清楚的聽到翠耳的鳥語聲以及刺眼的陽光,其 實真的好捨不得離開喔…
我覺得我一直是個幸福的人,能得到眾多老師及朋友的幫忙,尤其是能夠加 入資管所的大家庭中。在這大家庭中,每天沈溺在溫馨快樂,與老師、同儕一起 吃飯、玩樂、作研究,黃正魁老師不僅在學術研究上給予很大的幫助,在無所適 從的人生處事給予開釋才是受益無窮。T412 研究生室是我的第二個家。
首先我想先感謝黃正魁教授兩年來在學業上的指導,使我在學術研究的領域 中有所成長,順利完成本篇論文;其次感謝口試委員王文清老師、廖國良老師的 寶貴意見,使本篇論文能更加完整。
研究所的同學們中,首先我想先感謝李紹永同學,洨用不管是在我生活上,
研究上,都給了我許多建議與指導,感謝洪維昇同學在我碰到困難時給我的協助,
感謝蘇佳慧給予我心靈上的鼓勵,還有龍富、聖熙、柚子、千千、18 歲的肉包等 學弟妹們,在我孤單寂寞時能陪伴我,讓我留下深刻的回憶。最後要感謝我的父 母與家人長久以來給我的支持。
研究所生活酸甜苦辣,一路走來,點滴在心頭,雖然這不是一部完美的論文,
但這部論文的完成,要感謝的人真的很多,在此無法一一詳列,僅以此文表達我 的誠摯謝意。
智鴻 2009. 07 於東大資管所
中文摘要
隨著網路技術進步,瀏覽者可以藉由瀏覽具有結構性的網站,取得已數位化 的資訊。不幸的是,大量的資料常過載和重複於網路上的各個網站間,造成瀏覽 者無法辨識其資料品質。根據 Hwang 所提出的群體決策系統,其系統是藉由瀏覽 者與專家的意見來評估教育網站品質。其研究的資料來源只單純使用人的意見,
稱為主觀看法,來評估網站的品質。然而,人的意見使用於決策系統的制定,有 時會造成意圖與行為之間的落差,使用問項來循序的導出人的想法是此落差發生 的主要原因,人的行為,又可稱為客觀看法,因此,客觀看法能真正反映出人類 想的事與其所做出的結果。
為了達到此目的,我們可以使用資料探勘技術來取得資料來源。根據調查,
Zhou 提出了使用模糊集合方法來整合主觀和客觀的看法,藉以評估期刊品質。然 而,他們的方法使用了更多複雜的流程來解決問題。在本研究中,我們提出了整 合模糊主觀與客觀看法的決策模型,並以評估教育網站為例。主觀看法則使用 Palmer 的問項來取得人的意見,以作為主觀看法的資料來源,客觀看法是使用資 料探勘的技術,以模糊聚類分群演算法計算之結果,作為客觀看法的資料來源。
模糊聚類不只補充了 Hwang 的不足處,並且將 Zhou 的流程簡化,實做一個前導 研究,可以實現並驗證我們提出的模型的有效與效率。
關鍵詞:網站評估、模糊集合、資料探勘、模糊聚類、決策支援系統
Abstract
With the advance of network technologies, lots of data have been digitized to reveal information for users by the construction of web sites. Unfortunately, volumes of data in web sites are both overloading and overlapping in Internet so that users can not distinguish the quality of such data. Accordingly, Hwang et al. proposed a group decision system to evaluate the quality of educational web sites by users’ and experts’
opinions. Its study source is solely stemmed from human intention, called subjective
perspective, to judge the quality of web sites. However, human beings in decision
making sometimes have a gap between intention and behavior. Asking humans for eliciting their thoughts is the major problem, leading to the gap. Human behavior, a.k.a.objective perspective, therefore, becomes the other vital source to perceive human
thinking and real doings. For the purpose, we can employ data mining techniques to acquire the source. To our knowledge, Zhou et al. have proposed an integrated subjective and objective approach to evaluate the quality of journals by fuzzy sets.However, their approach presents a more complicated process to solve the problem. In this paper, we develop an integrated decision model for evaluating educational web sites from fuzzy subjective and objective perspectives. The former source is extracted by inquiring human opinions by a Palmer’s questionnaire, and the latter one is obtained automatically by employing one of data mining techniques, fuzzy clustering. Fuzzy clustering can not only overcome the Hwang et al. shortage, but also can streamline the Zhou et al. process. A pilot real study is carried out to validate our proposed model’s efficiency and effectiveness.
Keyword: web site evaluation, fuzzy sets, data mining, fuzzy clustering, decision support systems
Table of Contents
Chapter 1 Introduction ... 1
Chapter 2 Related works ... 6
2.1 Fuzzy Sets ... 6
2.2 Fuzzy Clustering ... 9
Chapter 3 The Proposed Model... 12
3.1 Using fuzzy clustering to gain fuzzy objective perspective ... 14
3.2 Using the Palmer’s questionnaire to gain fuzzy subjective perspective . 17 Chapter 4 Case for Evaluation ... 20
4.1 An illustrated example ... 20
4.1.1 Objective Procedure ... 20
4.1.2 Subjective Procedure ... 24
4.1.3 Combination... 25
4.2 Higher Education Evaluation of Taiwan Case... 26
4.2.1 Assessment Subjects... 27
4.2.2 Consistence of Data Collection ... 29
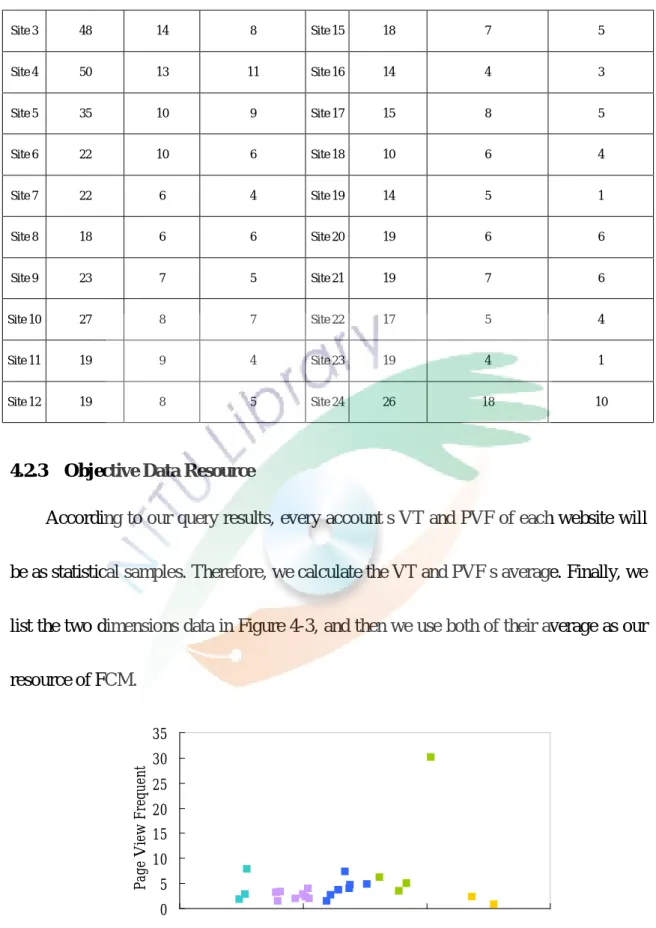
4.2.3 Objective Data Resource ... 30
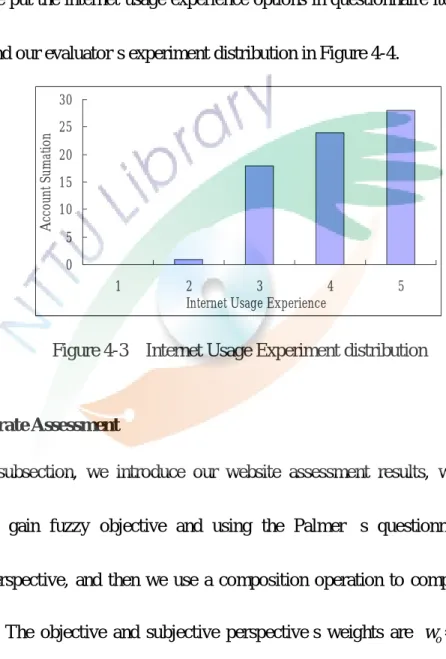
4.2.4 Internet Usage Experiment, (IUE) ... 31
4.2.5 Integrate Assessment ... 31
4.2.6 Sensitivity Analysis of Experimentation Group ... 32
4.2.7 Sensitivity Analysis of Comparison Group ... 33
4.2.8 Common Share Case ... 33
4.2.9 Crisp Case ... 34
4.2.10 Compare with HEEACT’s result... 35
4.2.11 Compare with Objective, Subjective and Integrate Perspective 37 Chapter 5 Conclusions ... 39
APPENDIX ... 44
List of Figures
Figure 2-1 The butterfly dataset and its clustering result. ... 10
Figure 3-1 The algorithm of the proposed model ... 13
Figure 4-1 Pilot cluster center…………. ... …23
Figure 4-2 Viewing Time and Page View Frequent ... 30
Figure 4-3 Internet Usage Experiment distribution ... 31
List of Tables
Table 4-1 Account distribution ... 21
Table 4-2 FCM data source ... 21
Table 4-3 The FCM results ... 22
Table 4-4 The grading results for each website ... 23
Table 4-5 The subjective membership degree results of website 2 ... 25
Table 4-6 Website URL lists ... 28
Table 4-7 Intersection Summaries ... 29
Table 4-8 Combine result of Integrate Assessment ... 32
Table 4-9 Sensitivity Analysis of Experimentation Group ... 32
Table 4-10 Sensitivity Analysis of Comparison Group ... 33
Table 4-11 Combine result of Common Share Case ... 34
Table 4-12 Combine result of Crisp Case ... 35
Table 4-13 Our model compare with HEEACT’s result ... 36
Table 4-14 Our model compare with Crisp Case ... 36
Table 4-15 Compare with Subjective perspective and Objective perspective ... 38
Table 4-16 Compare with Subjective perspective and Integrate perspective... 38
Table 4-17 Compare with Objective perspective and Integrate perspective ... 38
Chapter 1 Introduction
With the advance of network technologies, lots of data have been digitized to reveal information for users by the construction of web sites. According to a Netcraft web server survey in February 2009 [14], over 215 million sites have been built in Internet. Since web sites serve as a major portal to connect with most information, evaluating the quality or utility of web sites is important as a way to understand whether those data could be satisfied for users or not. Therefore, the “information overloading/overlapping” problem becomes a barrier when a user attempts to seek some information in his/her mind but loses his/her way in volumes of data. On the other hand, web site managers also lack to consider what the management of web sites will affect user’s perception of the quality. To facilitate such work, therefore, an appropriated approach needs to be established.
For evaluating the quality of web sites, lots of studies have worked on different metrics to measure web sites. They can be classified into two cases, i.e. crisp and fuzzy.
The former only allows users to express opinions by absolutely either 0 or 1 for dealing with the problem easily. However, it might be that we can not approach reality to present our thinking naturally. For example, we think that a web site is somewhat but not absolutely good in its quality; however, the former only can treat the web site as
good or not absolutely. The latter can remedy this problem so that we can have opinions between 0 and 1. Therefore, the web site in its quality is belonging to 0.8 for a good grade and 0.2 for a not good grade. In crisp case, Palmer [17] developed metrics for evaluating usability, design, and performance constructs to understand consumer-focused web sites. Loiacono et al. [11] has generated a complete website quality measure designed to capture what a web site design will influence a user’s intention to reuse. Aladwani and Palvia [1] reported on the development of an instrument that captures key characteristics of web site quality from the user’s perspective. In fuzzy case, Hwang et al. [8] proposed a group decision system, called EWSE (Educational Web Site Evaluator), to evaluate the quality of educational web sites by users’ and experts’ opinions. In summary, all the above studies tend to develop an approach to inquire user’s thinking for some dimensions for the quality of web sites.
Their study sources are solely stemmed from human intention, called subjective
perspective, to judge the quality of web sites.
Unfortunately, human beings in decision making sometimes have a gap between intention and behavior. Asking humans for eliciting their thoughts is the major problem, leading to this gap. In Legris et al. study [12], the difficulty with self reported use is also the problem of causing the gap. Human behavior, a.k.a. objective perspective, therefore,
becomes the other vital source to perceive human thinking and real doings. For the purpose, we can employ data mining techniques to acquire the source [18]. This idea is inspired in that we use the past browsing logs to analysis the actual behaviors for web sites automatically. As the result, if a user surfs a web site with a longer time and clicks its web pages more times, we believe that the presentation of the web site is content with him/her. Therefore, we can gather the user’s certain perception according to a series of the actual behaviors without interrupting the user.
To our knowledge, Zhou et al. [21] have proposed an integrated subjective and objective approach to evaluate the quality of journals by fuzzy sets. Their subjective perspective, also called the perception analysis approach, extracts opinions from experts.
The approach only asks one question, i.e. please give your judgment on a journal, to determine its grade. In addition, their objective perspective, also called the citation analysis approach, determines the rankings of journals based on the impact factors provided by journal citation reports, an electronic database. Users also need to participate in this process to determine each membership degree for each grade. Finally, they proposed a methodology to integrate the both perspectives, providing a comprehensive consideration for assessing the quality of journals. As the problem of judging the quality of journals, evaluating the quality of web sites also encounters the
same circumstance. To combine the both for assessing the quality of web sites, we use a Palmer’s questionnaire [17], the rigorous metrics to study the quality of web sites, to solicit human opinions. It improves the Zhou et al. failure in subjective perspective.
Also, we employ one of data mining techniques, fuzzy clustering, to gain objective perspective automatically. The technique solves the problem of the Zhou et al. failure in objective perspective to streamline the complicated process and reduces the degree of human participation.
The information overloading/overlapping problem discussed above is especially significant in the type of educational web sites. In Taiwan, a topic of higher education evaluation and accreditation in university evaluation has been raising recently [9]. A group of professionals develop a standard to evaluate higher education institutions, commissioned by the Ministry of Education. Their evaluating dimensions, however, do not involve in addressing the quality of their educational web sites. Without this dimension, we can not hold the total educational quality completely because most of educational resources have been presented in universities’ web sites.
In this paper, we develop an integrated decision model for evaluating Taiwan educational web sites from fuzzy subjective and objective perspectives. The former source is extracted by inquiring human opinions referred to the Palmer’s questionnaire,
and the latter one employs fuzzy clustering to achieve them automatically. Although the Palmer’s original subject is to study consumer intension in companies, we still can use for treating students in a university as our consumers to serve. Besides, fuzzy clustering can not only overcome the Hwang et al. shortage, but also streamline the Zhou et al.
proposed process.
The balance of this paper is organized as follows. Section 2 reviews related works used in our proposed model. Section 3 formally describes the integrated model from fuzzy subjective and objective perspectives. Section 4 studies our case for evaluating educational web sites. Finally, conclusions are drawn in Section 5.
Chapter 2 Related works
To approach real thinking and behavior from human beings, we utilize fuzzy techniques to combine subjective and objective perspectives for evaluation. We present their rationales and related works as follows.
2.1 Fuzzy Sets
The theory of fuzzy sets was first proposed by Zadeh in 1965 [20]. It can model the imprecise and qualitative knowledge, as well as the transmission and handling of uncertainty at various stages of our real life. In the mathematical field, it can be treated as an extension of crisp sets, but is a set without the exactly one or zero.
A membership function that assigns to each object a membership degree is associated with a fuzzy set. The membership degrees are usually in [0, 1] range. When the membership degree for an object is ‘1’, it means that the object is absolutely in the set. On the other hand, ‘0’ means that the object is absolutely not in the set. Borderline cases are assigned to the values between ‘0’ and ‘1.’ Precise membership degrees can not convey any absolute meaning. A fuzzy set F is characterized by a membership function μF: U→[0, 1] that assigns to each object x of U, a membership degree μF(x), in the continuum [0, 1]. The membership degree is also referred to as the degree of fulfillment or possibility. Thus, a fuzzy set is also a collection of objects, but with the
understanding that some objects can “belong more” to it than others do. For example, in the fuzzy set of “birds,” of the universe of “animals,” a platypus and a dove might have membership degrees, 0.45 and 1, respectively. By blurring the boundaries of the crisp set, it is possible to represent arbitrary collections of objects in the area of mathematics.
In this paper, we employ a notation to represent fuzzy sets. Assume that x1 to xn are the objects in fuzzy set F, and μ1 to μn are their membership degrees in F. F is then represented as follows.
F=μ
1/x1+μ2/x2+…+μn/xn.Like the operations of crisp sets, the study of fuzzy sets also owns its basic operations, such as union, intersection, and complement. The union of two fuzzy sets A and B is a fuzzy set C, written as C=A∪B, whose membership function μC(x) is given by μC(x)=max(μA(x), μB(x)), x∈U. The intersection of two fuzzy sets A and B is a fuzzy
set C, written as C=A∩B, whose membership function μC(x) is given by μC(x)=min(μA(x),
μ
B(x)), x∈U. Finally, the complement of a fuzzy set A, denoted by A’ is defined by themembership function as μA’(x)=1-μA(x), x∈U.
Let X, Y be the universes and Γ(U) be the set of all fuzzy sets in Y,
( ) ( )
( ) ( )
{ x y x y x y x y X Y }
A =
, ,µ
A , ,µ
A ,∈
[0,1],( , )⊆ ×
is called a fuzzy relation on X×Y.f: X→Γ(Y), is called a fuzzy function form X to Y. The fuzzy functions and fuzzy
relations are inter-related, and both can be represented by the membership matrix. The composition of two fuzzy relations P(X, Y) and Q(X, Y) can be defined in terms of an operation on the membership matrix P and Q that resembles matrix multiplication. This operation involves exactly the same combinations in the matrix multiplication are replaced with other operations. These alternative operations represent in the given context, the corresponding operations of fuzzy set intersection and union. In the Max-Min composition, for example, the multiplication and addition are replaced with the Min and Max operations, respectively. The result of composition on P(X, Y) and
Q(X, Y) is a fuzzy relation R(X, Y), which can be dented as R=P
oQ. As the above
introduction, we will employ them to explain our following examples for gaining subjective perspective for evaluation.
The study of fuzzy sets has been used to cope with various evaluating problems. It is an efficient and effective method to represent the uncertainty and vague terms in an assessment environment. Hwang et al. [8] proposed a fuzzy sets system to evaluate the quality of educational web sites by users’ and experts’ opinions. Ma et al. [13] proposed a fuzzy set approach to assess the outcomes of student-centered learning. Capaldo et al.
[4] used fuzzy logic to a rating problem in personnel assessment. Dweiri et al. [6]
presented an approach that employs fuzzy decision making for the evaluation of the
project management internal efficiency. Other applications in engineering can be referred to in [18] and those in business or management are also in [3].
2.2 Fuzzy Clustering
Clustering involves the task of dividing objects into homogeneous clusters, so that objects in a cluster are as similar as possible and those in different clusters are as dissimilar as possible. The most well-known and commonly used partitioning method is
k-means. It takes the input parameter, k, and partitions a set of n objects into k clusters
so that the resulting intra-cluster similarity is high but the inter-cluster similarity is low.
Cluster similarity is measured in regard to the mean value of the objects in a cluster, which can be viewed as the cluster’s center of gravity.
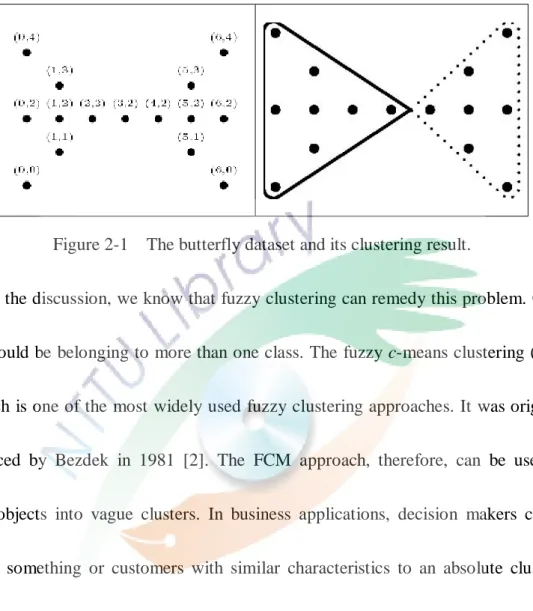
In the above traditional clustering, objects are divided into crisp classes, where each of them belongs to exactly one cluster. In fuzzy clustering, however, objects can belong to more than one class, and associated with each of objects are membership grades which indicate the degree to which objects belong to the different classes. A classical butterfly dataset in Figure 2-1 was proposed to reveal the drawback of the traditional clustering. As the left of Figure 2-1, using a traditional approach will confront a sharp boundary problem for object (3, 2). The right of Figure 2-1 is the clustering result by this approach. Is object (3, 2) really contributing only to one cluster?
Is the clustering result satisfactory for us? It remains a dilemma for the traditional clustering.
Figure 2-1 The butterfly dataset and its clustering result.
As the discussion, we know that fuzzy clustering can remedy this problem. Object (3, 2) could be belonging to more than one class. The fuzzy c-means clustering (FCM) approach is one of the most widely used fuzzy clustering approaches. It was originally introduced by Bezdek in 1981 [2]. The FCM approach, therefore, can be useful to divide objects into vague clusters. In business applications, decision makers can not identify something or customers with similar characteristics to an absolute cluster or group. Some valuable information will be ignored if they belong to multiple clusters or groups naturally. Many studies have adopted this idea to resolve their problems. Ozer [15] applied fuzzy clustering to identify homogenous groups of online music services’
users with respect to their attitudes, interests and opinions and to develop customized strategies for each group. Ozer [16] also used fuzzy clustering to categorize the potential users of an Internet portal for offering business-related information. Guo et al. [7] used
fuzzy clustering to customer relationship management of the securities industry. Lenard et al. [10] studied a description and testing of fuzzy clustering and a hybrid model that can support the decision an auditor makes when completing the going concern evaluation. As the reviews of those applications, we know that the work of evaluation can also be employed by fuzzy clustering. When we attempt to divide the given web sites into one cluster by the web browsing characteristics, there are some web sites that we can not assign to a cluster absolutely. They are close to two or above clusters in real-life applications. To pursue the field evaluating result, we determine to use this technique to gain objective perspective.
Chapter 3 The Proposed Model
In this section, we propose the model to gain fuzzy objective and subjective perspectives, respectively. The former source is acquired by the fuzzy clustering approach, and the latter one is acquired by the Palmer’s questionnaire. Finally, we combine the both to generate a final evaluating result. The result shows that all web sites have their owning grades, which can provide references for web users or managers.
In the beginning, we present the algorithm of the proposed model and describe all procedures in the following sub-sections. So, we introduce how to gain the objective source in Section 3.1 and the subjective one in Section 3.2. Finally, the combination of the two sources is showed in Section 3.3.
Input: an evaluated web site ws, the number of clusters c, the fuzziness exponent m, the termination tolerance
ε
, the questionnaire Palmer and its number of items n=18, the objective weight wo, and the subjective weight ws (wo+ws=1).Output: a max_grade for ws.
Method:
1 Objective_Procedure 1.1 Set r=0;
1.2 Initialize the U matrix, Ur;
1.3 Calculate the fuzzy cluster centers {vir
| i=1, 2, ..., c} by using UI; 1.4 Calculate the new partition matrix U(r+1) by using {viI | i=1, 2, ..., c};
1.5 If
U
(r+1)− U
(r)≤ ε
or a predefined number of iterations then stop, else set r=r+1 and go to step 1.3;1.6 Draw out the column of ws from UI as a vector vws. 2 Subjective_Procedure
2.1 A user gives his/her opinion according to item qi of Palmer for ws, where
i=1, 2, …, n;
2.2 FVi=fuzzification(Palmer(qi)), where i=1, 2, …, n;
2.3 FV=Average(
∑
= n
i
FV
i 1).
3 Combination
3.1 Y=(wo∪ws)o(vws∪FV) ; 3.2 max_grade=Max(Y) ;
3.3 If there is not a consensus then employ a sensitivity analysis, else output
max_grade.
3.1 Using fuzzy clustering to gain fuzzy objective perspective
In this sub-section, we introduce the fuzzy c-means clustering (FCM) approach to gain objective information. We define the problem firstly. Let X={x1, x2, ..., xn} be a set
of given objects, where each object xm (m=1, 2, …, n) is a vector in R (real number), Ucn be a set of real c×n matrices, and c be an integer, where 1<c<n. Then the fuzzy c
segments for X is the set
∈ ∈ = < <
= ∑ ∑
=
=
n u u
u U U M
n
i ik c
i ik ik
cn fcn
1 1
0 , 1 ];
1 , 0 [
: ………. (1)
where uik is the membership degree of xk in cluster i (i=1, 2, …, c). The purpose of the FCM approach is to find the optimal fuzzy c segments and corresponding prototypes minimizing the objective function as follows.
( ) ( )
21 1
;
, k i
n m
k c
i ik
m
U V X u x v
J = ∑∑ −
= =
……….... (2)
In formula (2), V=(v1, v2, …, vc) is a matrix of unknown cluster centers (prototypes)
v
i∈R, ||.|| is the Euclidean distance measure and the weighting exponent m in [1, ∞) is a
constant that influences the membership degrees.
To minimize criterion Jm, under the fuzzy constraints defined in (1), the FCM approach is defined as an alternating minimization algorithm as follows. Choose a value for c, m, and ε, a small positive constant, and then generate randomly a fuzzy c segment
U
0 and set iteration number r=0. A two-step iterative process works as follows. Given the membership degreesu , the cluster centers
ikrv
i( r) (i=1, 2, …, c) are computed by( )
∑ ( )
∑
=
=
=nk r m ik n
k
k r m ik r
u x u v
i1 ) ( 1
) ( )
( ……….. (3)
Given the new cluster centers
v
i( r), update membership degreesu :
ikr1
1
1 2
) 2 (
) 2 ( 1
−
=
− +
−
= ∑
c−
j
m
r j k
r i r k
ik
v x
v
u x
………..……. (4)The process stops when
U
(r+1)− U
(r)≤ ε
, or a predefined number of iterations is satisfied. As the following computations, we will employ those formulas to explain our examples for gaining objective perspective for evaluation.Before using the FCM approach, three parameters, the number of clusters, c, the fuzziness exponent, m, and the termination tolerance, ε, need to be discussed primarily:
(1) Number of clusters. The number of clusters c is the major parameter to influence the clustering result. When clustering real-life data without any a priori knowledge about the structures, we usually must make assumptions about the number of underlying clusters. Regardless of whether the result presents in the proper structures of the data or not, the clustering approach then searches for c clusters. In general, there are two methods, validity measurements and iterative merging or insertion of clusters, to choose the proper number of clusters in data. The former is to propose validity measurements that are scalar indices for assessing the goodness
of the clustering result. When the number of clusters is chosen equal to the number of groups that actually exist in data, it can be identified as locating well-separated and compact clusters. Otherwise, misclassifications are appeared and are not likely to be well separated and compact. The validity measurements can be referred to in [2]. The latter is an idea to merge or insert clusters when the number of clusters is predefined improperly. The task of cluster merging is to begin with a sufficiently huge number of clusters, and successively reduce this number by merging clusters that are similar with respect to some criteria. The task of cluster inserting is to begin with a small number of clusters, and iteratively insert clusters in the regions where the objects own low membership degree in the existing clusters. In our research problem, we predetermine the number of clusters, i.e. the grades of web sites, and employ the former to measure their goodness.
(2) Fuzziness parameter. The fuzziness exponent m is a rather important parameter, because it significantly influences the fuzziness of the clustering result. If m is closer to 1, the partitions become hard, i.e.
u is either 0 or 1, meaning that they are
ikdistinct. On the other hand, if m is larger, the partitions become completely fuzzy (
u =1/c), indicating they are all overlapping. No theoretical optimum choice of m
ik has emerged in the literature. However, the bulk of the literature seems to reportvalues in the range 1.25 to 2. Convergence of the FCM approach tends to be slower as the value of m increases. In our case, m=2 is initially chosen.
(3) Termination criterion. The FCM approach stops iterating when the norm of the difference between U in two successive iterations is smaller than the termination parameter, ε. For the maximum normmaxik
( uik(r+1) − u
ik(r) )
, the usual choice is
ε=0.001, even though ε=0.01 works well in most cases, while drastically reducing
the computing times. In our case, we follow the choice for setting ε=0.001.
Finally, we have a final matrix U(r) which presents the membership degrees of clusters for all evaluated web sites. For evaluating web site ws, we only draw out the column of ws from U(r) as a vector vws for the following combination.
3.2 Using the Palmer’s questionnaire to gain fuzzy subjective perspective
To be useful for measuring the user’s opinion, the metrics developed by Palmer can be used to fulfill our purpose. There are eighteen items in this metrics. The questionnaire evaluating the performance of web sites, however, is proposed by the crisp scale measurement. For acquiring the fuzzy subjective opinions directly, we replace the crisp scale of the questionnaire by the fuzzy linguistic terms (see Appendix A). Each fuzzy linguistic term can be transferred to a fuzzy vector. A user will be
required to fill in the eighteen items (n=18) qi (i=1, 2, …, n) for ws in the questionnaire
Palmer. Then, they will be transferred to the eighteen fuzzy vectors, FV
i, where i=1, 2, …, n. Afterwards, a final fuzzy vector, FV, representing the user’s fuzzy subjective opinion can be computed by summing then averaging these fuzzy vectors.3.3 Synthesizing fuzzy subjective and objective perspectives
For evaluating web site ws, we have two weights and the fuzzy evaluation relation.
In the following, we use a composition operation to compute the final fuzzy vector, denoted as Y. We define the operation as follows (Formula (5)).
( )
( , ,..., ), , ,
...
...
...
...
..., , ,
..., , , ,...,
, , ) (
)
( 1 2
1 1
2 1
2 1
1 1
1 2
1 d
d s s
s
d s s
s
od o
o
s s s o ws
s
o
y y y
e ...
e e
e e
e
e e
e w w w w FV v
w w Y
n n
n
n
=
=
∪
∪
=
o o, where
y
j= ( w
o• e
oj) ⊕ ( w
s• e
s j) ⊕
...⊕ ( w
sn• e
snj)
1
1 and j=1, 2, …, d,
•
and⊕
are defined as: (1)algebraic product for a• b is c=ab; (2)bounded sum for a ⊕ b is c=min{1,
a+b}. The objective and subjective perspectives’ weights, w
o and ws, are determined by decision makers. In general, the sum of the both is equal to one, i.e. wo+ws=1. Having the value of wo is determining the value of ws as well (i.e. ws=1-wo). The value of ws, however, needs to be considered more by the Internet usage experience of web users. If the experience of a web user is junior, we assign a lower weight to him/her. Otherwise, we assign a higher weight if his/her web experience is senior. We give an example toexplain the idea.
Example 1. If wo=0.5, then ws=1-wo=0.5. Also, we set three levels of the Internet usage experience, e1: less than one year, e2: between one year and three years, and e3: above three years, and have three web users, u1 with e1, u2 with e2, and u3 with e3. Then, we have the three predefined values for e1=1, e2=2, and e3=3 so that their final weights are
083 . 6 0
5 . 1 0
1
=
×
=
u
w
s , 0.1676 5 . 2 0
2
=
×
=
u
w
s , and 0.256 5 . 3 0
3
=
×
=
u
w
s .Also, the value of
w
s= w
su1+ w
su2+ w
us3 is equal to 0.5.The final vector, Y, presents a grade result for a web site. To evaluate the certain grade for this web site, we use an operator, Max, to get the maximal grade, max_grade, by one of those grades in its vector.
To reach the consensus and resolute the conflict of the final result, a sensitivity analysis can be conducted. The values of wo and ws can be adjusted to observe a new result to the impact on Y. If the Y value is not sensitive, it presents the stable result to this evaluation. However, if the sensitivity analysis is of larger variation in Y, we can use a conflict-resolution method such as the Delphi method [5] or face-to-face discussion to address this issue.
Chapter 4 Case for Evaluation
We present an example and a pilot real study in Section 4. In Section 4.1, we introduce how to calculate the objective source in Section 4.1.1 and the subjective one in Section 4.1.2. We combine with the two sources to show the final results in Section 4.1.3. In Section 4.2, a pilot real study is carried out to validate our proposed model by the case of evaluating higher education web sites in Taiwan.
4.1 An illustrated example
4.1.1 Objective Procedure
In this subsection, we introduce how to gain the objective source. The proposed example was tested by using 14 visitors and 7 websites, however, we only show the evaluation result of one website. We take the fuzzy clustering to gain the fuzzy objective perspective as the description in Section 3.1.
Our objective source was collected by the proxy server logs. The proxy server has the account management, so we can save every account’s activities by the logs. It stored 5 columns as follows: Year-Month-Day and Hour-Minute-Seconds, User id, Server IP Address, URL, and Referer. According to the useful log records, we could find out every account’s viewing times and page view frequent by the data preprocessing technique. Therefore, we can classify the accounts with having the same Server IP
Address. The block represents the account’s information which involves Viewing Time (VT) and Page View Frequent (PVF) in an example of Table 4-1.
Table 4-1 Account distribution
Website NO. Using account
1 Account 02, Account 05
2 Account 03, Account 09
3 Account 07, Account 13
4 Account 11, Account 14
5 Account 06, Account 10
6 Account 04. Account 08
7 Account 01, Account 12
We can calculate VT and PVF at each website from the account’s information. So we can calculate the averages of VT and PVF for each website as our fuzzy clustering calculating data input in Table 4-2.
Table 4-2 FCM data source
Site Site 1 Site 2 Site 3 Site 4 Site 5 Site 6 Site 7 PVF 12.5 7.5 15.5 12 17 25.5 17.5
As the above website data, let
= x
1,x
2,...,x
7X
be a set of given objects, where each objectx
m( m =
1,2,...,7)
is a vector in R (real number),U
cnbe a set of real 5×7 matrices. Then the fuzzy c segments for X is the set whereu
ik is the membership degree ofx in cluster i
k( i =
1,2,...,5)
[ ]
∈ ∈ = < <
= ∑ ∑
= =
5
1
7
1
7 0
, 1
; 1 , 0 :
i i
ik ik
ik cn
fcm
U U u u u
M
So, given the membership degrees
u the fuzziness exponent
ikm =
2, the clustercenters
v
i( )r( i =
1,2,...,5)
are compute by ( )( )
( )( )
( )∑
∑
=
=
=71 2 7
1 2
k r ik k
k r ik r
i
u x u
v
, then we can updatemembership degrees
( ) ( )
1 5
1
1 2
2
2 2
−
=
−
−
= ∑ −
j r
j k
r i r k
ik
v x
v
u x
. The process stops when terminationtolerance
ε =
0.001 andU
( )r+1− U
( )r≤ ε =
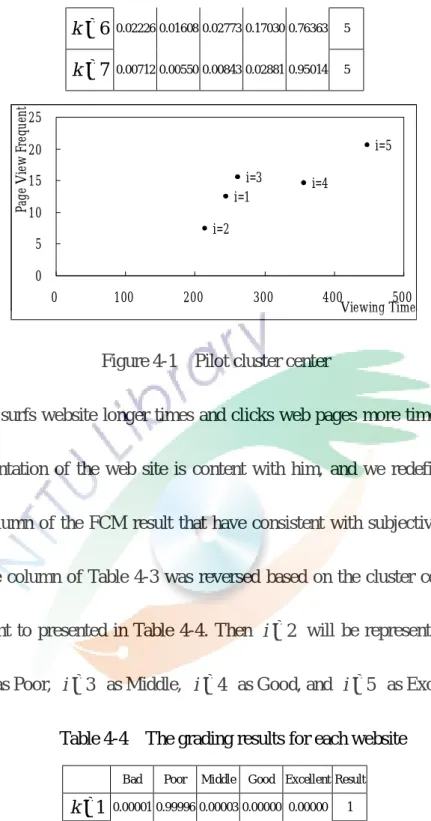
0.001. We get our objective membership degree result by the FCM approach. We can classify all objects k ( k =1, 2,…,7) into the cluster i ( i =1, 2,……,5) in Table 4-3 and show their cluster centers in Figure 4-2.Table 4-3 The FCM results
=
1i i =
2i =
3i =
4i =
5 Result=
1k
0.99996 0.00001 0.00003 0.00000 0.00000 1=
2k
0.00000 0.99999 0.00000 0.00000 0.00000 2=
3k
0.00006 0.00001 0.99993 0.00000 0.00000 3=
4k
0.00120 0.00073 0.00172 0.99475 0.00160 4=
5k
0.00047 0.00029 0.00067 0.99783 0.00073 4=
6k
0.02226 0.01608 0.02773 0.17030 0.76363 5=
7k
0.00712 0.00550 0.00843 0.02881 0.95014 5i=3 i=4
i=5
i=1 i=2
0 5 10 15 20 25
0 100 200 300 400 500
Viewing Time
Page View Frequent
Figure 4-1 Pilot cluster center
If a user surfs website longer times and clicks web pages more times, we believe that the presentation of the web site is content with him, and we redefine the cluster center and column of the FCM result that have consistent with subjective perspective.
Therefore, the column of Table 4-3 was reversed based on the cluster center from the left to the right to presented in Table 4-4. Then
i =
2 will be represented as the Bad grade,i =
1 as Poor,i =
3 as Middle,i =
4 as Good, andi =
5 as Excellent.Table 4-4 The grading results for each website
Bad Poor Middle Good Excellent Result
=
1k
0.00001 0.99996 0.00003 0.00000 0.00000 1=
2k
0.99999 0.00001 0.00000 0.00000 0.00000 2=
3k
0.00001 0.00006 0.99993 0.00000 0.00000 3=
4k
0.00073 0.00120 0.00172 0.99475 0.00160 4=
5k
0.00029 0.00047 0.00067 0.99783 0.00073 4=
6k
0.01608 0.02226 0.02773 0.17030 0.76363 5=
7k
0.00550 0.00712 0.00843 0.02881 0.95014 54.1.2 Subjective Procedure
In this subsection, we introduce how to gain the subjective source. The questionnaire is used to evaluate the performance of the web sites. We divided the questionnaire options into two parts, one part is the questionnaire weight by item 1 and item 2 and the other part is the questionnaire membership degree between items 3 to 20.
The questionnaire weight
w
s=
1− w
o=
0.5 was developed for five levels of the internet usage experience,e :less than one year,
1e :between one year and three years,
2e :between three years and five years,
3e :between five years and seven years, and
4e
5:above seven years, and website 2 have account 3 and account 9 web users:u with
3e ,
3u with
9e , so that their questionnaire weights are:
51875 . 5 0 3
5 . 3 0
3
=
× +
=
u
w
s , 0.31255 3
5 . 5 0
9
=
× +
=
u
w
s , respectively.We sum the questionnaire items from 3 to 20, and then calculate their average, and then we use the average to be transferred to a fuzzy membership degree by the five triangle membership functions as follows:
( )
>
≤
≤
−
<
=
2 , 0
2 1
, 2
1 , 1
x x x
x
bad
x
µ
,( )
>
≤
≤
−
=
≤
≤
−
<
=
3 , 0
3 2
, 3
2 , 1
2 1
, 1
1 , 0
x x x
x x x
x
poor
x
µ
,( )
>
≤
≤
−
=
≤
≤
−
<
=
4 , 0
4 3
, 4
3 , 1
3 2
, 2
2 , 0
x x x
x x x
x
middle
x
µ
,( )
>
≤
≤
−
=
≤
≤
−
<
=
5 , 0
5 4
, 5
4 , 1
4 3
, 3
3 , 0
x x x
x x x
x
good
x
µ
,( )
<
≤
≤
−
>
=
4 , 0
5 4
, 4
5 , 1
x x x
x
excellent
x µ
For example, the accounts 3 and 9 have a subjective perspective on website 2 by the questionnaire, then we can calculate their averages of items from 3 to 20, and we can transfer them to the subjective membership degrees. The averages of accounts 3 and 9 are 4.5 and 2.555, so we can transfer the averages by the membership functions in Table 4-5.
Table 4-5 The subjective membership degree results of website 2
Website 2 Bad Poor Middle Good Excellent
Account 3 0 0 0 0.5 0.5
Account 9 0 0.4444 0.5556 0 0
4.1.3 Combination
In this subsection, we introduce how to combine the objective and subjective sources. We have two weights, and the fuzzy evaluation relation. One of the weights is
5 .
=
0w
o which is determined by decision makers, and the other weight is9 2 3
1 o us2 su
s
w w w
w = − = +
. We can find the website 2 objective membership degree fromTable 4-3 and add it as the first row of the evaluation matrix of evaluators’ subjective membership degree in Table 4-4. In the following, we use a composition operation to
compute the final fuzzy vector
Y
.( ) ( ) ( )
=
∪
∪
=
0 0 5556 . 0 4444 . 0 0
5 . 0 5 . 0 0 0
0
0 0 0
00001 . 0 99999 . 0 3125 . 0 , 1875 . 0 , 5 .
0 o
o v FV
w w
Y o s ws
Therefore, we have an evaluation result of website 2 as:
(
1, 2, 3, 4, 5) ( =
0.499995,0.13888,0.173625,0.09375,0.09375)
= y y y y y
Y
, whose maximalnumber is 0.499995 in Y . According to the result, we can infer that the grade of the website 2 is most likely to be Bad.
4.2 Higher Education Evaluation of Taiwan Case
Since the university department’s website platform presents an important media to access information for web users, we need to understand the quality of educational resources sharing in Internet. Therefore, the evaluation of the department’s website could help decision-makers understand whether the website design is good or bad. In Taiwan, a group of professionals are commissioned by the Ministry of Education to evaluate the quality of teaching and learning resources; however, their evaluation dimensions are lacking of the quality of department’s websites.
In practice, an evaluator logins our website assessment questionnaire system and
we guide them to click website links to browse the contents. When he or she clicks website links, the system will redirect a frame page to lead to travel. Therefore, the evaluator activities can be recorded by proxy server logs. When the evaluator wants to quit the website, the system will popup the Palmer’s questionnaire to require him or her to fill up. So, we can collect a response of the questionnaire from this evaluator.
Our experimental data are collected by Proxy Server Logs and the Palmer’s questionnaire. Although the Palmer’s original subject is to study consumer intension in companies, we still use it for treating the National Chung Cheng University and the National Taitung University teachers and students as our consumers to serve. The underlying technology includes Microsoft Server 2003 R2, Microsoft SQL Server 2005, Microsoft Internet Information Server 6.0, and FreeProxy Proxy Server. The Website Assessment Questionnaire System is built by Microsoft Active Server Page. We describe our experimental assessment results as following subsections.
4.2.1 Assessment Subjects
In this subsection, we introduce our assessment website ranges. First, we survey the assessment results of Higher Education Evaluation & Accreditation Council of Taiwan (HEEACT) in each semester. Second, each department assessment result has three grades: passed, observed, and failed in HEEACT. We queried the assessment
results based on the three grades, respectively. Third, we selected 6 kinds of field departments and had 24 websites. According to their results and the above steps, we found out each website’s URL in Table 4-6.
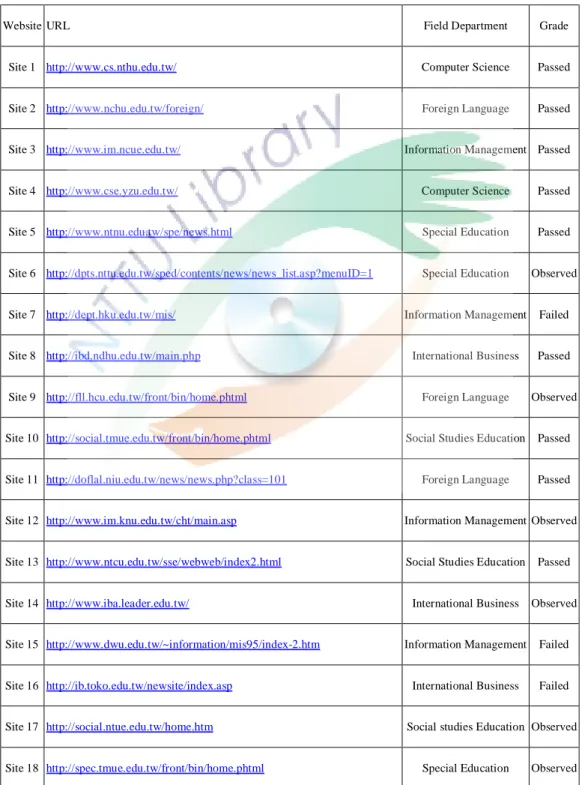
Table 4-6 Website URL lists
Website URL Field Department Grade
Site 1 http://www.cs.nthu.edu.tw/ Computer Science Passed
Site 2 http://www.nchu.edu.tw/foreign/ Foreign Language Passed
Site 3 http://www.im.ncue.edu.tw/ Information Management Passed
Site 4 http://www.cse.yzu.edu.tw/ Computer Science Passed
Site 5 http://www.ntnu.edu.tw/spe/news.html Special Education Passed
Site 6 http://dpts.nttu.edu.tw/sped/contents/news/news_list.asp?menuID=1 Special Education Observed
Site 7 http://dept.hku.edu.tw/mis/ Information Management Failed
Site 8 http://ibd.ndhu.edu.tw/main.php International Business Passed
Site 9 http://fll.hcu.edu.tw/front/bin/home.phtml Foreign Language Observed
Site 10 http://social.tmue.edu.tw/front/bin/home.phtml Social Studies Education Passed
Site 11 http://doflal.niu.edu.tw/news/news.php?class=101 Foreign Language Passed
Site 12 http://www.im.knu.edu.tw/cht/main.asp Information Management Observed
Site 13 http://www.ntcu.edu.tw/sse/webweb/index2.html Social Studies Education Passed
Site 14 http://www.iba.leader.edu.tw/ International Business Observed
Site 15 http://www.dwu.edu.tw/~information/mis95/index-2.htm Information Management Failed
Site 16 http://ib.toko.edu.tw/newsite/index.asp International Business Failed
Site 17 http://social.ntue.edu.tw/home.htm Social studies Education Observed
Site 18 http://spec.tmue.edu.tw/front/bin/home.phtml Special Education Observed
Site 19 http://www.ncyu.edu.tw/csie/ Computer Science Observed
Site 20 http://www.fl.chu.edu.tw/news.htm Foreign Language Failed
Site 21 http://dpts.nttu.edu.tw/soc/contents/news/news_list.asp?menuID=285 Social Studies Education Observed
Site 22 http://sped.ncue.edu.tw/sped/ Special Education Passed
Site 23 http://dept.hku.edu.tw/iba/index1.htm International Business Failed
Site 24 http://www.csie.ndhu.edu.tw/webv3/cht/?board=news&main=news_bd01 Computer Science Passed
4.2.2 Consistence of Data Collection
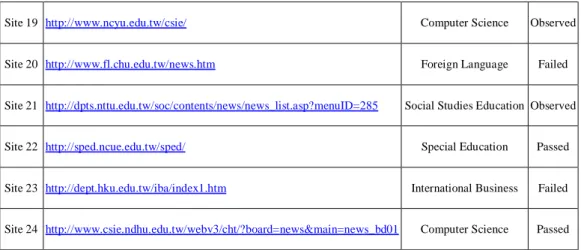
In this subsection, we introduce the data collection of each website. The evaluator using our system has two situations that we have to remove data on data cleaning before executing the FCM calculation step. One is that the evaluator forgetting to setup his browser’s proxy setting, but filled the Palmer’s questionnaire after he finished his browsing activities. The other one is that the evaluator forgetting to fill the questionnaire up after he finished his browsing activities, but the evaluator still uses our proxy. So we query the proxy log of every account and the questionnaire record by databases, then we determined both of above with a consistence. We list the two situations and intersection of each website’s account summary in Table 4-7.
Table 4-7 Intersection Summaries
Website Proxy accounts Questionnaires Intersection accounts Website Proxy accounts Questionnaire Summary Intersection accounts
Site 1 80 40 30 Site 13 12 9 4
Site 2 59 23 15 Site 14 16 6 5