Time trend analysis of the prevalence and incidence of diagnosed asthma and traditional Chinese medicine use among adults in Taiwan from 2000 to 2011: aA
population-based study
Yi-Chun Ma 1, 2, Cheng-Chieh Lin3,4,5, Sing-Yu Yang6, Hsuan-Ju Chen 7, Tsai-Chung Li6,8*, Jaung-Geng Lin1*
1. Graduate Institute of Chinese Medicine, College of Chinese Medicine, China Medical University, Taichung, Taiwan
2. Tai-An Hospital, Taichung, Taiwan
3. Department of Family Medicine, China Medical University Hospital, Taichung, Taiwan 4. School of Medicine, College of Medicine, China Medical University, Taichung, Taiwan 5. Department of Medical Research, China Medical University Hospital, Taichung, Taiwan 6. Graduate Institute of Biostatistics, China Medical University, Taichung, Taiwan 7. Management Office for Health Data, China Medical University Hospital,
Taichung, Taiwan
8. Department of Healthcare Administration, College of Medical and Health Science, Asia University, Taichung, Taiwan
* Corresponding authors: Tsai-Chung Li and Jaung-Geng Lin
China Medical University, No.91 Hsueh-Shih RoadXueshi Road, Taichung, 40402, Taiwan, Tel: 886-4-2205-3366 ext. 6605, Fax: 886-4-2207-8539, e-mail:
tcli@mail.cmu.edu.tw; jglin@mail.cmu.edu.tw
Disclosure: The authors have reported no conflicts of interest.
Short title: Time trend analysis of the prevalence and incidence of asthma
Funding: This study is supported in part by Taiwan Ministry of Health and Welfare Clinical Trial and Research Center of Excellence (MOHW 104-TDU-B-212-113002) and China Medical University under the Aim for Top University Plan of the Ministry of Education, Taiwan and China Medical University (A-6-1). The funders had no role in study design, data collection and analysis, decision to publish, or preparation of the manuscript.
Abstract
Background: The aim of this study was to determine the annual trends of traditional
Chinese medicine (TCM) use for prevalent and incident asthmatic adults in Taiwan
from 2000 to 2011. The annual prevalence and incidence of asthma in adults among
subgroups of sociodemographic factors were also investigated.
Methods: A population-based study was conducted using a random sample with one
million beneficiaries of all residents aged ≥18 years enrolled in the National Health
Insurance program. Adults diagnosed with asthma were identified from the National
Health Insurance Research Database. The annual prevalence and incidence of asthma
in the adult population were estimated by using International Classification of
Diseases, Ninth Revision, Clinical Modification diagnostic codes to identify relevant
cases from 2000 to 2011.
Results: The number of annual prevalent cases of diagnosed asthma increased from
56,885 in 2000 to 101,535 in 2011. The prevalence increased significantly on annual
basis, whereas the incidence rate fluctuated over time. The prevalence of TCM use by
adults with asthma decreased significantly (p<0.05), from 38.58% in 2000 to 29.26%
in 2011. The number of annual incident cases of diagnosed asthma decreased from
3,896 in 2000 to 2,684 in 2011. TCM use rates in asthma incident adults decreased
significantly (p<0.05), from 54.24% in 2000 to 38.19% in 2011.
Conclusion: The prevalence of TCM utilization is high among adults with asthma in
Taiwan. However, our study demonstrated a substantial decrease in the annual
prevalence of TCM use by prevalent and incident asthmatic adults in Taiwan from
2000 to 2011. In addition, the prevalence of TCM use was higher among incident
cases, compared with those with prevalent cases.
Keywords: traditional Chinese medicine use, asthma, prevalence, incidence, time trend analysis
IntroductionBACKGROUND
Asthma is a chronic inflammatory respiratory disease with partially or
completely reversible airway obstruction. The most common symptoms are coughing,
dyspnea, and chest tightness. Worldwide estimates of the prevalence of adult asthma
vary widely, from 0.8% to 13.4%.[1] Ethnicity and demographic and environmental
factors may contribute to these diverse variations. Asthma is a major chronic disease
in Asia and the epidemiological burden of the disease has been investigated in
children. Few studies have followed this line of study in Asian adults, particularly in
ethnic Chinese people.
Asthma is associated with adverse outcomes, which could lead to inability to
work, hospitalization, disability, and morbidity. The disease places a heavy burden on
governments, health care systems, patients, and their families. In Taiwan, the severity
of asthma increases after 18 years of age and the mortality is high in the elderly.[2]
The health care costs for hospital outpatient visits, urgent visits and hospitalization in
adults with asthma are above 2 times of those without asthma.[3] Thus, investigating
the prevalence and incidence of asthma in adults is crucial. However, though
Taiwan,[4-8] studies of the epidemiology of asthma among adults are scant. Only
three previous studies have investigated the prevalence of adult asthma in Taiwan,
and only one has examined the incidence. Among these studies, one enrolled a
population of all ages and used imprecise estimates of prevalence of adult asthma,[9]
and the others were based on small local populations with limited nationwide
representativeness or used a questionnaire design with limited diagnostic validity and
recall bias.[10-12] More recent data based on large sample sizes is required to more
accurately determine the prevalence and incidence of asthma among adults in Taiwan.
Furthermore, some existing demographics factors must be investigated to refine these
prevalence and incidence estimates. This study could assist in identifying potential
risk factors and planning public health policy.
The current treatment suggested for asthma is aimed at controlling the disease,
such as through an inhaled corticosteroid or the combined use of an inhaled
corticosteroid and a long-acting β2 agonist or leukotriene receptor antagonist. Some
patients worry about the adverse effects of these drugs and thus seek integrated or
alternative treatments. Using traditional Chinese medicine (TCM) to treat asthma is
common in Taiwan, with asthma-related visits accounting for approximately 3.5% of
visits to TCM practitioners between 1996 and 2001.[13] Hence, using a
comprehensive nationwide database to evaluate the time trends of TCM utilization in
prevalent and incident asthmatic adults in Taiwan is necessary.
In Taiwan, the National Health Insurance (NHI) program provides universal
health insurance. Implemented by the NHI Administration of the Ministry of Health
and Welfare, the NHI program was initiated in March 1995 and now covers
approximately 99% of the 23.74 million residents of Taiwan.[14] Besides, TCM
health care is also covered by the NHI program in Taiwan and TCM is prescribed by
licensed TCM physicians. The National Health Insurance Research Database
(NHIRD), one of the largest insurance databases in the world, includes
comprehensive information on beneficiaries’ demographic data, clinical visit dates,
diagnostic codes, prescription details, expenditure amounts, and other data. NHIRD
recorded the entire information of TCM prescriptions, which includes drug names,
drug doses, and administration days. The database is publicly available and released
by the NHI for research. This study used nationwide NHI claims data to determine the
annual trends of TCM utilization for prevalent and incident asthmatic adults in
Taiwan from 2000 to 2011. We also estimated the time trends in the prevalence and
incidence of adult asthma and investigated the sociodemographic factors that may
explain the changes in these prevalence and incidence estimates.
Materials and MethodsETHODS
Data sources
The NHIRD contains claims data of one million beneficiaries randomly selected
from all residents aged ≥18 years enrolled in the NHI program between 2000 and
2011. The International Classification of Disease, Ninth Revision, Clinical
Modification (ICD-9-CM) was used to identify diseases. The study population for
each specific year was defined. All data were anonymized upon inclusion in the
NHIRD. Our study was exempted from institutional review board approval by the
Public Health, Social and Behavioral Science Committee Research Ethics Committee
of China Medical University Hospital.
Incident and prevalent asthma diagnoses
Adults diagnosed with asthma between 2000 and 2011 were identified from
claims data sets. If adults had at least three outpatient visits for asthma (ICD-9-CM
code 493 or A code A323) or at least one inpatient visit for asthma diagnosis in one
year, they were defined as an asthma prevalent case in that specific year. Incident
cases were those in which patients had no asthma diagnoses in the claims data sets of
the calendar year before their first asthma diagnosis. The NHIRD contained all health
care claims data since 1996. Incident cases between January 1, 2000 and December
31, 2011 were ascertained. The date of the first outpatient visit or hospital admission
that met the definition for asthma, whichever came first, was used as the incident
event date. Patients remained classified as prevalent cases if they remained in the data
set.
TCM use for asthma and sociodemographic factors
TCM use, specifically for treating asthma, was estimated. Only TCM ambulatory
care was analyzed in this study, because the NHI does not cover TCM prescriptions
for inpatient care.
The sociodemographic factors studied included age, sex, insurance premium, and
urbanization level of residence area. Age was categorized into five levels: 18–30, 30–
40, 40–50, 50–60 and ≥60 years. Insurance premiums were determined according to
monthly salary and categorized into four levels: NT$0–20,000, NT$20,000–40,000,
NT$40,000–60,000, and ≥NT$60,000. The residential areas of the patients were
classified into seven levels of urbanization, according to the method developed by Liu
et al. [15]
Statistical analysis
The annual prevalence and incidence rates of clinically diagnosed asthma in
adults between 2000 and 2011 were estimated. The prevalence of TCM use among
prevalent and incident asthma adults was also evaluated. The estimates of the annual
prevalence rates according to sociodemographic categories were obtained by dividing
the number of prevalent adults of asthma in a year by the number of adults enrolled in
the NHI program in that year. The annual incidence rates were estimated according to
sociodemographic categories by dividing the number of adults newly diagnosed with
asthma in a year by the number of adults enrolled in the NHI program who did not
have asthma at the beginning of that year.
The prevalence and incidence rates of adult asthma were adjusted using a direct
standardization method that employs the sex- and age-specific rates of each year, and
the sex and age distributions of the study population for the year 2000. Multivariate
Poisson regression models were used to analyze the trends in prevalence and
incidence over time while controlling for sex, insurance premium salary level, and
urbanization level changes.
Results
A total of 102,875 patients with asthma in the NHIRD between 2000 and 2011
were identified as prevalent diagnosed cases. The mean age of the prevalent
diagnosed cases was 56.82 years, with a standard deviation (SD) of 20.78. The mean
age at death for persons who were dead annually from the source population of
prevalent cases was 68.2 years (SD: 20.0 years) in 2000 and 76.9 years (15.2 years) in
2011 and the corresponding values for persons who were dead annually from the
source population of incident cases was 69.2 years (20.9 years) in 2000 and 77.8 years
(14.3 years) in 2011. The source population from which the prevalence was estimated
was 751,514 in 2000 and 880,902 in 2011.
The crude annual prevalence of diagnosed asthma increased 34.35% over the study
period, from 7.57% of the adult population in 2000 to 11.53% in 2011 (Table 1).
After direct standardization of the population in 2000, the annual standardized
prevalence rates, which were slightly lower than the crude rates, increased over time.
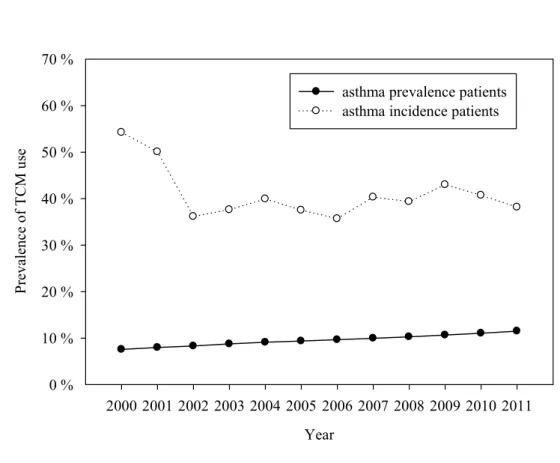
TCM use prevalence by asthma prevalent adults decreased significantly (p for trend
<0.05), from 38.58% in 2000 to 29.26% in in 2011 (Figure 1). Higher annual asthma
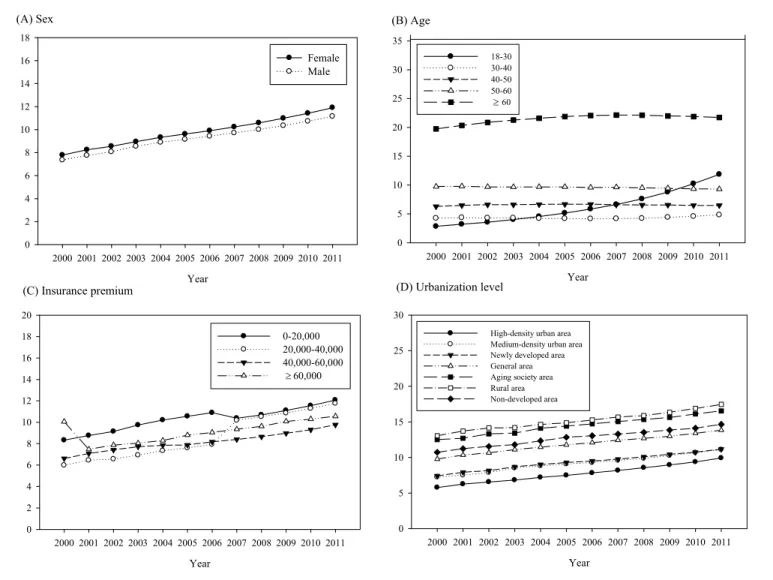
prevalence rates were observed in patients who were aged ≥60 years, female, had a
low insurance premium salary level, or resided in a rural area or aging society. The
annual prevalence rate increased dramatically in the group aged 18–30 years, from
2.84% in 2000 to 11.85% in 2011 (Figure 2).
The number of annual incident asthma diagnoses decreased from 3,896 in 2000 to
2,684 in 2011 (Table 1). The mean age of incident patients was 54.49 years, with an
SD of 18.31. The crude annual incidence fluctuated between 0.29% and 0.56%
throughout the study duration. After direct standardization of the Taiwanese
population in 2000, annual incidence rates decreased gradually and then slightly
increased after 2009. The rate of TCM use by asthma-incident adult decreased from
54.24% in 2000 to 36.17% in 2002 and then fluctuated between 35.70% and 43.01%
throughout the rest of the study duration (Figure 1). Higher annual asthma incidence
rates were observed in patients who were aged ≥60 years, female, or resided in areas
with low urbanization levels, such as an aging society and rural and undeveloped
areas (Figure 3).
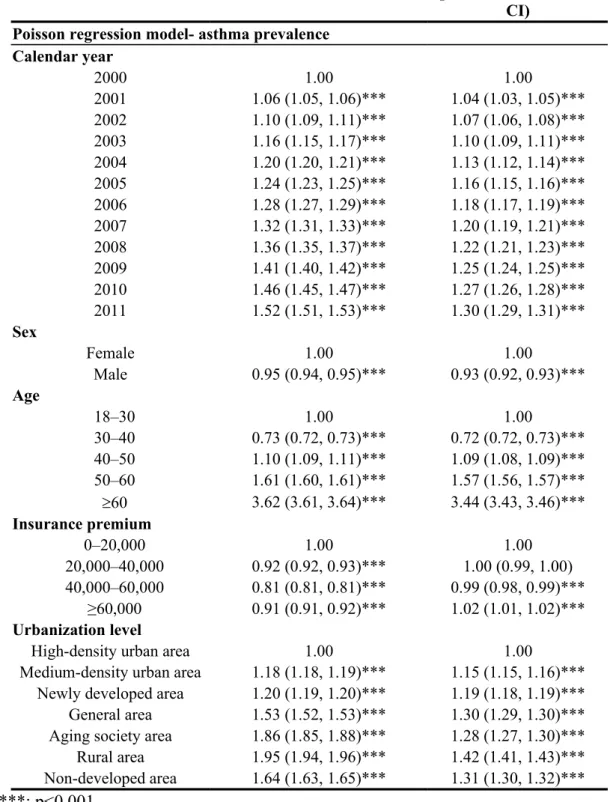
After multivariate adjustment, asthma prevalence was significantly associated with
age (prevalence ratio [PR]: 1.31, 95% confidence interval [CI]: 1.27-1.35; 1.58, 1.53-
1.63; 2.56, 2.48-2.64; and 4.69, 4.57-4.82 for the groups aged 30-40, 40-50, 50-60,
and ≥60 years, respectively; Table 2). The prevalence increased annually with
increasing relative risk (RR) as calendar year being treated as an ordinal variable
(P<0.05). Prevalence was generally low among male patients (0.93, 0.92-0.93). The
other major factors associated with prevalence rates were insurance premium salary
level (0.99, 0.98-0.99 and 1.02, 1.01-1.02 for NT$40,000-60,000 and ≥NT$60,000,
respectively) and urbanization level (1.15, 1.15-1.16; 1.19, 1.18-1.19; 1.30, 1.29-1.30;
1.28, 1.27-1.30; 1.42, 1.41-1.43; and 1.31, 1.30-1.32 for medium-density urban areas,
newly developed areas, general areas, aging society, rural areas, and undeveloped
areas, respectively). If we considered a trivial increase in the measure of association
as a RR of less than 1.1 or greater than 0.91 [16] and a moderate or weak association
as a RR of less than 3 or greater than 0.33 [17], the magnitude of association for age
group of 60 years was strong, for sex and insurance premium level was trivial, and for
calendar year, and urbanization level was weak.
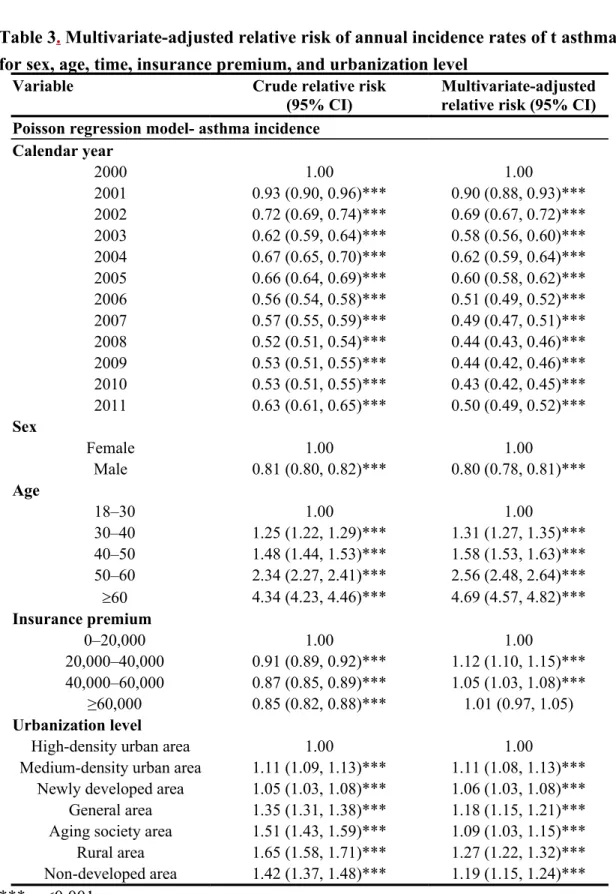
Annual asthma incidence rates in adults fluctuated rather than followed a linear
trend. Thus, considering time as an ordinal variable, we did not observe a significant
annual increase in the incidence rate. The incidence rates among male adults were
lower (RR: 0.80, 95% CI: 0.78-0.81). The other major factors associated with
increasing incidence rates were age (1.31, 1.27-1.35; 1.58, 1.53-1.63; 2.56, 2.48-2.64;
and 4.69, 4.57-4.82 for 30-40, 40-50, 50-60, and ≥60 years, respectively; Table 3),
insurance premium salary level (1.12, 1.10-1.15 and 1.05, 1.03-1.08 for NT$20,000-
40,000 and NT$40,000-60,000, respectively), and urbanization level (1.11, 1.08-1.13;
1.06, 1.03-1.08; 1.18, 1.15-1.21; 1.09, 1.03-1.15; 1.27, 1.22-1.32; and 1.19, 1.15-1.24
for the medium-density urban areas, newly developed areas, general areas, aging
society, rural areas, and undeveloped areas, respectively). Among these significant
factors associated with incidence, the magnitude of association for age group of 60
years was strong, for insurance premium level was trivial, and for calendar year, gender,
and urbanization level was weak.
Discussion
This is the first study to use nationwide NHI claims data to analyze annual trends
of prevalence and incidence of adult asthma diagnoses and annual trends of TCM use
among prevalent and incident asthma adults. Increases from 2000 to 2011 of 34.35%
and 28.38% in the crude and age- and sex-standardized annual prevalence rates,
respectively, were observed. This increasing trend in prevalence suggested that the
disease burden may rise in the near future. Both the annual crude and standardized
incidence rates fluctuated during the same period. The TCM use prevalence exhibited
a decreasing trend and was much higher among incident than among prevalent
asthma.
Regarding the prevalence of adult asthma in Taiwan, a nationwide study of
adults and children from 2000 to 2007 reported an overall 8-year prevalence of 11.9%
in the study population.[9] In addition, two previous studies were conducted in local
populations through questionnaires. One of these studies reported adult bronchial
asthma prevalence of 4.1% in Taipei City in 2004.[10] The other study reported
asthma prevalence rates of 0.83% and 1.36% for men and women in Southern Taiwan
in 2004.[11] Our estimates are closer to those of the nationwide study, and are much
higher than those of the local population studies. Two possible explanations may
account for these differences: geographic variation and measurement methodology.
Regarding the incidence rate of asthma, the only previous related research was a local
study that used questionnaires to estimate the incidence of adult asthma in Southern
Taiwan in 2004.[12] The study reported incidence rates of 0.45, 0.83, 1.45, and 2.03
per 1,000 person-years in the groups aged 19–25, 26–30, 31–35, and 36–40 years,
which are similar to our results. In this study, we used a different approach, namely
retrospectively analyzing nationwide NHI claims data, to determine the annual
prevalence and incidence of adult asthma diagnoses between 2000 and 2011.
Our study revealed significant increases in annual prevalence during 2000–2011.
By contrast, annual incidence rates fluctuated throughout this period, and showed an
overall decreasing trend. The asthma mortality rate has steadily decreased in Taiwan
in the past decades, particularly among individuals aged ≥35 years.[18] Thus,
improved asthma care with longer survival and more effective prevention methods
may explain the increasing prevalence and decreasing incidence.
According to our estimates, the prevalence of adult asthma in Taiwan is
relatively high. In the similar periods, our estimated prevalence rate was similar to
those in Scotland (8.5%), the United States (7.21%-8.52%), and the United Arab
Emirates (8%-12%); higher than those in Bangladesh (3.9%), China (0.8%-1.0%),
Finland (3.5%), Hong Kong (5.8%), India (1.9%-2.9%), Iran (1.4%-6.1%), Japan
(3.4%-4.2%), South Korea (2.4%-5.8%), Singapore (5.1%), and Thailand (2.9%); and
lower than that in South Australia (12.2%-13.4%).[1,19,20] We observed a significant
increasing trend in the prevalence of adult asthma in Taiwan, which has also been
reported in South Australia, Finland, Hong Kong, Japan, South Korea, Scotland, and
the United States.[1,19,20] As shown, Taiwan has one of the highest adult asthma
prevalence rates in Asia. Despite the presence of environmental factors, such as high
humidity, a subtropical climate, dense population, and air pollution [21] and rapid
economic development, all of which are associated with increased risk of asthma,
effective asthma care and decreasing mortality may explain the high and increasing
prevalence.
Studies in other countries and regions have shown that the pooled rate of
incidence asthma was approximately 4.6 per 1,000 person-years in women and 3.6 per
1,000 person-years in men and implied a trend of increasing incidence.[22] These
rates were lower than our estimates for 2000–2001 but slighter higher than those for
2002-2011. According to our estimates, Taiwan has a relatively low asthma incidence
rate. The incidence of asthma fluctuated during the study period and exhibited an
overall decreasing trend, indicating the effectiveness of anti-air pollution efforts,
including air pollution monitoring and warning systems and the regulation of air
pollutant emissions by industry and traffic vehicles.
In our study, higher annual prevalence and incidence rates were observed in
women, older people, low-income earners, and residents of rural areas. Recent
epidemiologic studies worldwide have reported the prevalence of asthma in elderly
populations as ranging from 4.5% to 12.7%.[23] Similarly, we observed high asthma
prevalence and incidence rates in the group aged ≥60 years. The burden of asthma is
greater on elderly people in mortality, hospitalization, and medical costs.[2] Thus,
health promotion programs for asthma should be targeted at the elderly population.
Our study demonstrated that the prevalence of TCM use revealed a decreasing
trend during the study period and was higher in incident (36.17-54.24) than in
prevalent (29.26-38.59) adults with asthma. These findings may imply that adults with
newly diagnosed asthma were more willing to receive or seek TCM as an alternative
or supplemental treatment for asthma. Another possible explanation is that poor
adherence to medications is a common problem among patients with chronic diseases
and thus the prevalence of TCM use was lower among patients with longer asthma
duration. A previous study showed that 85.7% of adults with asthma in Taiwan used
TCM, which is a higher rate than that observed in the present study. Two possible
reasons may explain the lower prevalence of TCM use in our study. First, the previous
study estimated period prevalence, whereas we estimated annual prevalence. Second,
we estimated TCM use prevalence specifically for treating asthma, whereas the
previous study estimated TCM use prevalence among all patients with asthma, some
of whom may have used TCM to treat conditions other than asthma. In addition, the
previous study identified patients aged 20–29 years, residing in Northern and Central
Taiwan, and with a monthly salary of NT$20,000–39,999 as being more likely to use
TCM.[24] By contrast, the asthma-susceptible subgroups identified in this study,
namely older patients, low-income earners, and residents of rural areas, were not
common TCM users. This finding has critical implications for the planning of TCM
promotion strategies, particularly those aimed at the target population. A major drop
of prevalence of TCM use in incident adult with asthma from 50.07% in 2001 to
36.17% in 2002 was noted in this study. This can be explained by the introduction of
inhaled steroid and long-acting β2 agonist combination Seretide or Symbicort in
Taiwan since 2001, which changed the medical use condition.
The present study has several strengths. First, we provided valid and precise
prevalence and incidence estimates because the nationwide sample we used is
representative and large. Furthermore, this large sample size also facilitated subgroup
stratified analysis, providing a more precise description of the prevalence and
incidence rate estimates. Second, our study determined the annual prevalence and
incidence trends of asthma in a Chinese adult population, literature about which was
limited. Third, we investigated several sociodemographic factors that facilitate public
health policy making and planning for health care utilization by asthma-susceptible
groups. Fourth, we inspected the current TCM use by prevalent and incident asthmatic
adults in Taiwan. Fifth, the NIH program in Taiwan covers nearly the entire
population, thereby avoiding selection bias.
The limitations of this study warrant note. First, the study depended on claims
data exclusively, which may result in the potential intentional or unintentional
misclassification of diseases. To counter this, we included only patients who had at
least three outpatient visits or at least one inpatient admission claim with an asthma
diagnosis; thus, the prevalence and incidence may have been underestimated. Second,
data on the severity of asthma, lung function, and laboratory tests were not available
in the claims database; thus, combining this information with the prevalence and
incidence data was beyond the scope of this study.
Conclusion
This study showed that the annual prevalence of asthma among adults in Taiwan
increased from 2000 to 2011, whereas the annual incidence fluctuated and showed an
overall descending trend. TCM use by adults with asthma was common, but its annual
trend had decreased. Appropriate health promotion programs are recommended,
particularly for women, older patients, low-income earners, and residents of rural
areas. Furthermore, more studies using large samples should be conducted to evaluate
the cost-effectiveness of using TCM to treat asthma in adults.
Author CContributions
Conceived and designed the experiments: YCM, TCL, JGL. Analyzed the data:
SYY, HJC. Contributed reagents/materials/analysis tools: CCL, TCL, JGL. Wrote the paper: YCM, TCL.
Reference
1. Anandan C, Nurmatov U, van Schayck OC, Sheikh A (2010) Is the prevalence of asthma declining? Systematic review of epidemiological studies. Allergy 65: 152-167.
2. Hsiao HJ, Wang LC, Yang YH, Lee JH, Yu HH, et al. (2013) A nationwide survey of the severity, comorbidity, and mortality of hospitalized patients with asthma in Taiwan. Pediatr Neonatol 54: 254-260.
3. Sun HL, Lue KH (2008) Health care utilization and costs of adult asthma in Taiwan. Allergy Asthma Proc 29: 177-181.
4. Hsieh KH, Shen JJ (1988) Prevalence of childhood asthma in Taipei, Taiwan, and other Asian Pacific countries. J Asthma 25: 73-82.
5. Tang RB, Tsai LC, Hwang HM, Hwang B, Wu KG, et al. (1990) The prevalence of allergic disease and IgE antibodies to house dust mite in schoolchildren in Taiwan. Clin Exp Allergy 20: 33-38.
6. JH Wu LR, Hsieh KH (1998) Adolescent Asthma in Northern Taiwan. Chinese Journal of Public Health 17: 214-225.
7. WC Wang KL, JN Sheu (1998) Allergic diseases in preschool children in Taichung city. Acta Paed Sin 39: 314-318.
8. Chang LT LY, Tang CS (2006) The prevalence of asthma in elementary school children in eight towns of Taipei county, Taiwan. Fu-Jen Journal of Medicine 4: 61-72.
9. Hwang CY, Chen YJ, Lin MW, Chen TJ, Chu SY, et al. (2010) Prevalence of atopic dermatitis, allergic rhinitis and asthma in Taiwan: a national study 2000 to 2007. Acta Derm Venereol 90: 589-594.
10. Jan IS, Chou WH, Wang JD, Kuo SH (2004) Prevalence of and major risk factors for adult bronchial asthma in Taipei City. J Formos Med Assoc 103:
259-263.
11. Lee YL, Hsiue TR, Lee CH, Su HJ, Guo YL (2006) Home exposures, parental atopy, and occurrence of asthma symptoms in adulthood in southern Taiwan. Chest 129: 300-308.
12. Wu TJ, Wu CF, Lee Y, Hsiue TR, Guo Y (2014) Asthma incidence, remission,
relapse and persistence: a population-based study in southern Taiwan.
Respir Res 15: 135.
13. Chen FP, Chen TJ, Kung YY, Chen YC, Chou LF, et al. (2007) Use frequency of traditional Chinese medicine in Taiwan. BMC Health Serv Res 7: 26.
14. Lu J F, WC. H (2003) Does universal health insurance make health care unaffordable? Lessons from Taiwan. Health Aff (Millwood) 22: 77-88.
15. Liu CY HY, Chuang YL, Chen YJ, Weng WS, Liu JS, Liang KY (2006) Incorporating development development stratification of Taiwan into sampling design of large scale health interview survey. J Heal Manag 4: 1- 22.
16. Aschengrau A, Seage GR (2013) Essentials of Epidemiology in Public Health:
Jones & Bartlett Learning.
17. Boffetta P (2010) Causation in the Presence of Weak Associations. Critical Reviews in Food Science and Nutrition 50: 13-16.
18. Kuo LC, Shau WY, Yang PC, Kuo SH (2003) Trends in asthma mortality in Taiwan, 1981-2000. J Formos Med Assoc 102: 534-538.
19. Song WJ, Kang MG, Chang YS, Cho SH (2014) Epidemiology of adult asthma in Asia: toward a better understanding. Asia Pac Allergy 4: 75-85.
20. Zhang X, Morrison-Carpenter T, Holt JB, Callahan DB (2013) Trends in adult current asthma prevalence and contributing risk factors in the United States by state: 2000-2009. BMC Public Health 13: 1156.
21. Pan HH, Chen CT, Sun HL, Ku MS, Liao PF, et al. (2014) Comparison of the effects of air pollution on outpatient and inpatient visits for asthma: a population-based study in Taiwan. PLoS One 9: e96190.
22. Eagan TM, Brogger JC, Eide GE, Bakke PS (2005) The incidence of adult asthma: a review. Int J Tuberc Lung Dis 9: 603-612.
23. Yanez A, Cho SH, Soriano JB, Rosenwasser LJ, Rodrigo GJ, et al. (2014) Asthma in the elderly: what we know and what we have yet to know. World Allergy Organ J 7: 8.
24. Wang HM, Lin SK, Yeh CH, Lai JN (2014) Prescription pattern of Chinese herbal products for adult-onset asthma in Taiwan: a population-based study. Ann Allergy Asthma Immunol 112: 465-470.
Figure 1. Time trends in the prevalence of TCM use among asthma prevalent and incident patients
Figure 2. Time trends in the prevalence of asthma stratified by (A) sex (B) age (C) insurance premium (D) urbanization level
Figure 3. Time trends in the incidence of asthma stratified by (A) sex (B) age (C) insurance premium (D) urbanization level
Table 1. Prevalence and incidence of asthma in Taiwan
2000 2001 2002 2003 2004 2005 2006 2007 2008 2009 2010 2011 Prevalence rates of asthma
Prevalent cases 56,885 60,593 64,266 67,709 70,195 75,081 78,767 82,551 86,650 91,096 95,952 101,535 Age (year) 55.1±18.7 55.4 ±19.0 55.9±19.4 56.6±19.6 57.1±19.9 57.2±20.4 57.4±20.8 57.6±21.2 57.6±21.8 57.5±22.3 57.3±22.9 57.1±23.4 Age at death (year) 68.2±20.0 72.9 ±14.0 74.7±12.0 75.2±12.1 76.6±11.4 75.8±12.9 75.3±13.5 76.4±13.4 76.5±14.3 76.7±13.5 76.7±15.0 76.9±15.2 Total population 751,514 758,012 773,155 773,213 770,002 799,830 814,823 827,555 841,577 854,044 867,049 880,902
Prevalence rate (%) 7.57 7.99 8.31 8.76 9.12 9.39 9.67 9.98 10.30 10.67 11.07 11.53
Standardized prevalence rate
(%) 7.57 7.84 8.02 8.23 8.43 8.65 8.86 9.08 9.35 9.69 10.09 10.57
Prevalence of TCM use (%) 38.58 37.29 35.27 34.64 34.72 33.01 31.23 31.41 30.84 31.24 29.86 29.26
Age
18–30 2.84 3.20 3.55 4.01 4.54 5.14 5.84 6.62 7.60 8.78 10.24 11.85
30–40 4.24 4.36 4.28 4.30 4.21 4.19 4.15 4.17 4.22 4.39 4.56 4.82
40–50 6.28 6.48 6.58 6.59 6.63 6.67 6.66 6.59 6.54 6.54 6.48 6.47
50–60 9.73 9.79 9.67 9.66 9.68 9.67 9.57 9.62 9.52 9.43 9.33 9.29
60 19.75 20.33 20.86 21.27 21.58 21.86 22.06 22.12 22.11 21.99 21.88 21.72
Sex
Female 7.79 8.25 8.56 8.95 9.33 9.62 9.91 10.24 10.59 10.99 11.42 11.91
Male 7.36 7.75 8.08 8.56 8.90 9.16 9.43 9.72 10.01 10.35 10.73 11.16
Insurance premium
0–20,000 8.33 8.76 9.14 9.74 10.21 10.56 10.89 10.38 10.69 11.10 11.55 12.07
20,000–40,000 5.98 6.45 6.56 6.93 7.34 7.60 7.93 10.18 10.52 10.86 11.29 11.76
40,000–60,000 6.62 7.08 7.42 7.71 7.85 7.88 8.17 8.39 8.65 8.97 9.30 9.76
60,000 10.05 7.47 7.87 8.05 8.29 8.80 9.04 9.35 9.62 10.08 10.29 10.56
Urbanization level
High-density urban area 5.78 6.25 6.56 6.82 7.20 7.49 7.83 8.18 8.56 8.95 9.38 9.92
Medium-density urban area 7.24 7.52 7.87 8.52 8.82 9.07 9.28 9.58 9.86 10.26 10.67 11.09
Newly developed area 7.42 7.92 8.15 8.69 9.01 9.29 9.50 9.75 10.09 10.44 10.74 11.16
General area 9.77 10.33 10.65 11.1 11.44 11.77 12.08 12.42 12.68 12.97 13.40 13.83
Aging society area 12.51 12.69 13.32 13.42 14.10 14.41 14.72 15.04 15.33 15.62 16.11 16.53
Rural area 13.05 13.70 14.14 14.19 14.64 14.87 15.26 15.68 15.88 16.35 16.88 17.46
Non-developed area 10.73 11.23 11.55 11.80 12.33 12.83 13.05 13.29 13.54 13.84 14.11 14.66
Table 2. Multivariate-adjusted relative risk of annual prevalence of asthma rates for sex, age, time, insurance premium, and urbanization level
Variable Crude prevalence ratio
(95% CI)
Multivariate-adjusted prevalence ratio (95%
CI) Poisson regression model- asthma prevalence
Calendar year
2000 1.00 1.00
2001 1.06 (1.05, 1.06)*** 1.04 (1.03, 1.05)***
2002 1.10 (1.09, 1.11)*** 1.07 (1.06, 1.08)***
2003 1.16 (1.15, 1.17)*** 1.10 (1.09, 1.11)***
2004 1.20 (1.20, 1.21)*** 1.13 (1.12, 1.14)***
2005 1.24 (1.23, 1.25)*** 1.16 (1.15, 1.16)***
2006 1.28 (1.27, 1.29)*** 1.18 (1.17, 1.19)***
2007 1.32 (1.31, 1.33)*** 1.20 (1.19, 1.21)***
2008 1.36 (1.35, 1.37)*** 1.22 (1.21, 1.23)***
2009 1.41 (1.40, 1.42)*** 1.25 (1.24, 1.25)***
2010 1.46 (1.45, 1.47)*** 1.27 (1.26, 1.28)***
2011 1.52 (1.51, 1.53)*** 1.30 (1.29, 1.31)***
Sex
Female 1.00 1.00
Male 0.95 (0.94, 0.95)*** 0.93 (0.92, 0.93)***
Age
18–30 1.00 1.00
30–40 0.73 (0.72, 0.73)*** 0.72 (0.72, 0.73)***
40–50 1.10 (1.09, 1.11)*** 1.09 (1.08, 1.09)***
50–60 1.61 (1.60, 1.61)*** 1.57 (1.56, 1.57)***
60 3.62 (3.61, 3.64)*** 3.44 (3.43, 3.46)***
Insurance premium
0–20,000 1.00 1.00
20,000–40,000 0.92 (0.92, 0.93)*** 1.00 (0.99, 1.00) 40,000–60,000 0.81 (0.81, 0.81)*** 0.99 (0.98, 0.99)***
≥60,000 0.91 (0.91, 0.92)*** 1.02 (1.01, 1.02)***
Urbanization level
High-density urban area 1.00 1.00
Medium-density urban area 1.18 (1.18, 1.19)*** 1.15 (1.15, 1.16)***
Newly developed area 1.20 (1.19, 1.20)*** 1.19 (1.18, 1.19)***
General area 1.53 (1.52, 1.53)*** 1.30 (1.29, 1.30)***
Aging society area 1.86 (1.85, 1.88)*** 1.28 (1.27, 1.30)***
Rural area 1.95 (1.94, 1.96)*** 1.42 (1.41, 1.43)***
Non-developed area 1.64 (1.63, 1.65)*** 1.31 (1.30, 1.32)***
***: p<0.001.
Table 3. Multivariate-adjusted relative risk of annual incidence rates of t asthma for sex, age, time, insurance premium, and urbanization level
Variable Crude relative risk
(95% CI)
Multivariate-adjusted relative risk (95% CI) Poisson regression model- asthma incidence
Calendar year
2000 1.00 1.00
2001 0.93 (0.90, 0.96)*** 0.90 (0.88, 0.93)***
2002 0.72 (0.69, 0.74)*** 0.69 (0.67, 0.72)***
2003 0.62 (0.59, 0.64)*** 0.58 (0.56, 0.60)***
2004 0.67 (0.65, 0.70)*** 0.62 (0.59, 0.64)***
2005 0.66 (0.64, 0.69)*** 0.60 (0.58, 0.62)***
2006 0.56 (0.54, 0.58)*** 0.51 (0.49, 0.52)***
2007 0.57 (0.55, 0.59)*** 0.49 (0.47, 0.51)***
2008 0.52 (0.51, 0.54)*** 0.44 (0.43, 0.46)***
2009 0.53 (0.51, 0.55)*** 0.44 (0.42, 0.46)***
2010 0.53 (0.51, 0.55)*** 0.43 (0.42, 0.45)***
2011 0.63 (0.61, 0.65)*** 0.50 (0.49, 0.52)***
Sex
Female 1.00 1.00
Male 0.81 (0.80, 0.82)*** 0.80 (0.78, 0.81)***
Age
18–30 1.00 1.00
30–40 1.25 (1.22, 1.29)*** 1.31 (1.27, 1.35)***
40–50 1.48 (1.44, 1.53)*** 1.58 (1.53, 1.63)***
50–60 2.34 (2.27, 2.41)*** 2.56 (2.48, 2.64)***
60 4.34 (4.23, 4.46)*** 4.69 (4.57, 4.82)***
Insurance premium
0–20,000 1.00 1.00
20,000–40,000 0.91 (0.89, 0.92)*** 1.12 (1.10, 1.15)***
40,000–60,000 0.87 (0.85, 0.89)*** 1.05 (1.03, 1.08)***
≥60,000 0.85 (0.82, 0.88)*** 1.01 (0.97, 1.05) Urbanization level
High-density urban area 1.00 1.00
Medium-density urban area 1.11 (1.09, 1.13)*** 1.11 (1.08, 1.13)***
Newly developed area 1.05 (1.03, 1.08)*** 1.06 (1.03, 1.08)***
General area 1.35 (1.31, 1.38)*** 1.18 (1.15, 1.21)***
Aging society area 1.51 (1.43, 1.59)*** 1.09 (1.03, 1.15)***
Rural area 1.65 (1.58, 1.71)*** 1.27 (1.22, 1.32)***
Non-developed area 1.42 (1.37, 1.48)*** 1.19 (1.15, 1.24)***
***: p<0.001.
Year
2000 2001 2002 2003 2004 2005 2006 2007 2008 2009 2010 2011
Prevalence of TCM use
0 % 10 % 20 % 30 % 40 % 50 % 60 % 70 %
asthma prevalence patients asthma incidence patients
Figure 1 Time trends in the prevalence of TCM use among asthma prevalent and incident patients
Year
2000 2001 2002 2003 2004 2005 2006 2007 2008 2009 2010 2011 0
2 4 6 8 10 12 14 16 18
Female Male
Year
2000 2001 2002 2003 2004 2005 2006 2007 2008 2009 2010 2011 0
5 10 15 20 25 30 35
18-30 30-40 40-50 50-60 60
(A) Sex (B) Age
Year
2000 2001 2002 2003 2004 2005 2006 2007 2008 2009 2010 2011 0
2 4 6 8 10 12 14 16 18 20
0-20,000 20,000-40,000 40,000-60,000 60,000 (C) Insurance premium
Year
2000 2001 2002 2003 2004 2005 2006 2007 2008 2009 2010 2011 0
5 10 15 20 25 30
High-density urban area Medium-density urban area Newly developed area General area Aging society area Rural area Non-developed area
(D) Urbanization level
Figure 2 Time trends in the prevalence of asthma stratified by (A) sex (B) age (C) insurance premium (D) urbanization level
(A) Sex (B) Age
(C) Insurance premium Year (D) Urbanization level
2000 2001 2002 2003 2004 2005 2006 2007 2008 2009 2010 2011 0.0
0.2 0.4 0.6 0.8 1.0
Female Male
Year
2000 2001 2002 2003 2004 2005 2006 2007 2008 2009 2010 2011 0.0
0.2 0.4 0.6 0.8 1.0 1.2 1.4 1.6
18-30 30-40 40-50 50-60
2000 2001 2002 2003 2004 2005 2006 2007 2008 2009 2010 2011 0.0
0.2 0.4 0.6 0.8 1.0
0-20,000 20,000-40,000 40,000-60,000 60,000
Year
2000 2001 2002 2003 2004 2005 2006 2007 2008 2009 2010 2011 0.0
0.2 0.4 0.6 0.8 1.0 1.2
High-density urban area Medium-density urban area Newly developed area General area Aging society area Rural area Non-developed area