國立臺灣大學生命科學院生化科學研究所 博士論文
Graduate Institute of Biochemical Sciences College of Life Science
National Taiwan University Doctoral Dissertation
蛋白質半胱胺酸氧化修飾之偵測與 亞磺酸還原酶抗氧化角色之研究
On Protein Cysteine Oxidation Detection and the Roles of Sulfiredoxin in Antioxidant Responses
李昱蓉 Yu-Jung Lee
指導教授:張震東 博士 Advisor: Geen-Dong Chang, Ph.D.
中華民國 107 年 7 月
July, 2018
謝誌
不同於以往的學習經驗,博士班除了知識與技術上的追求,更多的是自我的
反思與覺察。感謝過程中曾協助與提點我的每一個人,您們寶貴的分享與建議都
使我獲益良多。感謝張老師多年來的指導,也感謝 R403 實驗室的每一位成員,在
紅館的每一天都使我學習與成長。感謝師長們的教誨,以及同儕們的砥礪,更要
感謝家人的支持與包容,您們都是我學習路上重要的力量。
摘要
氧化壓力與許多疾病與生理功能有關,如癌症、心血管疾病、神經退化疾病。
當細胞處於氧化壓力下,蛋白質中半胱胺酸(cysteine)殘基之巰基(thiol group)易受
攻擊產生氧化相關之轉譯後修飾(oxidative post-translational modification),進而影
響其功能與結構特性。因此針對蛋白質半胱胺酸殘基之氧化修飾,已有許多功能
之探討及鑑定工具之開發。
半胱胺酸氧化修飾包括可逆(reversible)修飾如形成雙硫鍵(disulfide)或次磺酸
(sulfenation),在更高的氧化壓力下則可能形成不可逆的亞磺酸和磺酸(sulfination
and sulfonation)。亞磺酸還原酶(sulfiredoxin)為目前被報導唯一可對半胱胺酸亞磺
酸化進行還原的酵素,其已知作用對象為過氧化物還原酶(peroxiredoxin 1-4)。在這
裡我們利用對細胞處理二醯胺 (diamide),以引發針對巰基攻擊的氧化修飾,進而
探討蛋白質半胱胺酸氧化修飾現象。我們在 HeLa 細胞中對二醯胺引發之氧化攻擊
建立基礎了解,包括蛋白質氧化程度改變以及細胞抗氧化反應的啟動。接著我們
再進一步運用此方法探討亞磺酸還原酶之抗氧化功能,利用SRXN1 敲除(knockout)
之HAP-1 細胞和過表現 SRXN1 之 HEK 細胞兩種模式,我們報導了亞磺酸還原酶
對於二醯胺引發之蛋白質氧化修飾具有保護作用,並探討亞磺酸還原酶在抗氧化
原酶(thioredoxin),有交互作用。
此外,我們針對改對良蛋白質半胱胺酸之氧化修飾之標定方式,以發展氧化
程度之定量描述方式。目前對於蛋白質氧化修飾之偵測工具,主要是針對特定修
飾的辨識和捕捉。我們優化PEG- maleimide 之反應條件,對蛋白質還原態之半胱
胺酸殘基進行標記,藉由免疫轉漬(immunoblotting)後積分其訊號以計算氧化的比
例,並提出加權的方式將蛋白質的不同氧化程度計分。我們於生物模型驗證此方
式,如胰島素引發之蛋白質酪胺酸磷酸酶1B (PTP1B)氧化,惟此方法仍受如抗體
辨識區域遮蔽之限制。
關鍵字
半胱胺酸氧化修飾、亞磺酸還原酶、抗氧化反應、二醯胺、定量偵測
Abstract
Oxidative stress is relevant to several physiological functions and diseases, including
cancer, cardiovascular disease, and neural degeneration. The reactive oxygen and
nitrogen species (ROS/RNS) such as hydrogen peroxide arise as by-products of
metabolism, while excessive ROS/RNS results in protein oxidation and signaling which
leads to disease.
Cysteine oxidation is the main post-translational modification associated with redox
signaling and oxidative stress. Reversible cysteine oxidations include disulfide and
sulfenic acid, which will be further oxidized to irreversible sulfinic and sulfonic acid
while facing extreme oxidative stress. Sulfiredoxin is the only reported enzyme that
reduces sulfinic acid on hyperoxidized peroxiredoxin 1 - 4. Herein we treated cells with
diamide, which caused thiol-specific attacks, to investigate the antioxidant role of
sulfiredoxin. Utilizing SRXN1 knockout HAP-1 cells and FLAG-SRXN1
over-expressing HEK cells, we reported a protective role of sulfiredoxin in diamide-
induced protein thiolation, and investigated its interactions with other antioxidant
systems such as thioredoxin and glutathione.
Maleimide-polyethylene glycol (m-PEG) has been used to detect reversibly oxidized
proteins by reacting to the reduced cysteine residues leading to mobility shift in
immunoblots; a method called PEG-switch. Following PEG-switch, both reduced and
oxidized proteins can be observed on the same immunoblot simultaneously, providing a
simple quantitative measurement for protein thiol modifications. We optimized the
assay conditions and exploited the applications of PEG-switch in quantitation of the
extent of protein thiol oxidation in cells in response to H2O2 and insulin. In addition, we
have proposed a redox scoring system for measuring the redox status of any given
protein from the m-PEG immunoblot. Some restrictions of the method are also
indicated.
Keywords
Cysteine oxidative modification, sulfiredoxin, antioxidant response, diamide,
quantitative detection
Index
口試委員會審定書 ...
謝誌 ... i
摘要 ... ii
Abstract ... iv
Index ... vi
Figure List...viii
Table List ...viii
Appendix Index ... ix
Abbreviation List ... x
Chapter I. Investigation of the Antioxidant Role of Sulfiredoxin ... 1
1. Introduction...1
1.1 Oxidative stresses and antioxidant systems in mammalian cells...1
1.2 Protein cysteine residues as the victims of oxidative attacks ...3
1.3 Sulfiredoxin reduces peroxiredoxin sulfinylations ...5
1.4 Specific aims and significances ...7
2. Materials and methods ...9
2.1. Chemicals and antibodies ...9
2.2. Cell culture...9
2.3. SRXN1 knockout, genomic DNA extraction and sequencing ...10
2.4. SRXN1 over-expression ...10
2.5 Cell lysate preparation ... 11
2.6. Fractionation ... 11
2.7. SDS-PAGE, Coomassie blue staining, and immnunoblotting ...12
2.8. Immunofluorescence...12
2.9. RNA extraction and RT-PCR...13
2.10. Immunoprecipitation...13
2.11. Diamide treatment and resin-assisted capture...14
2.12. Hydrogen peroxide-induced oxidation ...15
2.13. MTT assay ...15
2.14. Anti-glutathione antiserum preparation ...15
2.15. Thioredoxin reductase activity assay ...16
2.16. In-gel digestion and protein identification by mass spectrometry ...16
3. Results...20
3.1. Diamide induced reversible thiolations and antioxidant responses ...20
3.2. Sulfiredoxin knockout increased diamide-induced protein thiolations ...22
3.3. Sulfiredoxin knockout affected functions of antioxidant enzymes ...23
3.3.1. Glutathione system ...24
3.3.2. Peroxiredoxin and thioredoxin system ...25
3.4. Diamide treatment induced cytosolic sulfiredoxin dimerization ...26
3.5 Hypothetic mechanism of sulfiredoxin under thiol-specific oxidative attacks ...28
4. Discussion ...29
Chapter II. Development of Quantitative Display of Protein Redox Status... 32
1. Introduction...32
1.1. Detection tools of protein cysteine oxidations...32
1.2. PEG-maleimide as a cysteine-specific probe ...34
1.3. Specific aims and significances ...35
2. Materials and methods ...36
2.1. Chemicals and antibodies ...36
2.2. Cell culture and lysis condition ...36
2.3. PEG-maleimide labeling...37
2.4. SDS-PAGE, immunoblotting and reduced/oxidized ratio calculation...37
2.5. Hydrogen peroxide-induced oxidation ...38
2.6. Insulin-induced PTP1B oxidation in HeLa cell ...38
3. Results...39
3.1. Protocol of PEG tagging ...39
3.2 Optimizing tagging efficiency ...39
3.3. m-PEG tagging in other redox-sensitive proteins...41
3.4. Quantitating the redox status of proteins in cells...42
3.4.1. H2O2-induced peroxiredoxin and Hsp27 oxidations in HEK cell ...44
3.4.2. Insulin-induced PTP1B oxidation in HeLa cell ...45
4. Discussion ...47
Chapter III. Conclusions and Perspectives ... 50
Figures ...52
Tables ...84
References...89
Appendix...96
Figure List
Figure 1: Diamide induced reversible thiolations in HeLa cell ...52
Figure 2: Thiolated targets of diamide treatment...54
Figure 3: Diamide affected redox status of glutathione, NADH and NADPH...55
Figure 4: Diamide triggered Nrf2 translocation and downstream gene expressions ...56
Figure 5: Knockout of SRXN1 led to truncation of sulfiredoxin ...58
Figure 6: Diamide-induced thiolations increased in SRXN1 KO HAP-1 cell ...60
Figure 7: Thiolation of antioxidant enzymes increased in SRXN1 KO HAP-1 cell ...62
Figure 8: Diamide-induced protein glutathionylation and glutathione oxidation increased in SRXN1 KO cell ...63
Figure 9: Activity of thioredoxin reductase increased in SRXN1 KO cell...64
Figure 10: Diamide induced Srx dimerization in SRXN1 over-expressed HEK cell...66
Figure 11: Sulfiredoxin dimerization was found in mitochondria...68
Figure 12: Hypothetic mechanism of sulfiredoxin in diamide-induced oxidation ...69
Figure 13: Reaction of PEG-maleimide with protein cysteine residues causing mobility shift on SDS-PAGE ...70
Figure 14: Protein labeling efficiency with PEG-maleimide, PEG-vinyl sulfone...72
Figure 15: Targets of PEG-maleimide labeling. ...74
Figure 16: Detection and scoring of in vitro oxidized proteins ...76
Figure 17: Quantitation of in cellulo H2O2-induced oxidation of Prx in HEK cell ...78
Figure 18: Quantitation of in cellulo H2O2-induced oxidation of Hsp27 in HEK cell ..80
Figure 19: Quantitation of insulin-induced oxidized PTP1B in HeLa cells ...82
Table List
Table 1: Diamide-induced thiolated antioxidant enzymes in HAP-1 cell ...84Table 2: Diamide-induced sulfiredoxin disulfide-forming targets ...86
Appendix Index
Figure S1: Antioxidant responses in mammalian cell ...96
Figure S2: Protein cysteine oxidations in mammalian cell ...97
Figure S3: Mechanism of Srx-catalyzed Prx-SO2 reduction ...98
Figure S4: Metabolomics survey of glutathione...99
Figure S5: Design and test of anti-GSH antiserum ...100
Figure S6: Structure and tagging mechanism of polyethylene glycol maleimide ...101
Table S1: Diamide-induced oxidation proteome in HAP-1 cell ...102
Table S2: Identification of sulfiredoxin disulfide-forming targets ... 110
Abbreviation List
ADP Adenosine diphosphate
ARE Antioxidant responsive element ATP Adenosine triphosphate
DMSO Dimethyl sulfone DTT Dithiothreitol
GAPDH Glyceraldehyde-3-phosphate dehydrogenase GPx Glutathione peroxidase
GR Glutathione reductase GSH Glutathione
GSSG Oxidzed glutathione disulfide IAA Iodoacetamide
KO Knockout
LC-MS Liquid-phase chromatography mass spectrometry mRNA Messenger ribonucleic acid
MTT (3-(4, 5-Dimethylthiazol-2-yl)-2,5-diphenyltetrazolium bromide NADH Nicotinamide adenine dinucleotide
NADPH Nicotinamide adenine dinucleotide phosphate NEM N-ethylmaleimide
Nrf2 NF-E2 related factor 2 PBS Phosphate buffered saline PCR Polymerase chain reaction PEG Polyethylene glycerol Prx Peroxiredoxin
PTP1B Protein tyrosine phosphatase 1 B RAC Resin-assisted capturing
RNS Reactive nitrogen species ROS Reactive oxygen species
RT-PCR Reverse transcription polymerase chain reaction
SDS-PAGE Sodium dodecyl sulfate polyacrylamide gel electrophoresis Srx Sulfiredoxin
TRR /TrxR Thioredoxin reductase Trx Thioredoxin
Chapter I.
Investigation of the Antioxidant Role of Sulfiredoxin
1. Introduction
1.1. Oxidative stresses and antioxidant systems in mammalian cells
Reactive oxygen and nitrogen species (ROS/RNS), such as superoxide (O2!-),
hydrogen peroxide (H2O2), and nitric oxide (NO!), are produced as by-products of
mitochondrial metabolic processes including oxidative phosphorylation (OXPHOS),
and they may serve as signaling molecules [1,2]. However, for its high reactivity,
excessive ROS/RNS causes oxidative stress, which is associated with several
pathological and physiological pathways, including infectious diseases, cardiovascular
diseases, cancers, and diabetes [3,4,5].
To maintain the homeostasis of the reducing environment in cell, several antioxidant
enzymes respond to oxidative stress. For example, superoxide dismutase (SOD) and
catalase (CAT) detoxifies superoxide and hydrogen peroxide [6]. Additionally, thiol-
dependent enzymes peroxiredoxin (Prx), thioredoxin (Trx) and glutathione (GSH), play
important roles in protecting cell from oxidative stresses [7,8] (Appendix Fig. S1A).
milli-molar concentrations in mammalian cytoplasm [7,9]. As a tri-peptide containing
one cysteine residue, GSH scavenges ROS/RNS by forming oxidized glutathione
(GSSG) or protein glutathionylation. GSH is required in the reaction of a glutaredoxin
(Grx) and glutathione peroxidase (GPx), and it is recycled by glutathione reductase (GR)
in a NADPH-dependent manner [7]. Meanwhile, peroxidase activity is found in
peroxiredoxin (Prx) family, dependent on conserved cysteine residues in the active site.
Prx reacts with H2O2 at a very high rate, but also reduces peroxynitrite and organic
hydroperoxides [10]. Prx1, 2 and 4 are primarily cytosolic, while Prx3 locates in
mitochondria [11]. Prx2, due to its high reaction rate and abundance, traps almost all
H2O2 in vivo [12]. Prx with hyperoxidation on the catalytic cysteines is catalytically
inactivated [10], whereas still participating in protective signaling [13]. The
hyperoxidized Prx can be recovered by sulfiredoxin (Srx) [14].
Oxidized Prx can be specifically reduced by thioredoxins (Trx), and the oxidized Trx
can be reversed by thioredoxin reductase (TrxR) in a NADPH-dependent manner [15].
Trx1 and TrxR1 present in both cytosol and nucleus, whereas Trx2 and TrxR2 locate in
mitochondria [16]. Trx/TrxR system also has a protective function against oxidative
stress, such as supporting the activity of ribonucleotide reductase and inhibiting
apoptosis signal-regulated kinase-1 (ASK1) [17].
At the transcription level, nuclear factor erythroid-2 related factor (Nrf2) activates
downstream gene expression in response to oxidative stress [7] (Appendix Fig. S1B).
Normally, Nrf2 associates with Kelch-like ECH-associated protein1 (iNrf2, Keap1) by
intermolecular disulfide bridge. ROS/RNS results in Keap1 intramolecular disulfide
formation, releasing Nrf2 and allowing it to translocate into the nucleus and binding to
genes containing antioxidant response elements (ARE) in the promoter encoding several
antioxidant enzymes including Cu-Zn superoxide dismutase (SOD), NAD(P)H quinone
dehydrogenase 1 (NQO1), catalase, and sulfiredoxin (SRXN1) [18].
1.2. Protein cysteine residues as the victims of oxidative attacks
Thiolate (-S-) is a potent nucleophile and more prone to oxidation than thiols, so that
proteins with cysteine residues of lower ionization constants (pKa) are more likely to be
attacked by oxidants [19,20]. The pKa values for the low-molecular-weight thiols,
cysteine (Cys) and glutathione (GSH), are 8.3 and 8.8, respectively, whereas cysteine
residues in proteins can be strongly influenced by the local environment.
Cysteine oxidation is the main post-translational modification associated with redox
signaling and oxidative stress [21,22]. Reversible oxidation modifications, such as
S-thiolation (S-S), S-nitrosylation (-SNO), disulfides, and Cys sulfenic acid (-SOH), can
be recovered by antioxidant enzyme systems such as the thioredoxin system [7]. The
others, including Cys sulfinic (-SO2) and sulfonic acids (-SO3), are considered
irreversible [2] (Appendix Fig. S2). However, there is a reported exception that
Cys-SO2 on Prx1-4 can be reduced by sulfiredoxin in an ATP-dependent manner [23].
Although cysteine residues consist of only 2.26% of all encoded amino acids in
human proteome [24], cysteine oxidations are important for enzyme activity and
stability of protein structure. Given cysteine residues are found in the active site of
several enzymes, Cys oxidations affect enzyme activity in several cases such as
nitrosylation of protein tyrosine phosphatase 1B (PTP1B) [25], while irreversible Cys
oxidations lead to protein degradation [26]. Disulfide bonds formed in the endoplasmic
reticulum (ER) during protein production are related to structural stability [27], while
some disulfide formations are induced by ROS and relevant to signaling, for instance,
intramolecular disulfide of Keap1 causes its dissociation from Nrf2 and facilitating Nrf2
signaling [28].
There are several detection tools of thiol oxidation. One strategy is reducing the Cys
modifications after alkylating unmodified thiols first, and then reducing the
modifications with proper reducing agents [29]. The nascent thiol groups can be labeled
with specific probes containing biotin (biotin-switch) [30], or directly pulled down with
thiol-specific probe in the immobilized phase (resin- assisted capture) [31]. In addition,
chemicals that can directly interact with oxidized modification are also developed, such
as dimedone, which targets at sulfenic acid [32]. Further, several antibodies of
Cys-oxidative modifications are developed.
1.3. Sulfiredoxin reduces peroxiredoxin sulfinylations
Sulfiredoxin (Srx) was first found in yeast with reactivating function to
hyper-oxidized peroxiredoxin [14]. Peroxiredoxins 1-4 (Prx1-4), which called 2-Cys
peroxiredoxins, form homo-dimer with inter-chain disulfide between peroxidatic
cysteine (CP) and resolving cysteine (CR) when stimulated by oxidative stress [33].
Hyperoxidized Prx1-4 forming sulfinic or sulfonic acid would be catalytically
inactivated [14,34]. Srx is thought to specifically reduce sulfinic acid on 2-Cys Prx in an
ATP-dependent manner [35]. It is the only enzyme reported to reduce protein Cys
sulfinic acid. For reactivating mitochondrial Prx3, Srx disassociates from the complex
consisting of Hsp90 and FKBP and translocates from cytosol to mitochondria induced
by hydrogen peroxide signaling [36,37]. As one of the downstream genes of Nrf2/ARE
signaling, the translation of Srx is induced by the AP-1 promoter [38].
Srx is a small protein with predicted molecular size of 14 kDa. The nucleotide and
amino acid sequences are conserved among species, containing a GCHR region where
ATP binding site and catalytic cysteine residue locates [39]. For mammalian, plant, and
cyanobacteria, there is only one cysteine residue in the amino acid sequence of Srx,
while in prokaryotes and yeast it contains two cysteine residues [40], thus the oxidized
1-Cys Srx cannot be recycled by intramolecular disulfide but relies on the participation
of glutathione [40].
Srx catalyzes the reduction of hyperoxized Prx in an ATP-dependent manner.
Phosphate on ATP transfers to the sulfinic acid group of Prx-SO2, activating the
formation of a thiolsulfinate complex between Prx-SO2 and the catalytic Cys of Srx. In
yeast, 2-Cys Srx is recycled by intramolecular disulfide, releasing Prx-SOH that is
further reduced by intramolecular disulfide and antioxidant systems such as Trx. On the
other hand, in mammals, 1-Cys Srx recycling might depend on other thiol reducer such
as GSH [23,40,41] (Appendix Fig. S3).
Srx is relevant to diseases with a protective function. In assays of human A549 lung
cancer cells, H2O2-induced ROS was decreased in SRXN1-transfected A549 cell [42],
and Srx null cell has increased ROS levels, and significantly slower migration ability
[43]. Srx is also reported to deglutathionylate Prx, actin, and PTP1B [44], and the
deglutathionylation function to Prx is reported to be specific [45]. Srx was also reported
to denitrosylate Prx2 in ATP-consuming manner in vitro [46]. Further, Srx/Prx axis is
relevant to cancer development [23], and it is recently found that Srx may promote
cervical cancer metastasis via Wnt/beta-Catenin signaling [47].
1.4. Specific aims and significances
Herein we investigated the regulatory roles of Srx in antioxidative responses,
focusing on the thiol-specific oxidative stress. First we established a diamide treatment
model in HeLa cells where diamide induced thiol-specific attacks on proteins, and then
clarified the protein thiolations and antioxidant responses triggered by diamide
treatment. Based on this model, we utilized SRXN1 knockout HAP-1 cell and SRXN1
over-expressing HEK 293 cells to elucidate the function of Srx under diamide-induced
thiol-specific attacks. The specific aims of this study were listed as below:
(1) How Srx regulates the antioxidation responses to diamide treatment;
(2) How Srx interacts with antioxidative systems;
(3) How Srx scavengers the thiol-specific oxidative stress.
Since Srx is well recognized regarding its function on reducing sulfinic acid
modification of Prx1–4, here we pointed at an unreported phenomenon, implicating that
there was an additional antioxidant function of Srx.
2. Materials and Methods 2.1. Chemicals and antibodies
Diamide ((CH3)2NCON=NCON(CH3)2) was bought from Sigma (D3648). Antibodies
of sulfiredoxin, peroxiredoxin, and thioredoxin 2 were bought from Santa Cruz, Inc.,
anti-thioredoxin 1 was bought from R&D, Inc., and anti-thioredoxin reductase was
bought from Sigma, Inc. Protein structural prediction was performed by ExPasy online
tool (https://swissmodel.expasy.org/).
2.2. Cell culture
HeLa and HEK cells were obtained originally from American Type Culture
Collection (ATCC). SRXN1 knockout cell line (product ID: HZGHC006356c003) and
its parental HAP-1 cell line were bought from Horizon, Inc. HeLa cells were cultured in
high-glucose Dulbecco's Modified Eagle Medium (DMEM) with 10% fetal bovine
serum and 1% antibiotic/antimycotic solution (HyClone), while HEK cells were
cultured with 10% fetal calf serum. Parental and SRXN1 KO HAP-1 cells were cultured
in Iscove’s modified Dulbecco;s medium (IMDM) with 10% fetal calf serum and 1%
antibiotic/antimycotic solution. All were cultured at 37°C within 5% CO2 atmosphere.
2.3. SRXN1 knockout, genomic DNA extraction and sequencing
SRXN1 knockout HAP-1 cell line (Horizon) was edited by CRISPR/ Cas9 system.
The mutation was 1 bp insertion in exon 2 of SRXN1 (target transcript NM_080725).
Genomic DNA was extracted from both parental and SRXN1 KO cells by EasyPure
Genomic DNA mini kit (Bioman) and utilized as the PCR template. For sequencing, a
200-bp DNA segment containing the mutation site was amplified. The primer sequences
were 5’TTCTCCCCAGGAGGACCCA3’ and 5’GTGTGGATGCTCCCAGGTAC3’.
PCR was done with SolgTM2X h-Taq PCR Smart mix 1, and the conditions were listed
as below: initial denaturation at 95°C for 15 min, amplification for 30 cycles including
denaturation (95 °C for 20 sec), annealing (60, 62, 64 °C gradient PCR for 40 sec), and
extension (72 °C for 30 sec), and final extension at 72 °C for 5 min, and then holding at
4 °C.
2.4. SRXN1 over-expression
FLAG-SRXN1 clone (target transcript: NM_080725) was bought from Vigene
Biosciences Inc. Bacterial stock was amplified with LB broth containing 1:500 diluted
Ketamycin. Plasmid was extracted with Easy Pure® plasmid DNA miniprep kit
(Bioman), and examined by 1% agarose gel electrophoresis. Extracted FLAG-SRXN1
plasmid was transfected into HEK293 cells with Lipofectamine 3000 (Invitrogen)
followed the suggested concentration and procedure.
2.5 Cell lysate preparation
For lysate preparation, cells were lysed with lysis buffer (50 mM MOPS, 1% CHAPS,
and 8 M urea, pH 7.0) or with Radio immunoprecipitation assay buffer (RIPA) [48],
and harvested the supernatant after centrifugation.
2.6. Fractionation
Cell fractionation was done with Mitoscience® cell fraction kit (ab109719). Cultured
cells were washed twice with ice-cold PBS, and lysed with buffer A containing 1:50
diluted detergent I followed by centrifugation (5,000 rpm for 1 min) to collect the
supernatant as the cytosolic fraction. The pellet was washed in buffer A twice, then
lysed with buffer A containing 1:2000 diluted detergent II, followed by centrifugation
(5,000 rpm for 1 min) to collect the supernatant as the mitochondrial fraction. The final
pellet was washed twice and dissolved as the nuclear fraction.
2.7. SDS-PAGE, Coomassie blue staining, and immnunoblotting
For SDS-PAGE samples preparation, cell lysate or protein extract were mixed with
2x sample buffer with or without 2% β-mercaptoethanol, and boiled for 10 min. The
electrophoresis was carried out with the bis-tricine buffer system, utilizing 10%
acrylamide gel. For Coomassie blue staining, acrylamide gel was washed twice by H2O,
stained with CBR solution overnight and de-stained by H2O. For immunoblotting,
proteins were transferred from gel to PVDF membrane. Blotted membrane was blocked
with 5% skim milk for 30 min, than probed overnight by antibodies (1:1,000 dilution) in
PBST buffer with 0.03% BSA, and followed by secondary antibody probing and
detected by ECL illumination.
2.8 Immunofluorescence
For immunofluorescence, cells were cultured on 20 mm2 coverslips (Marienfeld).
After washed in PBS, specimens were obtained by fixing with 4% performaldehyde in
PBS for 15 min, permeabilized with 0.3% Tritone X-100 in PBS for 10 min, and then
blocked with 5% skim milk in PBST for 1 h. For probing the target proteins, specimens
were incubated with 1:200 diluted antibodies in PBST with 0.03% BSA at 4 °C
overnight, and then adding fluorescence-labeled secondary antibodies in dark at room
temperature for 1 h. After washed in PBS, 1:20,000 diluted DAPI was added and
incubated for 5 min to stain cell nucleus. Specimens were mounted by antifade
mounting reagent and analyzed by Leica DM6000B Upright Microscope System.
2.9. RNA extraction and RT-PCR
mRNA was extracted from cultured cells by Oligotex mRNA Mini Kit (Qiagen).
Extracted mRNA was used as template and subjected to reverse transcription by
OneStep RT-PCR kit (Qiagen). The PCR products were analyzed by electrophoresis
with 1.5% agarose gel. PCR condition and primer sequences of SOD2, NQO1, GSTP1,
and actin were referred to the article of Paupe V et al. [49].
2.10. Immunoprecipitation
For immunoprecipitation, cultured cell was lysed with lysis buffer (50 mM MOPS,
pH 7.2, 1 mM EDTA, 1% NP-40, and 1:100 diluted protease inhibitor cocktails) to get
the supernatant, followed by antibody probing at 4°C overnight. Target proteins were
pulled down by Pierce® Protein A Plus Agarose, washed in lysis buffer trice, and then
eluted by sample buffer which containing β-mercaptoethanol.
2.11. Diamide treatment and resin-assisted capture
Diamide at 5 mM was added into cultured medium and incubated for 5 minutes and
washed in PBS. For recovering, removed diamide and incubated with fresh culture
medium for 30 min. For resin-assisted capture, cultured cell was lysed with Tris-urea
lysis buffer (Tris 10 mM, 8 M urea, 1% Triton, pH 8.0) containing 100 mM
iodoacetamide (IAA), incubated for 1 h, and precipitated with saturated ammonium
sulfate solution. The pellet was resolved with the Tris-urea lysis buffer containing 100
mM DTT, incubated for 1 h and then precipitated. After wash twice for completely
eliminating DTT, pellet was resolved with Tris-urea lysis buffer and incubated with
thio-propyl sepharose® 6B (Pharmacia) for 1 h at room temperature, washed in
Tris-urea lysis buffer containing 2% SDS, eluted with protein sample buffer containing
2% β-mercaptoethanol and boiled for 10 min. Harvested samples were objected to
SDS-PAGE or followed by immunoblotting
2.12. Hydrogen peroxide-induced oxidation
Cell was treated with 0 – 10 mM H2O2 in cultured medium for 10 min, washed in
PBS, and lysed with lysis buffer. The lysate was subjected to immunoblotting.
2.13. MTT assay
Diamide-treated cells were washed with PBS, covered with 5 mg/mL MTT in PBS
and allowed to reaction at 37 °C for 2 h. After removing MTT solution, the formed
purple formazan was dissolved by DMSO, and subjected to measuring the absorbance at
570 nm by Molecular Devices M2 Microplate Reader.
2.14. Anti-glutathione antiserum preparation
For preparing the antigen, ovalbumin was utilized as carrier protein, coupled with
glutathione by crosslinker sulfo-succinimidyl (4-iodoacetyl)aminobenzoate (SIAB)
bought from Thermo Fisher, Inc. Antigen was subjected to routinely subcutaneous
immunizations in rabbits, and the blood was collected from the anesthetized animals
after 8 bi-weekly injections and 10 days from the final injection.
2.15. Thioredoxin reductase activity assay
Thioredoxin reductase (TrxR) activity assay was done with Thioredoxin Reductase
Assay Kit (Sigma Aldrich). Harvested cell pellets was lysed with lysis buffer (50 mM
MOPS, 1% Triton X-100) and allowed to reacting with 5,5’-Dithiobis(2-nitrobenzoic
acid) (DTNB) 3 mM in working buffer (10 mM potassium phosphate, 10 mM EDTA,
0.24 mM NADPH), with or without TrxR inhibitor solution (1:1,000 dilution).
Absorbance of 412 nm was measured kinetically for 10 min (interval: 30 sec) with
Molecular Devices M2 Microplate Reader.
2.16. In-gel digestion and protein identification by mass spectrometry
Protein samples were loaded to 10% SDS-PAGE and separated for a distance of 1 cm.
Each lane of gel was cut into 2 mm slices. These gel slices were soaked in 100 mM
dithiothreitol/25 mM ammonium bicarbonate, followed by alkylation with 65 mM
iodoacetamide. The gel slices were washed in 50% acetonitrile in 25 mM ammonium
bicarbonate. The dehydrated gels were moisturized with trypsin solution (10 ng/µL,
Promega, Madison, WI) and incubated at 37 °C for 16 h. The tryptic peptides were
extracted with 50% and 100% acetonitrile containing 0.1% trifluoroacetic acid
sequentially. The peptide mixtures were desalted by C18 Zip-tip and subjected to
proteomics analysis using an LTQ-Orbitrap Velos hybrid mass spectrometer (Thermo
Fisher Scientific).
Peptide mixtures were loaded onto a 75 µm × 250 mm nanoACQUITY UPLC
BEH130 column packed with C18 resin (Waters, Milford, CT) and were separated at a
flow rate of 300 nL/min using a linear gradient of 5 to 40% solvent B (95% acetonitrile
with 0.1% formic acid) in 30 min, followed by a sharp increase to 85% B in 1 min and
held at 85% B for another 10 min. Solvent A was 0.1% formic acid in water. The
effluent from the HPLC column was directly electrosprayed into the mass spectrometer.
The LTQ Orbitrap Velos instrument was operated in data-dependent mode to
automatically switch between full-scan MS and MS/MS acquisition. Instrument control
was through Tune 2.6.0 and Xcalibur 2.1. For the CIDMS/MS top20 method, full-scan
MS spectra (m/z 350−1600) were acquired in the Orbitrap analyzer after accumulation
to a target value of 106 ions in the linear ion trap. Resolution in the Orbitrap system was
set to R = 60, 000 (all Orbitrap system resolution values are given at m/z 400). The
20 most intense peptide ions with charge states ≥2 were sequentially isolated to a target
value of 5000 and fragmented in the high-pressure linear ion trap by low-energy CID
with normalized collision energy of 35%. The resulting fragment ions were scanned out
in the low-pressure ion trap at the normal scan rate and recorded with the secondary
electron multipliers. Ion selection threshold was 500 counts for MS/MS, and the
maximum allowed ion accumulation times were 500 ms for full scans and 100 ms for
CID-MS/MS measurements in the LTQ. An activation q = 0.25 and activation time of
10 ms were used.
The peptides were identified from the MS/MS data searched against the SwissProt
database using the Mascot search engine 2.3.02 (Matrix Science, Boston, MA). Search
criteria used were as follows: trypsin digestion; variable modifications set as acetyl
(protein N-terminal), carbamidomethyl (Cys) and oxidation (Met); up to two missed
cleavages allowed; and mass accuracy of 10 ppm for the parent ion and 0.60 Da for the
fragment ions.
2.17. Metabolomics analysis by mass spectrometry
Cultured cells lysed with H2O and precipitated protein with 66% acetonitrile.
Supernatants were directly applied to the LC-ESI-MS analyses consisted of an
ultra-performance liquid chromatography (UPLC) system (Ultimate 3000 RSLC,
Dionex, Sunnyvale, CA, USA) and an electrospray ionization (ESI) source of
quadrupole time-of-flight (TOF) mass spectrometer (maXis UHR QToF system, Bruker
Daltonics, Bremen, Germany). The samples were kept in an autosampler at 4 ◦C.
Separation was performed with reversed-phase liquid chromatography (RPLC) on a
BEH C18 column (2.1 x 100 mm, Walters). The elution started from 99% mobile phase
A (0.1% formic acid in ultrapure water) and 1% mobile phase B (0.1% formic acid in
ACN), held at 1% B for 0.5 min, raised to 60% B in 6 min, further raised to 90% B in
0.5 min, held at 90% B for 1.5 min, and then lowered to 1% B in 0.5 min. The column
was equilibrated by pumping 1% B for 4 min. The flow rate was set 0.4 ml/min with
injection volume 2 µl. LC-ESI-MS chromatogram were acquired under following
conditions: capillary voltage of 4500 V in positive ion mode, dry temperature at 200℃
dry gas flow maintained at 9.0 l/min, nebulizer gas at 2.0 bar, and acquisition range of
m/z 100-1000. Data were acquired by HyStar and micrOTOF control software (Bruker
Daltonics, Bremen, Germany) and processed by DataAnalysis software (Bruker
Daltonics, Bremen, Germany). Metabolite was identified by the theoretical m/z value
and isotope pattern derived from the chemical formula, and was integrated the area of
signal peaks in the extracted ion chromatogram.
3. Results
3.1. Diamide induced reversible thiolations and antioxidant responses
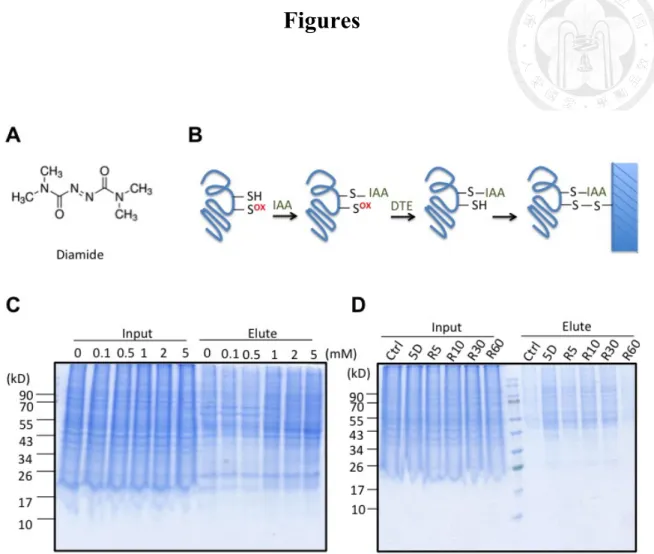
Diamide (Fig. 1A) reacts with free thiolate anions (RS-) such as glutathione, changing
the redox equilibrium of thiols in cells, leading to thiol-specific attacks of proteins [50].
According to the mechanism, it would not result in irreversible cysteine oxidations
including sulfinic and sulfonic acids.
Herein we used diamide treatment to focus on protein thiol oxidations, and verified
the oxidized protein targets by resin-assisted capture (RAC) [31]. The oxidized proteins
were first alkylated with iodoacetamide (IAA), and then reduced the oxidative
modifications by dithioeryreitol (DTE). The nascent cysteine thiols were captured by
thiopropyl sepharose thus pulled down the oxidized proteins (Fig. 1B).
To establish a diamide-induced thiolation model, HeLa cells were treated with 0 – 5
mM diamide for 5 min, and the lysate was subjected to RAC (Fig. 1C). When the dose
of diamide was higher than 1 mM, protein thiolations increased in a dose-dependent
manner. Moreover, when diamide was removed and cells were incubated with fresh
culture medium for 5 – 60 min, protein thiolation level recovered in 30 – 60 mins (Fig.
1D). The data showed that treating high-dose diamide for short incubation time induced
reversible protein thiolations.
The thiolated targets were further identified by LC-MS analysis. The potential targets
were in various functions such as glycolysis, pentose phosphate pathway, citric acid
cycle, antioxidant responses, and chaperones (data not shown). Several potential targets,
including pyruvate kinase, aldolase, Hsp90, GAPDH, and peroxiredoxin, were
confirmed by immunoblotting (Fig. 2).
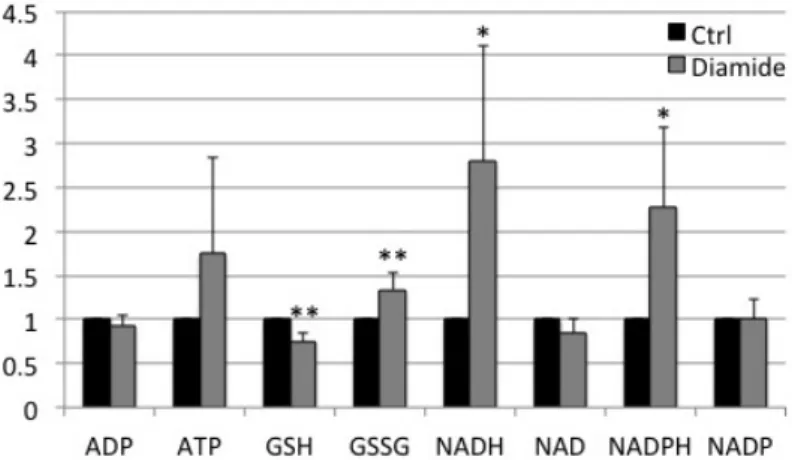
To figure out whether diamide treatment affected metabolism in cells, metabolites
were extracted from both control and diamide-treated cells by 66% acetonitrile and
subjected to LC-MS analysis. Reduced glutathione (GSH) decreased in diamide-treated
cells; in contrary, oxidized glutathione disulfide (GSSG), NADH and NADPH
increased significantly (Fig. 3). After recovering for 30 min, GSH increased, while
GSSG recovered to the level similar to the control group (Appendix Fig. S4). The data
indicate that glutathione is the main victim of the diamide attack.
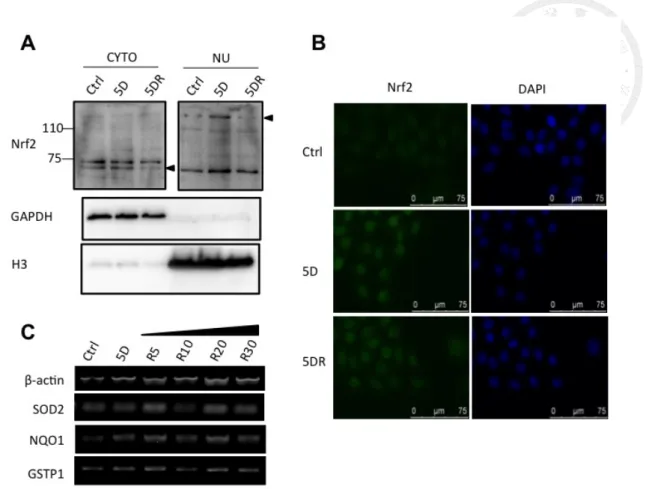
To elucidate whether diamide triggered antioxidant responses at the transcriptional
level, Nrf2 translocation was examined by subcellular fractionation and
immunofluorescence staining. Both data indicated that Nrf2 translocated into cell
nucleus after 5-min diamide treatment (Fig. 4A, B). The mRNA of Nrf2 downstream
genes, such as superoxide dismutase 2 (SOD2), NAD(P)H quinone dehydrogenase 1
(NQO1), and glutathione S-transferase 1(GSTP1), increased after diamide treatment and
remained high during recovery (Fig. 4C). Therefore, diamide treatment induced
Nrf2-related antioxidant responses, especially in the process of recovery.
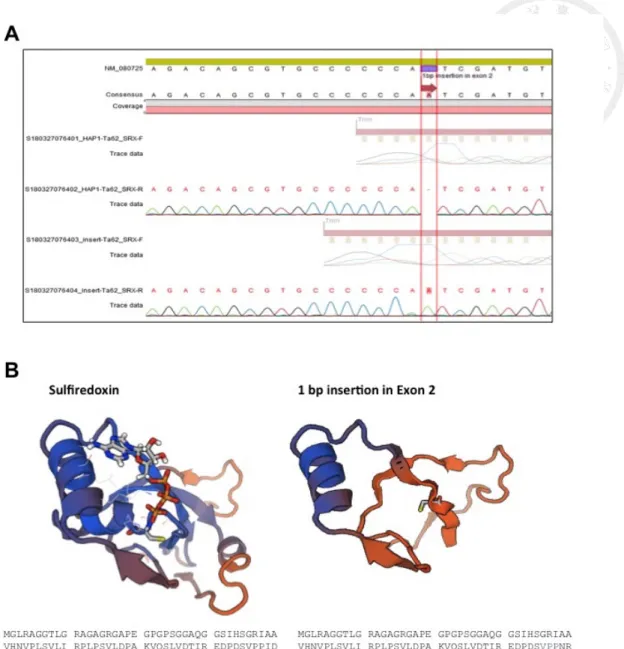
3.2. Sulfiredoxin knockout increased diamide-induced protein thiolations
For examining the role of sulfiredoxin under diamide treatment, SRXN1 knockout
cells were used. CRISPR/Cas9-edited SRXN1 (NM_080725) knockout HAP-1 cell line,
which is hyploid and suitable for gene editing [51], was bought from Horizon®. The
mutation was 1 bp adenosine insertion in exon 2 of SRXN1. For confirming, genomic
DNA was extracted as the template in PCR and PCR product was sequenced (Fig. 5A).
This insertion resulted in a truncation of sulfiredoxin at the conserved GCHR
(G98-R101) region [39], which included the active cysteine residue C99 [35] (Fig. 5B).
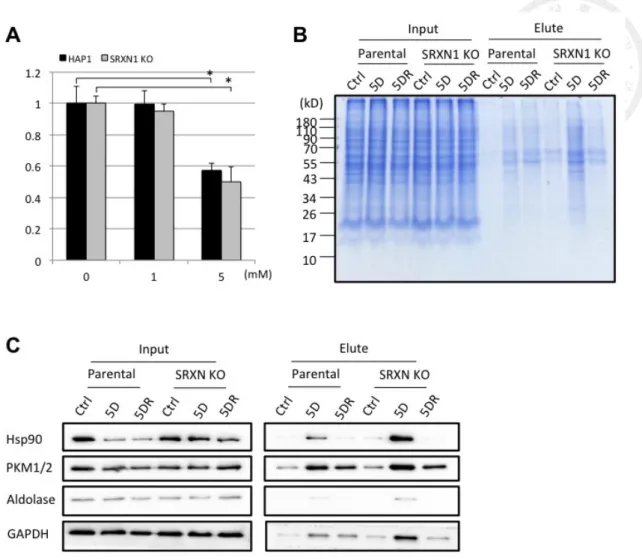
The metabolic activity of HAP-1 cells under diamide treatment was examined.
According to the results of MTT assay, 5 mM diamide treatment significantly decreased
cell metabolic activity in both parental and KO cells, whereas there was no significant
difference between them (Fig. 6A). Thus we applied diamide-treated model to HAP-1
cell to elucidate the effect of sulfiredoxin on protein thiolations.
The diamide treatment induced protein thiolations in both parental and KO cells,
which recovered after 30 min (Fig. 6B). Interestingly, the thiolation level was obviously
higher in KO cells than in parental cells, implicating that sulfiredoxin might play some
roles cells facing thiol-specific assault. The thiolated targets were also identified by
LC-MS analysis (Appedix Table S1), and several targets also appeared in the HeLa cell
model, such as pyruvate kinase, aldolase, Hsp90, and GAPDHl (Fig. 6C). Some targets,
such as actin and tubulin, were found only in KO group, could be potential interacting
partner with sulfiredoxin (Appedix Table S1).
3.3. Sulfiredoxin knockout affected functions of antioxidant enzymes
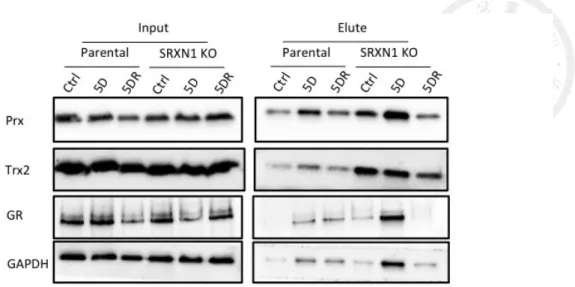
There were several antioxidant enzymes identified in RAC data (Table 1). Confirmed
by immunoblotting, the thiolation levels of peroxiredoxin (Prx), thioredoxin 2 (Trx2),
and glutathione reductase increased while treated with diamide, and recovered after 30
min (Fig. 7). All these enzymes exhibited a higher thiolation level in SRXN1 KO cells.
Meanwhile, compared with parental cells, peroxiredoxin and thioredoxin 2 were
thiolated in the sulfiredoxin knocked out cells. Since thiolation in these thiol-dependent
enzymes may be relevant to their antioxidant functions, sulfiredoxin knockout has
impact on these antioxidant systems.
3.3.1. Glutathione system
As the main reductant in mammalian cells, glutathione (GSH) releases cell from
oxidative stress by forming intermolecular disulfide bridge, either protein
glutathionylations or oxidized glutathione (GSSG) [7].
To examine whether sulfiredoxin knockout affects protein glutathionylation, cell
lysates of parental and KO cells were probed with anti-glutathione immunoblotting (Fig.
8A). Although the antiserum recognizes glutathionylation (Appendix Fig. S5), its
specificity was not satisfactory. However, the data indicated that basal levels of protein
glutathionylation were higher in KO cells than in parental cells.
Oxidized glutathione disulfide (GSSG) in parental and KO cells was examined by
LC-MS analysis. Diamide induced significant increase in GSSG in KO cells (Fig. 8B).
The data indicated that sulfiredoxin knockout increased the diamide-induced glutathione
oxidations, both protein glutathionylation and glutathione disulfide.
3.3.2. Peroxiredoxin and thioredoxin system
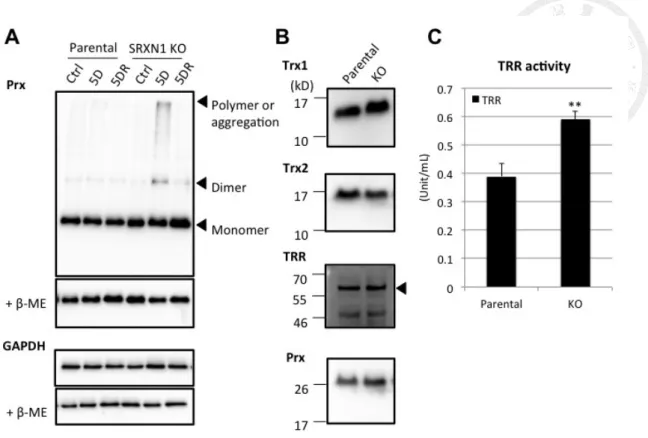
As the known substrate of sulfiredoxin [35], we studied how peroxiredoxin was
regulated in SRXN1 KO cells under diamide treatment. 2-Cys peroxiredoxins form
homo-dimer with inter-chain disulfide between peroxidatic cysteine (CP) and resolving
cysteine (CR) while facing to oxidative stress [33]. In HAP-1 cells, diamide treatment
induced peroxiredoxin dimerization, and the dimerization increased more in
sulfiredoxin knockout cells (Fig. 9A). Peroxiredoxin thiolations were already present in
knockout cells without diamide treatment (Fig. 7), suggesing that peroxiredoxin
glutathionylation increased while sulfiredoxin was knocked out. Therefore, sulfiredoxin
might relevant to the regulation of peroxiredoxin dimerization and glutathionylation.
According to the immunoblotting, the expressions of peroxiredoxin, thioredoxin 1,
thioredoxin 2, and thioredoxin reductase were not significantly different between
parental and KO cells (Fig. 9B), so that the thiolation increase was not due to the
change of protein amounts.
In general, thioredoxin forms intramolecular disulfide to recycle oxidized
peroxiredoxin dimer, and the oxidized thioredoxin is reversed by thioredoxin reductase
[52]. Examining by Ellman’s assay combined with thioredoxin reductase inhibitor, the
activity of thioredoxin reductase was significantly higher in KO cells than in parental
cells (Fig. 9C). Due to the unchanged expression level of thioredoxin reductase (Fig.
9B), the higher activity might be due to higher reducing status of the enzyme. Besides,
according to the change of the redox status, I suggest that while sulfiredoxin was
knocked out, the responses of thioredoxin system to the diamide-induced attacks might
have a compensatory increase.
3.4. Diamide treatment induced cytosolic sulfiredoxin dimerization
To elucidate how diamide treatment affected sulfiredoxin, diamide-treated cells were
examined with anti-sulfiredoxin antibody. However, given the sensitivity of anti-Srx
antibodies were not enough to recognize endogenous sulfiredoxin, we expressed
FLAG-tagged sulfiredoxin in HEK293 cells.
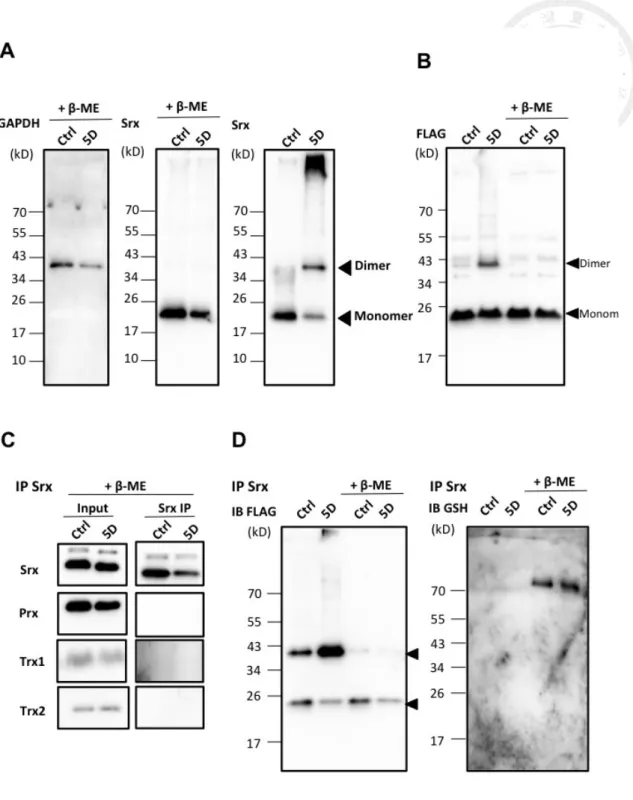
In immunoblots with both anti-sulfiredoxin and anti-FLAG, diamide treatment led to
signal of sulfiredoxin of higher molecular mass, which could be reduced by
β-mercaptoethanol (Fig. 10A, B). Given there is only one cysteine in mammalian
sufliredoxin, the high molecular-weight sulfiredoxin complex was possibly protein
dimer by an intermolecular disulfide at the only cysteine residue C99. In order to verify
the binding partner of sulfiredoxin, we immunoprecipitated sulfiredoxin complex,
disassociating the complex with reducing agent, and allowing the sample to LC-MS
analysis (Table 2) and immunoblotting (Fig. 10C). I found no potential binding
candidates, thus the complex might be a homo-dimer. Additionally, some thiolated
proteins were found only in diamide-treated group, such as S100A8/9 complex,
suggesting that they also play some roles in antioxidant responses. The
immunoprecipitated sulfiredoxin was also allowed to anti-GSH immunoblotting (Fig.
10D) and found no evidence of being glutathionylated.
Sulfiredoxin was reported to translocate into mitochondria while induced by H2O2
signaling [53]. To figure out whether the diamide-induced sulfiredoxin dimer
translocated into mitochondra, SRXN1 over-expressed cell was objected to subcellular
fractionation, and anti-Srx immunoblotting. After diamide treatment, only cytosolic
sulfiredoxin dimer increased, and the dimer could be reduced by β-mercaptoethanol
(Fig. 11A), thus diamide attack only resulted in cytosolic sulfiredoxin dimerization and
no mitochondrial translocation. Unexpectedly, there was mitochondrial sulfiredoxin
dimer found even without diamide treatment. Meanwhile, 10 mM H2O2 treatment for 10
min also resulted in reversible sulfiredoxin dimerization, implicating the possibility that
sulfiredoxin could release oxidative stress by forming a dimer with disulfide (Fig. 11B).
3.5 Hypothetic mechanism of sulfiredoxin under thiol-specific oxidative attacks
Based on the phenomena observed in knockout and over-expression models, herein a
hypothetic mechanism of sulfiredoxin was proposed (Fig. 11). Besides the reducing
ability of hyperoxidized peroxiredoxin sulfinic acid (Prx-SO2), sulfiredoxin might
scavenge oxidative stress by forming intermolecular disulfide at its only cysteine
residue C99. Its antioxidant function might involve peroxiredoxin dimerization and
glutathionylation. Sulfiredoxin knockout leads to less resistance to diamide-induced
attacks, resulting in more glutathione oxidations and more protein thiolations (including
glutathionylation). However, the thiolations would be recoverable as well, for other
antioxidant systems, such as thioredoxin/ thioredoxin reductase, might be activated in
compensation.
4. Discussion
Diamide treatment induced general protein thiolations, GSSG increase, and Nrf2
translocation in HeLa cell. Although 0.5 – 2 mM diamide treatment for 15 – 60 min is
enough to oxidize membrane and cytoskeleton proteins [50], the thiolations induced by
5 mM diamide treatment for 5 min, which was higher dose and shorter duration, were
still recoverable. The identified thiolation targets included several enzymes that
participated in antioxidant responses and energy metabolic pathways. Metabolomics
survey showed that diamide treatment increased GSSG level as reported [54,55],
indicating GSH might cushion the diamide attacks mainly. Additionally, Nrf2
translocation was induced by diamide treatment, leading to downstream gene expression
of antioxidant enzymes.
Herein we reported a protective function of sulfiredoxin in diamide-induced protein
thiolations, which implicated a more essentially antioxidant role of sulfiredoxin. Since
the mechanism of diamide was attacking thiolate and interrupting the equilibrium of
reducing glutathione pool [50], we utilized diamide treatment to rule out the effect from
ROS production. According to previous literatures, sulfiredoxin reduced peroxiredoxin
S-nitrosylation in 60 min but more than 45 min in vitro [46]. Considering that SRXN1
knockout increased protein thiolations and glutathione oxidations within 5 min
treatment (Fig. 6), here it might release oxidative stress immediately, similar to
glutathione or thioredoxin. Since sulfiredoxin interrupts in vitro glutathionylation
induced by PABA/NO [44], and negatively relates with ROS productions [42,43], it
might scavenge the ROS thus protect proteins from oxidations. The function might be
relevant to its conserved region (Fig. 5), and the over-expression model implicated that
it might release the oxidative stress by intermolecular disulfide on its only cysteine
residue (Fig. 10).
Diamide triggers mainly S-thiolations in the cytoplasmic proteomes of Bacillus
subtilis and Staphylococcus aureus [56]. In our fractionation data of HAP-1 cells, it was
also stated that diamide dominantly induced thiolations in cytosolic, so that the
diamide-induced sulfiredoxin dimer was only found in cytosol and without translocation
to mitochondria (Fig. 11). On the other hand, consistent observation of its dimerization
in mitochondria indicated another possible antioxidant role of sulfiredoxin (Fig. 11).
Due to mitochondrial electron transferation [1,2], high H2O2 concentration in
mitochondria might trigger the antioxidant response of sulfiredoxin, so that increased its
dimerization. However, due to the lack of an efficient anti-Srx antibody, we could only
detect sulfiredoxin in overexpressing system. For further clarification, a better tool is
required.
Althought sulfiredoxin is activated by Nrf2 and AP-1 as downstream signaling [38],
due to the delay of Nrf2 signal transduction observed in the HeLa cell model (Fig. 4C),
it might mainly function in the recovery state but not in the immediate rising of
thiolation level. Meanwhile, although sulfiredoxin knockout, protein thiolations was
still recovered in 30 minutes, implicated the possibility of a compensatory induction of
other antioxidant systems such as thioredoxin and glutathione. Both of them increase
thiolations while sulfiredoxin knocked out (Fig. 7-9), and thioredoxin reductase was
more dominant in knockout cells (Fig. 9C).
Chapter II.
Development of Quantitative Display of Protein Redox Status
1. Introduction
1.1. Detection tools of protein cysteine oxidations
Cysteine oxidative modifications, such as S-nitrosylation, disulfide, and S-sulfenic
acid, participate in several biological functions including protein structuring, signaling,
and enzyme activity [21,22,57]. For detecting thiol modifications, differential alkylation
method was first introduced in 2001 for analysis of S-nitrosocysteine and remains the
most used one [30,58]. The initial step is blocking of all reduced SH groups by
alkylation; after removal of excess alkylating reagent, specific reductant such as
ascorbate is added, thus generated nascent thiols upon the modification-specific
reduction. Another alkylating agent containing a specific tag, such as biotin achieves
final alkylation step, rendering identification and enrichment feasible. Strong reducing
agents like dithioerythritol reduce all reversibly oxidized cysteines, glutaredoxins and
sodium arsenite reducing S-glutathione and SOH, respectively [59,60].
The original differential alkylation method is also called biotin-switch technique
(BST) or tag-switch technique. Meanwhile, the resin-assisted capture (RAC) strategy
was developed in 2009 to globally profile protein S-nitrosylation dynamics in
S-nitrosylcysteine-treated E. coli and HEK293 cells [31]. In this method, redox
modified thiols are tag-switched with a thiol-reactive resin and enrichment is achieved
following extensive wash procedures and elution with β-mercaptoethanol or
dithiothreitol. One major drawback associated with the BST is that some endogenous
proteins containing the biotin prosthetic group will be co-purified and co-identified with
the genuine signals.
Commonly used alkylating reagents include iodoacetamide (IAM), N-ethylmaleimide
(NEM), and bromobimane (BBM) [29]. Cysteine oxidations can also be distinguished
by mass spectrometry, which coupled with alkylation method and amplifying signals by
isotope-coded affinity tag (ICAT), identifying specific modification sites [61,62].
Antibody is also utilized to detect cysteine oxidations; for example, reversed PTP1B
S-nitrosylation could be recognized by anti-iodoacetamide (IAM) antibody [63].
Dimedone, which specific reacting to sulfenic acid, was applied to label cysteine
sulfenic acid and recognized by its antibody [32]. Antibodies directly probing to PTP1B
sulfonic acid and SOD1 sulfonic acid are also reported [64,65].
1.2. PEG-maleimide as a cysteine-specific probe
Maleimide derivatives are widely used for the alkylation of thiols in which thiolates
attack the electrophilic double bond of the maleimide [66] (Appendix Fig. S6).
Maleimide-polyethylene glycol (m-PEG) labeling is commonly used as an easy
approach of reversible protein cysteine oxidation [67]. It is designed for analysis of
disulfide bonds in proteins with and without prior reduction [68], for site-specific
PEGylation of therapeutic proteins to avoid rapid degradation and excretion from
patients [69], for topology determination of membrane proteins by scanning cysteine
mutagenesis and accessibility [70,71]. In addition, m-PEG has been used to detect
reversibly oxidized creatine kinase, protein kinase A and protein kinase G by reacting to
the reduced cysteine residues leading to mobility shift in immunoblots; a method called
PEG-switch [67,72]. M-PEG labeling of proteins leads to a shift to high-molecular-
weight end, thus can be distinguished by SDS-PAGE or immunoblotting. The
ameliorated method, which combining with click-chemistry, is also reported [73].
Compared with other detection strategies, this method is easy, quick and not so
expensive, whereas it might be interrupted due to the conformational change of
antibody-recognized epitopes. Additionally, it has been implicated that quantify the
labeling ratio of proteins reflects the oxidation status [73].
1.3. Specific aims and significances
Herein we optimized the labeling conditions and exploited the applications of
PEG-switch in quantitation of the extent of protein cysteine oxidation in cells which in
response to H2O2 and insulin. Based on the PEG labeling strategy, we proposed a
scoring system to reflect the redox status of target proteins. Since recent detection tools
are most likely to be qualitative rather than quantitative, the assay method we provided
was easy, fast, and promised in quantitatively comparing various protein redox statuses.
2. Materials and methods 2.1. Chemicals and antibodies
Methoxypolyethylene glycol maleimide 5000 (PEG-maleimide 5K) was bought from
Sigma, and PEG-vinyl sulfone 5K was bought from Tours. Antibodies of peroxiredoxin,
protein tyrosine phosphatase 1 B (PTP1B), prohibitin, Heat shock protein 27 (Hsp27),
nm23, histone deacetylase 6 (HDAC 6), glutathione reductase, and deoxythymidylate
kinase (DTYMK) were bought from Santa Cruz, Inc., and which of B-cell lymphoma 2
(Bcl-2), fatty acid synthase, nuclear factor kappa-light-chain-enhancer of activated B
cells (NFκB), calcium/calmodulin-dependent protein kinase II (CamKII), calpain,
caspase 3, and caspase 9 were bought from Cell Signaling Inc. Horse insulin was
bought from Sigma.
2.2. Cell culture and lysis condition
HeLa, HepG2, HEK, and 3T3 cells were obtained originally from American Type
Culture Collection. HeLa and HepG2 cell were cultured in high-glucose Dulbecco's
Modified Eagle Medium with 10% fetal bovine serum and 1% antibiotic/antimycotic
solution (HyClone), while HEK cell and 3T3 cells were cultured in 10% fetal calf serum.
All were cultured at 37°C within 5% CO2 atmosphere. For lysates preparation, cells
were lysed with the lysis buffer (50 mM MOPS, 1% CHAPS, and 8 M urea, pH 7.0),
and harvested the supernatant after centrifugation.
2.3. PEG-maleimide labeling
PEG-maleimide (m-PEG) was dissolved in H2O for 5 mg/mL as 5x stock solution,
and diluted by lysis buffer to 1 mg/mL as final concentration. Dealing with in vitro
oxidized samples, cell lysates were precipitated with ammonium sulfate and dissolved
with lysis buffter containing m-PEG. On in cellulo oxidation samples, cells were lysed
directly with lysis buffer with m-PEG. For labeling protein thiol residue, solution
containing cell lysate and m-PEG was incubated at 37°C for 30 minutes, followed by
adding sample buffer with 2% β-mercaptoethanol immediately to quench free m-PEG.
Labeled samples were applied to SDS-PAGE and immunoblotting. Protein quantitation
was done with Pierce® BCA protein assay kit (Thermo Scientific).
2.4. SDS-PAGE, immunoblotting and reduced/oxidized ratio calculation
SDS-PAGE and immunoblotting were essentially the same as described in ourprevious publication. [74] Signals of immunoblotting were integrated by Quanti-Scan
(BioSoft) for quantification, and the ratio was examined by t test.
2.5. Hydrogen peroxide-induced oxidation
For in vitro oxidation, HeLa cell lysate was treated with 0 – 10 mM H2O2 for 1 h at
room temperature, and precipitated with saturated ammonium sulfate in 4x volume.
Dissolved the pellet with lysis buffer to appropriate concentration of protein (not below
0.5 µg/mL) for applying to labeling. For in cellulo oxidation, cultured HEK cell was
treated with 0 – 10 mM H2O2 in serum-free DMEM for 10 minutes, washed in PBS
trice, and lysed with lysis buffer (with or without PEG-maleimide) immediately for
labeling.
2.6. Insulin-induced PTP1B oxidation in HeLa cell
Confluent HeLa cell cultured in 6-well plate was treated with insulin 10 ng/mL for 0
– 30 minutes, washed by PBS quickly, and lyzed with lysis buffer (50 mM MOPS, 1%
CHAPS, and 8 M urea, pH 7.0) including 1 mg/mL PEG-maleimide immediately at
37°C for 30 min for labeling.
3. Results
3.1. Protocol of PEG tagging
The flowchart of this m-PEG tagging method was shown as Figure 13. Cultured cells
were treated with oxidants, washed and then lysed with a lysis buffer containing 1
mg/ml m-PEG. Alternatively, cell lysate was harvested, treated with oxidants, and
precipitated with ammonium sulfate. The resulting protein extract was dissolved in the
lysis buffer containing 1 mg/ml m-PEG. The m-PEG tagging reaction was carried out at
37°C for 30 min [31], and then quenched with an equal volume of 2x SDS sample
buffer containing 4% β-mercaptoethanol [32] to stop the reaction. The resulting samples
were subjected to SDS-PAGE and immunoblotting analysis. Successful tagging of the
reduced cysteine residues in proteins would result in mobility shift on electrophoresis
due to the large PEG tag, while oxidized cysteine residues are inert to the m-PEG
tagging. However, this method does not differentiate the various forms of cysteine
oxidation.
3.2. Optimizing tagging efficiency
Although m-PEG has been used in labeling protein cysteine residues [28, 29], the
detail of optimal labeling condition in crude protein extract are still uncovered. To
optimize the tagging efficiency, we used peroxiredoxin as a target of m-PEG due to its
well-known sensitivity to oxidative stress [75].
To elucidate the optimal reaction concentration, m-PEG was added to the HeLa cell
lysate to a final concentration of 0-1 mg/ml. The reaction was allowed for 30 min at
37°C. At 1 mg/mL of m-PEG, most peroxiredoxin molecules were tagged and shifted to
higher molecular forms (Fig. 14A). The protein concentration of the cell lysate was 0.54
mg/mL according to BCA quantitation, thus the ratio of m-PEG (at 1 mg/ml) to protein
was about 2:1 (w/w). Assuming average molecular size of human protein is 50 kD, the
molar ratio of m-PEG to protein would be near 20:1. Taking the average protein length
of 400 amino acids [76] and cysteine composition of 2.26% [24], the molar ratio of
m-PEG to cysteine residues is about 2.2:1. Therefore, m-PEG at 1 mg/ml is adequate
for tagging most cysteine residues in the protein extract. Besides HeLa cells, HEK,
HepG2 and 3T3-L1 cells were also examined for m-PEG tagging of peroxiredoxin (Fig.
14B). However, there were different patterns of m-PEG tagging among these cell lines,
possibly due to different redox status within different cells [23].
Small-molecule thiol compounds, such as hydrogen sulfide, cysteine, homocysteine,
and glutathione, are present in animal tissues [77,78], thus may consume m-PEG and
decrease the tagging efficiency. To lessen the effect of endogenous reductants, we
extracted proteins from cell lysate by ammonium sulfate precipitation (Fig. 14C). The
m-PEG tagging efficiency was moderately improved at both 0.1 and 1 mg/ml
concentrations. Accordingly, ammonium sulfate precipitation in advance is suggested
for m-PEG tagging. We also compared the tagging efficiency of m-PEG with another
cysteine-specific probe, PEG-vinyl sulfone (v-PEG), whereas the tagging of v-PEG was
less specific and efficient then m-PEG under the same reaction conditions (Fig. 14D).
The results are in accordance with the previous data [79,80]. Therefore, m-PEG is
recommended for protein cysteine tagging of cell lysate after ammonium precipitation.
3.3. M-PEG tagging in other redox-sensitive proteins
One of the advantages of this m-PEG tagging method is that many proteins can be
monitored using the same cell lysate treated with m-PEG. Here we presented this
application by surveying several redox-sensitive proteins. Procaspase 3, procaspase 9
(Fig 15A), glutathione reductase, B-cell lymphoma 2 (Bcl-2), histone deacetylases 6
(HDAC-6), nucleoside diphosphate kinase (nm23), and fatty acid synthases were shifted
to higher molecular forms caused by m-PEG treatment (Fig. 15B). On the other hand,
the signal of immunoblotting for calpain, glutathione reductase, calcium/calmodulin
dependent protein kinase II (CamkII), nuclear factor kappa B (NFκB),
deoxythymidylate kinase (DTYMK) vanished on treatment of m-PEG (Fig. 15C),
possibly because that the recognition of these proteins by the corresponding antibody
was hindered by m-PEG labeling.
3.4. Quantitating the redox status of proteins in cells
To examine if m-PEG labeling can accurately reflect the redox status of a given
protein in cell lysate, we applied this method to assay cells treated with oxidative stress.
Cysteine thiol oxidation would lead to a differential tagging efficiency of target protein,
and for m-PEG causing a mobility change of tagged protein, it could be detected in
immunoblotting, so that able to be quantitated by integrating the immunoblotting
signals.
First, we utilized an extreme in vitro oxidation example to confirm whether oxidation
cause a difference in m-PEG tagging. We examined the redox status of peroxiredoxin
and Hsp27 in HeLa cell lysate that treated with 10 mM H2O2 in vitro. Most molecules
of peroxiredoxin and Hsp27 were tagged by m-PEG without oxidant treatment, while
few molecules were attacked by m-PEG after oxidant treatment (Fig. 16A, B). It
suggested that most molecules were oxidized by H2O2.
To describe the estimation of redox status, herein we proposed a scoring system,
which could be applied to any particular protein from the m-PEG tagging results. The
equation is as follows:
Redox!score! = !f0!×!20! + !f1!×!21!+!. . . +!fn!×!2n
Formula 1!
where f0 is the fraction of nonshifted signal over total, fn is the fraction of n-tagged
signal over total. Take PHB for example, while without H2O2 treatment, nearly all PHB
was tagged, which could be presented as score of 1, whereas with H2O2 treatment led to
almost completely labeled and presented as 0 (Fig. 16C). Higher redox scores indicate
more reduced status of proteins.
3.4.1. H
2O
2-induced peroxiredoxin and Hsp27 oxidations in HEK cell
Following, we applied this method to two examples of in cellulo oxidations. Cultured
HEK cells were treated with 0-10 mM H2O2 for 10 min and lyzed the cells with the cell
lysis buffer containing 1 mg/ml PEG (Fig. 17B) or treated the cell lysate with m-PEG
after ammonium sulfate precipitation (Fig. 17A). The m-PEG tagging reactions were
allowed at 37 °C for 30 min. m-PEG tagging was not efficient without prior ammonium
sulfate precipitation.
Peroxiredoxin in HEK cells exhibited four different redox status as suggested by the
non-shifted and three shifted forms (Fig. 17A). Treatment of H2O2 in HEK cells
resulted in changes in the redox status of peroxiredoxin, especially marked increase in
doubly tagged (shifted2) and decrease in triply tagged (shifted3) one.
For Hsp27, which containing only one cysteine residue, singly tagged Hsp27
decreased and non-tagged Hsp27 increased in the m-PEG tagging pattern (Fig. 18A). In
addition, the ratio of shifted/nonshifted signal of Hsp27 was significantly decreased
following 10 mM H2O2 treatment (Fig. 18B).
For peroxiredoxin, treatment of 1 mM and 10 mM H2O2 displayed the redox score of
3, 3.04 and 2.5 (Fig. 17A), and for Hsp27, the redox score was decreased from 1.46 to
1.39 and 1.14 (Fig. 18A).


![HPSH [ 氧化數平衡反應式係數 ]](data:image/gif;base64,R0lGODlhAQABAIAAAP///wAAACH5BAEAAAAALAAAAAABAAEAAAICRAEAOw==)