國立臺灣大學理學院地質科學系 博士論文
Department of Geosciences College of Science
National Taiwan University Doctoral Dissertation
Earthworm 平台應用於臺灣地震速報預警研究
Development and Study of Earthworm Platform for Earthquake Early Warning in Taiwan
陳達毅 Da-Yi Chen
指導教授:吳逸民 博士 Advisor: Yih-Min Wu, Ph.D.
中華民國 104 年 7 月 July 2015
1
誌 謝
感謝吳逸民老師帶領學生進入地震預警研究領域。在學期間隨老師 到菲律賓、印度、越南及韓國等地,參觀地震觀測機構並進行地震觀測 技術交流,讓學生增廣見聞,受益匪淺。謝謝吳老師的照顧和教導,學 生銘記於心。感謝溫國梁老師與郭陳澔老師在口試時細心的指導與中肯 的建議,讓學生明白論文不足之處,瞭解未來發展方向。感謝金台齡老 師在電腦程式上的幫助,讓學生了解如何撰寫網路程式。感謝樂鍇老師 從在台大當博士後期間開始到現在到成大任教,一直給予研究上的建議 與協助。
感謝中央氣象局提供在職進修機會,讓我能夠兼顧工作與學業。氣 象局提供的環境與資源是這篇論文能夠完成的最主要因素。特別感謝蕭 乃祺簡正、張建興簡正與蕭文啟技正的指導與照顧。時常在生活上、工 作上與學業上提供的協助,讓我一路走來從一個氣象局地震中心的菜 鳥,變成一個能夠獨當一面的學者。
感謝研究室同學們的幫忙,讓口試過程一切順利。感謝研究室助理 們辛苦的維護系統,安排每次研究室 meeting 時的大小事宜。感謝吳老 師提供場地,在七堵 meeting 時,熱烈的學術討論、清淨舒服的環境、
好吃的烤鴨與竹筍湯以及溫暖的氣氛,讓我發現原來做研究也可以這麼 怡人。
最後,感謝父母的養育之恩,讓我從小到大都能一路順利的念書與
學習。感謝太太宜峰的體諒與支持,讓我可以做喜歡的事情,安心地念
書,做研究。
2
摘要
地震預警系統在中央氣象局運作超過十年,過去僅有少數特定機構接收 此系統產生的預警訊息。從 2012 年起中央氣象局使用 Earthworm 平台 整合來自不同種類的即時觀測資料,並且以此系統進行臺灣地震活動監 測。本研究發展的 Earthworm Based Earthquake Alarm Reporting (eBEAR) 系統與過去系統相比,能夠縮短資料處理時間並且提升預警資訊的精準 度。eBEAR 系統中包含三個於 Earthworm 環境下新開發的模組。這些 新的模組可以處理:P 波到時挑選、波相組合、地震定位、規模計算及 預警訊息發布。本論文主要內容在闡述 eBEAR 系統的方法與成效。為 了調整此系統,選取 154 個規模 4.0 到 6.5 地震進行離線測試。測試結 果顯示,平均地震定位誤差為 4.2 公里,規模誤差為 0.3,系統發佈預 警訊息時間為地震發生之後 14.7 秒。另外,實際系統運作情形顯示對 於島內及島外地震,平均處理時效分別為地震發生之後 15 秒及 26 秒,
比起過去的預警系統平均島內地震快 3.2 秒,島外地震快 5.5 秒。目前
eBEAR 系統已經將預警訊息於地震發生之後,即時地傳遞到全國中小學,以爭取在強烈地震波抵達學校前的數秒到數十秒時間發出警報。為 持續提升地震監測能力,強化地震預警系統,本研究將 543 個低價位地 震儀與中央氣象局地震觀測網整合,建置更高密度地震觀測網。選取 46 個規模 4.5 到 6.5 地震進行離線測試。測試結果顯示,系統發佈預警 訊息時間可從地震發生之後 14.7 秒,進步到 13.1 秒。
目前地震預警系統仍存在許多待突破的困難,本文建議如下:對於測
站覆蓋的空缺角(GAP)過大時,造成地震定位精確度不良的問題,透過
3
分析現有測站覆蓋度,建議在台灣東部地區增加測站密度;對於規模大 於 7 以上地震可能造成的規模低估情形,建議延長 P 波時間窗,以利完 整記錄斷層錯動時所釋放的能量;對於短時間內發生數個地震導致預警 系統可能漏報的情形,建議以即時震度分布圖估算地震大略位置與規 模。
由於即時地震資料無論是來自不同的地震觀測儀器,或是來自不同 的地震觀測機構,都能夠經由 Earthworm 軟體整合至同一個作業平台。
因此在 Earthworm 環境下所發展的地震預警系統(eBEAR)能夠有效地在 不同的觀測環境下運作。目前 eBEAR 系統已經在印度、韓國及太平洋 海嘯警報中心等機構測試。
關鍵字: 地震預警、地震網、P 波預警、Earthworm、Palert
4
Abstract
For more than 10 years, the Central Weather Bureau of Taiwan has operated an earthquake early warning (EEW) system and has issued warnings for specific agencies.
Since 2012 the Earthworm platform in Taiwan has been used to integrate real-time seismic data streams from different types of seismic stations and to monitor seismicity.
Using the Earthworm platform, the Earthworm Based Earthquake Alarm Reporting (eBEAR) system is currently in development for shortening reporting times and improving the accuracy of warnings for EEW purposes. The eBEAR system consists of new Earthworm modules for managing P-wave phase picking, trigger associations, hypocenter locations, magnitude estimations, and alert filtering prior to broadcasting.
Here, we outline the methodology and performance of the eBEAR system. To calibrate the eBEAR system, an offline test was implemented using 154 earthquakes with magnitudes ranging from ML 4.0 to 6.5. Comparing between the eBEAR and the CWB catalog the results from the offline test show that the epicenter error is about 4.2 km, the standard deviation of magnitude is about 0.3, and the reporting time is about 14.7 s.
Additionally, in a comparison of online performance using the current EEW system, the eBEAR system reduced reporting times and improved the accuracy of offshore
earthquake locations and magnitudes. Online performance of the eBEAR system indicated that the average reporting times afforded by the system are approximately 15 and 26 s for inland and offshore earthquakes, respectively. The eBEAR system in average can provide more warning time than the current EEW system (3.2 s and 5.5 s for inland and offshore earthquakes, respectively). The eBEAR system now delivers warnings to
5
elementary and junior high schools in Taiwan. For further improving the capabilities of monitoring earthquakes, an EEW system with dense seismic network is constructed by deploying a total of 543 low-cost sensors in Taiwan and incorporating with the official seismic network of Taiwan’s Central Weather Bureau (CWB). The experiment results show that the integrated system can have stable results of source parameters and issue alarms faster (from 14.7 s to 13.1s) than the current system run by only the CWB seismic network (CWBSN).
Key Words:
Earthquake Early Warning, Seismic Network, P-wave method, Earthworm, Palert
6
Contents
Acknowledgements………..1
Chinese Abstract………..2
English Abstract………...4
Contents………....…6
List of Figures...8
List of Tables...10
1 Introduction………...11
1.1 Motivation and Research Goal………...11
1.2 Concept of EEW………..………..……….12
1.3 Worldwide EEW Development……….…………..……...…14
1.4 Taiwan EEW system………..….…15
1.5 Earthworm for EEW system………..…….17
1.6 Dissertation Plan………...…..18
2 Methods and EEW Modules………...19
2.1 Earthquake Location Estimation...19
2.2 Earthquake Magnitude Estimation...21
2.2.1τc method………..………..22
2.2.2 Pd method………..23
2.3 Earthworm System...24
2.4 EEW Modules…...25
2.4.1 PICK_EEW Module...26
2.4.2 TCPD Module...27
2.4.3 DCSN Module...29
3 eBEAR System in CWB………...32
3.1 CWB Seismic Network………32
3.2 eBEAR System Configuration...38
3.3 Offline Test………...40
3.4 Online Performance………...43
7
3.5 EEW Disseminations………...47
4 Low-cost seismometer for EEW...51
4.1 Palert Seismic Network…………...51
4.2 System Configuration…...52
4.3 Magnitude Estimations Using Palerts…………...56
4.4 Offline Test…………...59
4.5 Summary...66
5 A Case Study for MW7.6 Chi-Chi Earthquake...68
5.1 Signal Intteruption...69
5.2 System Configuration...72
5.3 Results...73
5.4 Summary...76
6 Discussion and Conclusions………...80
6.1 Station Coverage...80
6.2 Magnitude Saturation...82
6.3 Multi-Events...83
6.4 Application to Earthquake Rapid Reporting System………..84
6.5 Conclusions...85
Reference
...88Appendix ………98
A. Earthworm Software………...……….98
A.1 Earthworm Installation……….……….98
A.2 Earthworm Features………...…….103
B. CWB24 Format………..109
C. Configure files of EEW modules………..……….111
D. Online Display of EEW System………...………..115
E. Publications at National Taiwan University………..117
8
List of Figures
Figure 1-1. Relationship of warning time and epicentral distance. (Satriano et al., 2011)……..13
Figure 2-1. Geometry for velocity given by v = v(z) (Lee et al., 1992)....20
Figure 2-2. Travel time vs. distance for layer over half-space model (Lee et al., 1992)………..21
Figure 2-3. Two main components in the Earthworm diagram.....25
Figure 2-4. A flowchart for data processing within the eBEAR system....26
Figure 2-5. A flowchart of the algorithms designed for the PICK_EEW module...27
Figure 3-1. The station distribution of the CWB Seismic Network...33
Figure 3-2. A schematic diagram of the data processing center………...37
Figure 3-3. A flowchart of the algorithms designed for the PICK_EEW module………40
Figure 3-4. A comparison between the offline test and the CWB published catalog…………...42
Figure 3-5. The relationship between reporting time and station coverage gap………...43
Figure 3-6. Comparisons of location error between the eBEAR and VSN system...45
Figure 3-7. Online magnitude error comparison between the eBEAR and VSN system...46
Figure 3-8. Online reporting time comparison between the eBEAR and VSN system...46
Figure 3-9. Online warning time comparison between the eBEAR and VSN system…...47
Figure 3-10. Graphical output of the eBEAR system...49
Figure 3-11. EEW disseminations of the eBEAR system...50
Figure 4-1. Low-cost seismometer...51
Figure 4-2. The station distribution of the two seismic networks...52
Figure 4-3. A schematic diagram of the data processing of combined seismic network………55
Figure 4-4. Relationships between the EEW parameters of combined system………55
Figure 4-5. Examples of the automatic P-wave arrival detection………...58
Figure 4-6. The comparisons of location error between CWBSN and ISN………..……60
Figure 4-7. The comparisons of magnitude error between CWBSN and ISN…………..………65
Figure 4-8. The comparisons of reporting time between CWBSN and ISN……….65
Figure 4-9. The comparisons of blind zone radius between CWBSN and ISN……...………66
Figure 5-1. Distribution of real-time strong-motion stations of CWB...70
Figure 5-2. Seismograms recorded in the Chi-Chi Earthquake………....71
9
Figure 5-3. System configuration for a case study of Chi-Chi earthquake...75
Figure 5-4. Simulation results for six stages after the earthquake occurrence...76
Figure 5-5. Pd values of the Chi-Chi earthquake……….……….79
Figure 6-1. Station coverage and density………...81
Figure 6-2. Damage earthquakes in Taiwan (Hsiao et al., 2011)………...81
Figure 6-3. Timeline of the 2015 Hualien earthquake...84
Figure 6-4. System architecture of the ERR system and EEW system....87
10
List of Tables
Table 1. eBEAR Picker ( PICKˍEEW ) parameters...31 Table 2. Data for offline test in integration system...61
11
Chapter 1 Introduction
1.1 Motivation and Research Goal
An EEW system is a practical tool for mitigating earthquake hazards. EEW systems are capable of estimating the occurrence time, location, and magnitude of an earthquake and of issuing warnings before strong ground shaking hits a target area. With timely information, people and manufacturing facilities are able to take the necessary precautions to reduce the seismic hazards caused by large earthquakes.
Taiwan is located on one of the most active seismic zones in the world, in an area where the Philippine Sea plate moves toward the Eurasia plate at approximately 7 cm/yr (Yu et al., 1997). When two tectonic plates collide, stresses accumulate then cause earthquakes. The largest damaging inland earthquake to strike Taiwan in the past 20 years was the 1999 Mw 7.6 Chi-Chi earthquake (Shin and Teng, 2001). Because of rapid urbanization in Taiwan, seismic risks have recently increased. For example, the March, 31st, 2002 Mw 7.1 eastern Taiwan offshore earthquake caused strong ground shaking inside the Taipei basin (Huang et al., 2010). During strong ground shaking, a crane operating on top of the construction area of the Taipei 101, the tallest building in Taiwan (508 m tall), crashed and dropped to the ground. The March, 4th, 2010 Mw 6.3 Jiasian earthquake brought strong ground motions to southern Taiwan, causing an operating Taiwan High Speed Rail train to run off its tracks (Huang et al., 2011; Wu et al., 2011).
Given these types of incidents in Taiwan, a reliable and fast EEW system is urgently
12
needed to provide early warnings for next large earthquakes.
The purpose of this research is to develop a new EEW system with advanced improvements. Three Earthworm modules were created for managing P-wave phase picking, trigger associations, hypocenter locations, magnitude estimations, and alert filtering prior to broadcasting. Moreover, a low-cost seismic network has been incorporated into the official CWBSN for EEW purpose. Although, some problems existing in the EEW system are not easy to be solved. These problems including earthquakes occurred outside seismic network, magnitude saturation, and multi-event occurred within a short time, were also discussed in this research.
1.2 Concept of EEW
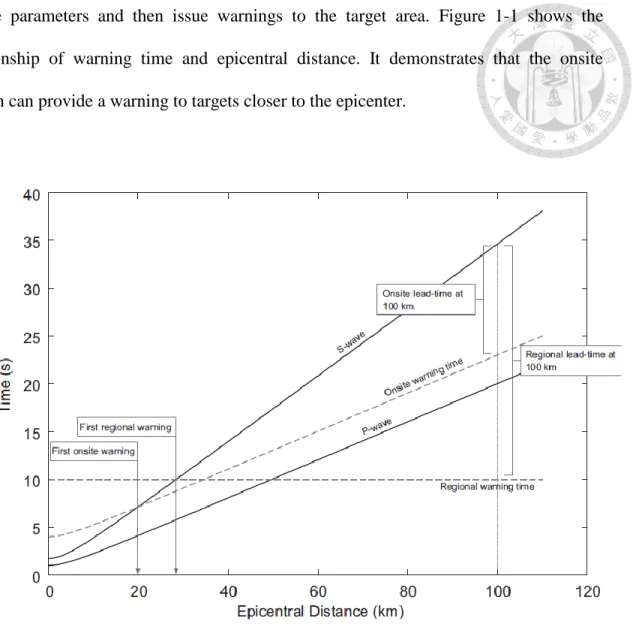
EEW systems are designed to provide warnings to people or pre-programmed systems before the intense ground shakings may cause damage to target areas. Because the velocity of seismic waves (about 3.5 km/s for S wave) is slower than the speed of communication, it is possible to obtain several to several tens of seconds for reducing damages. With a timely issuance of earthquake information (location and magnitude) provided by EEW systems after large earthquakes, we can take immediate precautions against seismic hazards. In general, there are two types of EEW systems. One is on-site EEW system in which the seismometers are deployed in the protected area. This kind of system uses the information of P waves, which propagates faster, to predict the later S waves which have larger amplitudes. The other one is regional EEW system in which the seismometers are deployed in some remote sites from the protected area. This kind of system uses information from those seismometers near the epicenter to determine certain
13
source parameters and then issue warnings to the target area. Figure 1-1 shows the relationship of warning time and epicentral distance. It demonstrates that the onsite system can provide a warning to targets closer to the epicenter.
Figure 1-1. Relationship of warning time and epicentral distance. (Satriano et al., 2011)
Currently, the earthquake locations can be well determined by the P-wave arrivals obtained by dense stations around the source area (Rydelek and Pujol 2004; Satriano, 2008). However, the most challenging work in EEW system is to improve the reliability and accuracy of the empirical method for estimating earthquake magnitude since only the initial portion of seismic waves are used. Based on the precise magnitude and hypocenter estimates, the ground motion can be predicted reliably. On the other hand, overestimation and underestimation of earthquake magnitude may lead to releases of false or missed
14
alarms that would result in additional economic loss and societal impacts.
1.3 Worldwide EEW Development
The EEW system is becoming a key practical tool for mitigating loss due to seismic events. Depending on the distance to the earthquake, it provides a few seconds to a few tens of seconds warning for people and automated facilities. Currently, many countries have an online operating or experimental EEW system, such as Japan (Nakamura 1988;
Odaka et al., 2003; Horiuchi et al., 2005; Wu and Kanamori 2008b), Taiwan (Wu et al., 1998; Wu et al., 1999; Wu and Teng 2002; Hsiao et al., 2009; Hsiao et al., 2011), Mexico (Espinosa-Aranda et al., 1995; Espinosa-Aranda et al., 2009), the United States (Allen and Kanamori 2003; Wu et al., 2007; Allen et al., 2009; Bose et al., 2009a), Italy (Zollo et al., 2006; Zollo et al., 2009), Turkey (Alicik et al., 2011), Beijing (Peng et al., 2011), and Romania (Bose et al., 2009b).
The station coverage gap (GAP), defined as the angle between epicenter and two adjacent stations, can be used as a metric for evaluating the quality of an EEW report (Wu et al., 1997; Wu et al., 2013a). A dense seismic network can provide a sufficient number of triggered stations to reach the good coverage of seismic stations (e.g., a small value of GAP) within a relative short time after an earthquake occurs. Therefore, it can be a potential solution to provide faster and more reliable earthquake early warnings. However, it is expensive to deploy a large number of traditional seismic stations. Fortunately, recent advances in electrical and mechanical technologies have made it possible to build low-cost seismometers for constructing dense seismic networks. Holland (2003) first monitored earthquakes using seismic data streams from low-cost seismometers and
15
short-period seismic sensors. The concept of home seismometers has been implemented in Japan (Horiuchi et al., 2009). The Quake Catcher Network (QCN) project is able to rapidly expand and increase the density of ground-motion observations with relative low cost (Cochran et al., 2009). The QCN initiated Rapid Aftershock Mobilization Programs (RAMP) following the 2010 M7.2 Darfield, New Zealand, earthquake (Lawrence et al., 2014), respectively. The results demonstrated that the QCN can be used to detect and locate moderate to large earthquakes, and estimate their magnitudes using ground-motion parameters. The Self-organizing Seismic Early Warning Information Network (SOSEWIN) has been tested in Istanbul based on wireless communications (Fleming et al., 2009).
1.4 Taiwan EEW Development
Over the years, many studies have been conducted regarding the development of an EEW system in Taiwan. In 1995, an earthquake rapid reporting system began operating on the basis of 16-bit strong-motion seismometers and was a type of early-stage EEW system for Taiwan (Wu et al., 1997). Although the system could not issue warnings prior to large ground shaking, it provided rapid reporting within 102 s for the Chi-Chi earthquake and was the leading technology at that time (Wu et al., 2000). As EEW system necessity demanded, the Central Weather Bureau (CWB) was the first to test an EEW prototype system within the Hualien area in Taiwan. To reduce reporting times and provide early warnings for distant metropolitan regions, a new idea, based on the prototype system, was proposed for applying the subnetwork method to earthquake monitoring (Wu et al., 1999). Using the subnetwork concept and ML10, a quick magnitude
16
determination method (Wu et al., 1998) that adopted 10 s records following the first P-wave arrival, the current EEW system (the virtual subnetwork [VSN] system) was built and achieved an average 22 s reporting time (the time between an earthquake’s origin time and the time the EEW system issues a report) (Wu and Teng, 2002). However, due to the limits of the ML10 method, the reporting time could not be reduced to within 10 s.
To further reduce reporting times, the P-wave method, based on the peak amplitude of displacement records (Pd) for the vertical component using a 3 s time window for magnitude determinations (Wu and Zhao, 2006), was tested and operated (Hsiao et al., 2009, 2011). The CWB has recently upgraded seismic facilities within the original seismic network and deployed 30 borehole stations, as well as one cable-based ocean-bottom seismic station. At the same time, to enhance the density and coverage of station distributions, real-time seismic data streams from various seismic networks were integrated using the Earthworm platform, a program originally developed by the U.S.
Geological Survey (Johnson et al., 1995). Based on the above, an Earthworm-based EEW prototype system was constructed and has been tested since 2007 (Hsiao et al., 2011;
Chen et al., 2012).
In addition, some experimental on-site EEW systems have been tested and operated as well. Wu et al., (2006) determined the relationships between the earthquake magnitude and characteristic parameters from the first three seconds of the P-wave. They demonstrated that single-station approach can be used to estimate earthquake magnitudes well. Wu et al., (2011) demonstrated that the on-site EEW system can provide valuable information to the Taiwan High Speed Railway in the 2010 JiaSian earthquake. The National Center for Research on Earthquake Engineering (NCREE) has developed neural
17
network method for predicting structural response in on-site EEW system (Lin et al., 2011). The on-site EEW system has been put into practice in elementary schools in Taiwan (Lin, 2011). Some Micro Electro Mechanical Systems (MEMS) sensors have been developed for EEW system. The National Taiwan University (NTU) and the San Lien Corporation, a high-tech oriented company (http://www.sanlien.com.tw), have developed an accelerometer, named Palert, based on MEMS technology. The Palert Seismic Network (PSN) has been tested and operated for both on-site and regional EEW systems by NTU since 2010 and is capable of providing high quality and stable data streams for earthquake monitoring (Wu et al., 2013b; Hsieh et al., 2014; Wu, 2014).
1.5 Earthworm for EEW system
Earthworm is a popular software for real-time earthquake monitoring. It has been used all over the world. There are five advantages of the Earthworm system. First, Earthworm is free and open source. It makes the system operator easy to modify it and save cost. Second, Earthworm can receive real-time data streams from different kinds of seismic instruments. Even those sensors are made from different companies, Earthworm is able to integrate all data in the same platform. Third, Earthworm was composed by modules. Users can take different set of modules to construct their own Earthworm system. Moreover, because modules are running separately, users can create new modules without disturbing current modules. Forth, in the same computer, Earthworm uses shared memories for communicating message with other modules. Among different computers, Earthworm use TCP/IP protocol to exchange messages. In this way, Earthworm can efficiently exchange message among modules and process data in parallel.
18
Compared to the former EEW system in Taiwan, Earthworm system provides an excellent opportunity to improve the construction of the EEW system. Instead of using telephone line for real-time data transmitting in old EEW system, for modern system, data are packed as 1-sec length packet and transmitted based on TCP/IP protocol. Earthworm can integrate all data and be a server to provide real-time waveforms to clients as long as the internet is available. In addition, Earthworm can process data in memory. It is more efficient than processing data using text or binary files.
1.6 Dissertation Plan
In this dissertation, the fundamental EEW concepts and the review of EEW researches are introduced in chapter 1. Methods of location and magnitude estimations, and EEW modules are described in chapter 2. EEW system in CWB is described in chapter 3. Integrating low-cost seismic network and official seismic network is described in chapter 4. A case study of the Mw 7.6 Chi-Chi earthquake is described in chapter 5.
Discussion and Conclusions are described in chapter 6.
19
Chapter 2
Methods and EEW Modules
2.1 Earthquake Location Estimation
Consider a one-dimensional continuous velocity model, shown as Figure 2-1. In this case, the ray equation becomes:
where the velocity, v(z), is a function of depth (z), ds is the differential of ray path. In Figure 2-1, the direction cosines are:
Then, a ‘Snell’s Law’ can be obtained:
where p is called the ray parameter. The velocity is given by:
Where go and gz are constants, z is depth. In Figure 2-1, the center of this arc is given by:
The travel time of this linear velocity is:
20
Finally, the spatial derivatives of travel time, T, at the source are:
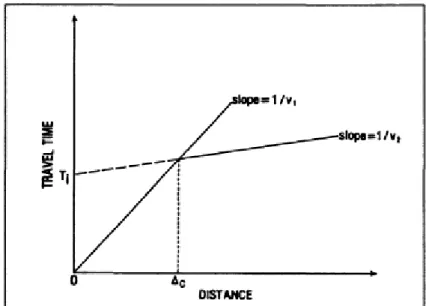
In the procedure of the Geiger’s method (1910, 1912), a half-space model was used to calculate the predicted travel times. Figure 2-2 shows the relationship between the travel time and the distance.
Figure 2-1. Geometry for velocity given by v = v(z) (Lee et al., 1992).
21
Figure 2-2. Travel time vs. distance for layer over half-space model. (Lee et al., 1992)
2.2 Earthquake Magnitude Estimation
To precisely measure the size of an earthquake, we must take a certain length of time window extending after the P-wave arrival until the enough observed waveforms are available. This time window has variant values depending on different EEW algorithms and is one of the components adding a delay to the overall alert time (Behr et al., 2015).
For EEW purposes, it is necessary to detect earthquake magnitude in the beginning stage of the earthquake occurrence. Wu and Teng (1998) used an empirical method to correlate local magnitude and the predicted magnitude over 10 seconds after the first P-wave arrival is detected. Recently, P-wave methods has been widely studied and implemented in EEW systems. There are two kinds of the P-wave methods. One is associated with the frequency content of the initial waveforms. Allen and Kanamori (2003) has proposed a method based on the predominant period (τp) measured over a varying time window after the P-wave arrival. When 1-, 2-, 3-, and 4-s time window of data are available, the τp
22
values are measured and the magnitude would be updated. In addition, the average period parameter (τc) of the initial 3-s P waves can be used for estimating magnitudes (Wu and Kanamori, 2005). The other kind of P-wave method is associated with the amplitude content of the initial waveforms. Wu and Zhao (2006) take the peak amplitude in vertical displacement (Pd) over a 3-s time interval after P-wave arrival. They showed that the upper limit of the magnitude prediction is 6.5 because the time window is too short to contain whole rupture information from larger events. Using the combinations of P and S wave signals, Zollo et al., (2006) demonstrated that the peak displacements measured in 2-s P-wave time window and 2-s S-wave time window can be correlated with magnitude in the ranged from 4.0 to 7.4. Lancieri and Zollo (2008) used peak displacement over 2- and 4-s P-wave time window and 1- to 2-s S-wave time window with Bayesian approach to estimate magnitude at each time step.
2.2.1 τ
cMethod
Following the procedure from Wu and Kanamori (2005a), take the ground-motion displacement, u(t), and velocity, u’(t), from the vertical component record and compute the following ratio r by
where the integration is over the time interval (0, τ0) after the onset of the P wave.
Usually, τ0 is set at 3 sec. Using Parseval’s theorem,
23
where uˆ(f) is the frequency spectrum of u(t), and <f 2> is the average of f 2 weighted by
|uˆ(f)|2 . Thus,
can be used as a parameter representing the period of the initial portion of the P wave.
The largerτc is, the larger the event is. Following Wu et al., (2007), a regression equation can be used for magnitude estimation:
2.2.2 P
dMethod
The peak amplitude of the initial P-wave displacement, Pd, reflecting the attenuation relationship of the ground motion with distance, can be used as an amplitude parameter to predict sizes of earthquakes. Therefore, if we can determine the attenuation relationship of Pd, then we can use Pd to estimate the magnitude when the hypocentral distance is available. Only vertical-component records are used to determine Pd. The seismograms are integrated once or twice to obtain the displacement and then a 0.075 Hz high-pass recursive Butterworth filter is applied to remove the low-frequency drift after the numerical integration. We assumed a linear relationship among the logarithmic Pd, the magnitude M and the logarithmic hypocentral distance R:
24
where A, B and C are constants to be determined; R is hopocentral distance; M is magnitude; the units of Pd and R are cm and km, respectively.
2.3 Earthworm System
Earthworm is a software originally developed by the United States Geological Survey (USGS) since 1994. The preliminary purpose was to construct a system which is able to quickly notify earthquake information to the public. Earthworm has been developed and improved continuously by users because Earthworm is a free and open-source software. Currently, Earthworm has become a robust and well tested software. Many earthquake monitoring center use this software to detect earthquakes and archive waveform records. The software has also been successfully extended to volcano observation and is also used in many tsunami centers.
Because of two main components in the earthworm, the system can be enlarged and become more dedicate. Figure 2-3 shows the two main components in the Earthworm (module and shared memory). With shared memories, modules can exchange information directly in the memory. Every Earthworm system can have different compositions of modules and shared memories. Based on this design, the Earthworm system is very flexible and maintainable.
25
Figure 2-3. Two main components in the Earthworm diagram. The rectangle represents a module; the circle represents a shared memory. Modules can exchange data with shared memories.
Earthworm is a command-line based system. It is not easy to install and be understood.
The procedure of Earthworm installation described in Appendix A.1 is useful for quickly setup Earthworm system. In addition, a summary of the Earthworm features are described in Appendix A.2.
2.4 EEW Modules
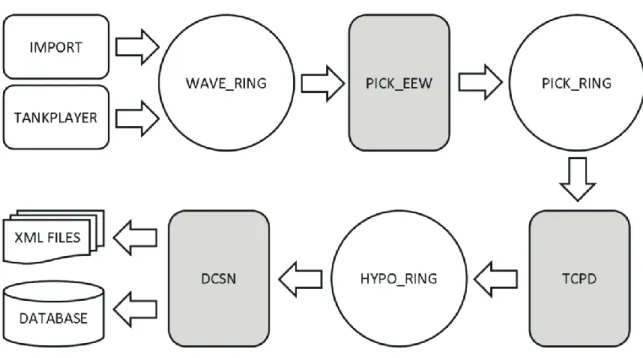
An Earthworm diagram that describes data flow within the eBEAR system is provided in Figure 2-4. For system calibration, we ran the system in offline mode using the TANKPLAYER module. To receive real-time data for online operations, we applied the IMPORT module. The three circles provided in Figure 2-4 represent shared memories within Earthworm. The first shared memory, WAVE_RING, contains waveform data that can be processed using the PICK_EEW module to determine P-wave arrivals, as well as the peak amplitudes for P-wave displacement (Pd), velocity (Pv), and acceleration (Pa) within a 3 s time window. The second shared memory, PICK_RING, not only contains
26
information from the PICK_EEW module, but also provides information to the TCPD module for generating earthquake messages, including source parameters. When an earthquake occurs, the TCPD module may update information for the event and create earthquake messages. Updated earthquake messages are stored within the third shared memory, HYPO_RING. At the end of the process, the DCSN module filters earthquake messages using specific criteria (as discussed later) and generates EEW reports for broadcasting as an XML-formatted file.
Figure 2-4. A flowchart for data processing within the eBEAR system.
2.4.1 PICK_EEW Module
The original Earthworm module, PICK_EW, requires time to check the seismic coda term within the auto-picking procedure. The work is time consuming and not suitable for EEW systems. Therefore, we created a new module named PICK_EEW by revising the module to run without checking the seismic coda term. To avoid false pickings caused by
27
background noise, we also added two parameters, Pa and Pv. Because seismic waveforms from field stations have different noise levels depending on vibrations from the natural environment or artificial activities, these two parameters can be used as thresholds for ignoring spikes caused by noise. Table 1 provides the parameters we used in the PICK_EEW module of the eBEAR system. The parameters are modified from the Earthworm’s module named PICK_EW. Some parameters related to the coda term are eliminated. Two parameters, Pa and Pv, are added.
Figure 2-5 displays the procedure for P-wave autopicking. The PICK_EEW module declares possible picks based on the short-term average (STA) and long-term average (LTA) algorithm. To become a candidate pick of a seismic trace, the ratio of STA/LTA should be greater than two times a certain threshold. Following a pick based on the threshold, and to distinguish ground noise and the seismic signal, we considered three additional conditions: the number of zero crossings, the signal-to-noise ratio, and the Pa and Pv. Using this procedure, the module was able to qualify the candidate pick as a valid seismic pick. In practice, because each seismic station has different background noise, we tested different sets of picking parameters by performing an offline test.
Figure 2-5. A flowchart of the algorithms designed for the PICK_EEW module.
2.4.2 TCPD Module
After the TCPD modules jointly trigger using a space–time window based on
28
expected travel times, the event hypocenter is estimated using two steps. For determining the event epicenter, the module first adopts Geiger’s method, an inversion process using a half-space velocity model in which velocity linearly increases with depth. For estimating event depth, the module then uses a grid search method with depths ranging from 10 to 100 km in steps of 10 km. Theoretical travel times to each station are calculated and compared to those observed at each depth. Finally, the depth with minimum residuals and the epicenter determined by Geiger’s method are considered as the event hypocenter. The procedure is performed within the TCPD module via an updating process. At the beginning of the process, after at least six picks of seismic waveforms, the TCPD module begins to locate an event. When the root mean square of travel-time residuals resulting from the inversion process is larger than 0.8, the pick with the largest travel-time residuals is removed and the inversion process is again performed. When additional picks of seismic waveforms participate, the procedure of hypocenter determination is repeated and the estimated hypocenter is updated.
Earthquake magnitudes are predicted using the initial portion of P-wave peak displacement Pd within the 3 s time window. Following a double-integrated, strong-motion, and integrated broadband, the PICK_EEW module applies a 0.075 Hz high-pass filter to displacement records. The Pd value is then used to estimate magnitude (MPd) based on empirical formula. The empirical formula for borehole stations has not yet been established. Earthquake magnitude is estimated by obtaining an average for each MPd value from each seismic station. However, the false picking of P-wave arrivals, the directivity effect, and site effects may lead to unreasonable MPd values. For obtaining robust estimations of magnitude and to reduce errors, three steps are applied. First, only
29
MPd values within one standard deviation of the dataset are used. Next, each record is weighted according to P-wave travel-time residuals. The weighting factor is expressed as
2
1 1
i
i R
W
(1)
in which Wi is the weighting factor of each MPd value and Ri (in seconds) is the P-wave travel-time residual for each corresponding MPd value. Finally, a weighted average for obtaining earthquake magnitude is expressed as
i
i
i X
W
M W
(2)
in which Xi is the MPd value for each station.
2.4.3 DCSN Module
When an earthquake occurs, the number of seismic picks are increased as seismic waves propagate away from the epicenter. As a result, the TCPD module determines the earthquake message and continuously updates that message. We propose that the numbers of updating earthquake messages will increase quickly and will be significant for large and local earthquakes. In contrast, for small earthquakes or for noise, the number of updating earthquake messages will increase slowly and will be small. Therefore, if the EEW system determines a large number of updating earthquake messages for an ongoing earthquake, we consider the EEW information as a reliable warning. To prevent false alarms, the DCSN module always skips the first and second earthquake message generated from the TCPD module. The third earthquake message is the first EEW report
30
to users. The EEW report is written in an XMLformatted file for broadcasting. The EEW report is updated either when differences in the magnitude or the epicenter are larger than 0.5 or 20 km, respectively, as compared to the last EEW report. A user display pops up automatically when an XML-formatted message is received. The display estimates the seismic intensity, the wave fronts of P- and S-waves, and the remaining warning time (defined as the time between the reporting time and the arrival of the S wave to the target area). If the EEW report is updated, the user display directly changes the location of the epicenter and again re-estimates EEW-related parameters.
The DCSN module takes the EEW report from the HYPO_RING for other applications such as generating the XML-formatted messages for clients running the EEW display and warning program provided by the CWB (Chen et al., 2015). The DCSN module will also pop up EEW messages on the corresponding CWB staff’s computers, insert EEW message into the MySQL database, and archive the triggered seismic waveforms.
31
Table 1. eBEARS Picker ( PICK
ˍEEW ) Modified from the PICK_EW
Parameters Short Description Default Value MinSmallZC Defines the minimum number of
zero-crossings for a valid pick within the first second after P-wave arrival.
3 for
broadband or 5 for
acceleration MaxMint The maximum interval (in samples)
between zero crossings.
100 RawDataFilt Sets the filter parameter RawDataFilt
applied to the raw trace data.
0.939 CharFuncFilt Sets the filter parameter CharFuncFilt
applied during calculations of the
characteristic function of waveform data.
3
StaFilt Sets the filter parameter (time constant) StaFilt used in the calculation of the short-term average (STA) of the characteristic function of the trace.
0.6
LtaFilt Sets the filter parameter (time constant) LtaFilt used in the calculation of the long-term average (LTA) of the characteristic function of the trace.
0.15
EventThresh Sets the STA/LTA event threshold. 5 RmavFilt The filter parameter (time constant) used to
calculate the running mean of the absolute value of the waveform data.
0.9961
DeadSta Sets the dead station threshold (counts). 1000000 MinPa (new) Defines the minimum value of peak
amplitude for acceleration (unit is cm/sec
2)
0.01 MinPv (new) Defines the minimum value of peak
amplitude for velocity (unit is cm/sec)
0.0001
32
Chapter 3
eBEAR System in CWB
3.1 CWB Seismic Network
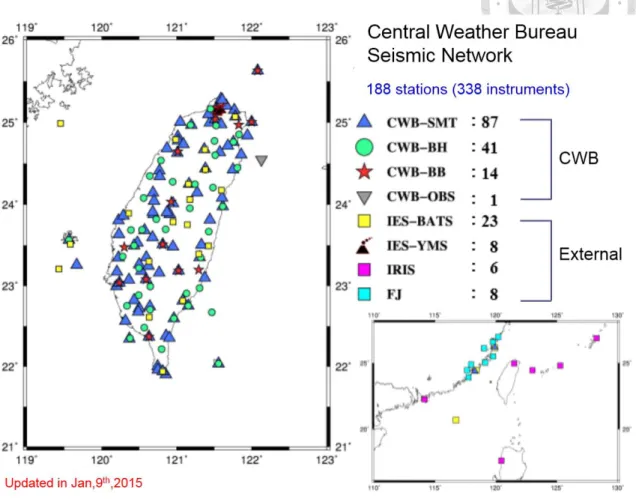
Currently, two seismic networks are operated within the CWB. The first network, the Real-Time Data stream (RTD) seismic network, consists of 110 stations equipped with one Geotech Smart24A seismometer that transmits real-time, strong-motion data to the CWB via 4800-baud leased telephone lines. Each telemetered signal is digitized at 50 samples per second using a 16-bit resolution. The current EEW system, VSN, operates within this seismic network. The second, the Central Weather Bureau Seismic Network (CWBSN), is an upgraded and integrated network that improves data quality, station coverage, and density by integrating various types of seismic stations and seismic networks from other institutes. The eBEAR system is operated under the CWBSN. The station distribution of the CWBSN, which integrates different types of seismic stations operated by the CWB and the Institute of Earth Sciences (IES) of Academia Sinica (which provides waveforms for 23 stations from the Broadband Array in Taiwan for Seismology), is shown in Figure 3-1. In addition, using a connection to buffer uniform data of the Incorporated Research Institutions of Seismology (IRIS), one Japanese station (YOJ) has been merged into the monitoring network and has improved station coverage within the eastern offshore region of Taiwan. Each real-time seismic signal, digitized at 24-bit resolution and obtained using time stamps from a Global Positioning System, is packed and transmitted to CWB headquarters in Taipei via Ethernet or Internet. With the
33
exception of IRIS data at 20 samples per second, digital signals are digitized at 100 samples per second.
Figure 3-1. The station distribution of the CWB Seismic Network.
The CWBSN consists of four types of seismic stations including six-channel seismic stations, broadband seismic stations, borehole seismic stations, and one cable-based ocean-bottom seismic station. Among seismic stations, some have been upgraded from older types, while others have been newly added. Six-channel seismic stations were upgraded and combined from original short-period and strong-motion instruments, digitized at 12- and 16-bit resolutions, respectively (Teng et al., 1997). Prior to station upgrades, two types of instruments were operated separately and transmitted data through telephone lines; signal time was stamped by the central station (Chang et al., 2012). Since
34
2007, using Geotech Smart24A accelerometers to replace the original instruments (Geotech A900A) and to connect Teledyne Geotech S13 short-period sensors, the CWB has combined these two types of seismic signals. As a result, 70 upgraded six-component stations have been constructed, each hosting three-component short-period velocity sensors and one three-component strong-motion sensor.
For EEW purposes, the data loggers located at broadband seismic stations were replaced using modern equipment capable of sending seismic waveforms with a 1 s packet length. The system consists of 23 stations that use one three component broadband seismograph. To prevent clipped waveforms caused by near-field strong shakings, most stations are equipped with an additional three-component strong-motion sensor. Such high-quality waveforms are also used to obtain centroid moment tensor (CMT) solutions (Shin et al., 2013).
In addition, 30 borehole seismic stations are operational. Each hosts a three-component strong-motion seismograph on the surface and a three-component strong-motion seismograph, as well as a broadband seismograph within boreholes at a depth of approximately 300 m from the surface. Seismic signals from borehole seismometers provide waveforms with a high signal-to-noise ratio, useful for improving the accuracy of phase picking. Since 2008, the number of borehole seismic stations has increased by approximately five stations each year. In the near future, the total number of borehole stations will increase to 70.
In November 2011, the first cable-based ocean bottom seismometer, the Marine Cable Hosted Observatory (MACHO), began operating in Taiwan. The MACHO has one seismic station located within the northeastern offshore area of Taiwan, with a cable line
35
length of 45 km, and hosts a three-component strong-motion accelerometer and a three component broadband seismograph (Hsiao et al., 2013). The MACHO is very expensive, and only one station is currently in operation. However, because the Philippine Sea plate subducts beneath the Eurasia plate of northeastern Taiwan and since many large earthquakes have occurred in this area in the past, the MACHO system is critical to the EEW system. The MACHO is capable of detecting seismic waves faster than inland stations.
All CWBSN waveforms are archived in CWB24 Format, shown in Appendix B. The CWB continuously records all seismic waveforms and archives into file every four minutes. Every day the CWB staff manually scan the continuous files and cut individual earthquake as a file. These files can be used for adjusting auto-picking parameters.
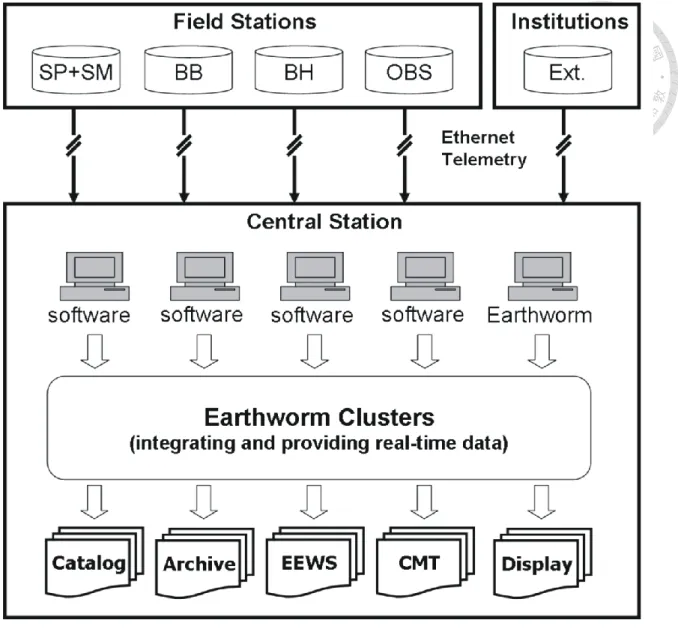
Figure 3-2 provides the system configuration of the CWBSN for a three-layer structure within the data-processing center used for the acquisition, integration, and application of real-time seismic signals. In the first layer, real-time seismic data streams are packaged and transmitted from field stations or external seismic networks then received by commercial software or Earthworm via various Internet Protocol (IP)-based networks. SMARTGeoHub and Scream software packages are used to receive real-time seismic waveforms from instruments made by Geotech and Güralp, respectively. Seismic waveforms from external seismic networks provided by IES and IRIS are received using the Earthworm modules IMPORT_ACK and SLINK2EW, respectively. In the second layer, an Earthworm cluster integrates seismic data streams from different seismic instruments and provides two types of seismic waveforms. One waveform type, WAVE_SERVERV, can store and provide seismic waveforms over a period of time and
36
is used for data displays and archives. The second waveform type, EXPORT_ACK, can provide data streams much faster than the previous one and is used for real-time data processing. For system backup, two computers running WAVE_SERVERV and three computers running EXPORT_ACK are operated in parallel. In the third layer, also called the application layer, several tasks are performed. These include EEW operation, the generation of products obtained from the earthquake catalog and the CMT, the maintenance of the seismic waveform data archive, and the display.
Via its modules and shared memory regions, the Earthworm system is designed for automatic seismic data processing (Johnson et al., 1995). Each module has specific tasks such as data acquisition, processing, and archiving. Adopting shared memory regions makes it convenient for each module to easily receive or broadcast messages such as waveform data, P-wave arrivals, hypocenter, and magnitude. Earthworm prepares seismic-related modules and is open source. Therefore, users can use existing modules or create new modules for specific purposes.
37
Figure 3-2. A schematic diagram of the data processing center. SP indicates short-period stations;
SM indicates strong-motion stations; BH indicates borehole stations; and OBS indicates cable-based ocean bottom seismic stations. “Ext” indicates stations operated by external institutions.
38
3.2 eBEAR System Configuration
Real-time data streams retrieved from seismic stations are integrated in Earthworm system. In order to process data effectively, three Earthworm modules (PICK_EEW, TCPD, and DCSN) were developed in this study. Appendix A. shows the configured files of the three modules. The configured files describe names of shared memories for data in and out. They also defined specific parameters and provide some detail information for the three modules. First, the PICK_EEW module is in charge of detecting onsets of P-wave arrival and estimating Pd andτc values. Thus, the configured file of PICK_EEW provides station information including location, gain factor and specific auto-picking parameters for each channel. Second, the TCPD module is in charge of locating earthquake and estimating magnitude. Thus, the configured file of TCPD provides parameters for associating P-wave arrivals, P-wave velocity model, and other related parameters. Third, the DCSN module is in charge of decision making and delivering EEW information. Thus, the configured file of DCSN provides criteria for alarm release, information of MySQL database, directories for storing XML-formatted file.
The velocity model used in the TCPD module is a one-dimension continuous velocity model. The equation can be shown by:
V(D) = G0 + G ╳ D
where V represented velocity is a function of depth D, G0 and G are constants. The unit of V and D are km/s and km, respectively. In this study, an averaged one-dimension velocity model was obtained from averaging three-dimension velocity model (Wu et al., 2009).
For depth shallower than 40 km:
V(D) = 5.103 + 0.067 ╳ D
39
For depth deeper than 40 km:
V(D) = 7.805 + 0.005 ╳ D
For magnitude estimation, the regression equations are represented as follows:
For BroadBand Sensor:
Mpd = 5.000 + 1.102 ╳ log10 (Pd) + 1.737 ╳ log10 (R) For Acceleration Sensor:
Mpd = 5.067 + 1.281 ╳ log10 (Pd) + 1.760 ╳ log10 (R) For Short-Period Sensor:
Mpd = 4.811 + 1.089 ╳ log10 (Pd) + 1.738 ╳ log10 (R)
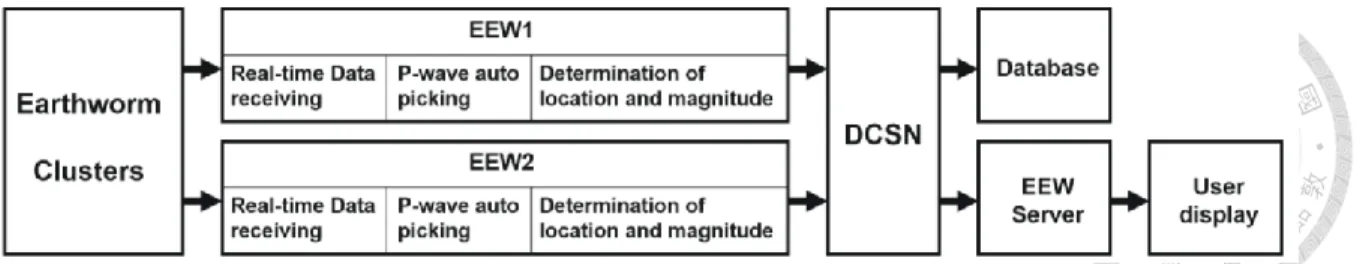
Earthquake magnitude is estimated by obtaining an average for each MPd value from each seismic station, following section 2.4.2 in this dissertation. Figure 3-3 provides the hardware configuration of the eBEAR system. For system backup, we designed two parallel EEW units, EEW1 and EEW2 that run the same procedure and data for generating earthquake messages. When an earthquake occurs, both EEW1 and EEW2 send earthquake messages to the system running the DCSN module. Only the first system sending the earthquake message is activated within the DCSN module. After receiving an earthquake message, the DCSN module writes an XML-formatted file onto the EEW server used to broadcast EEW reports to end users; then, to warn the end user, a display program pops up on the computer screen.
40
Figure 3-3. A flowchart of the algorithms designed for the PICK_EEW module. The rectangle represents different computers.
3.3 Offline Test
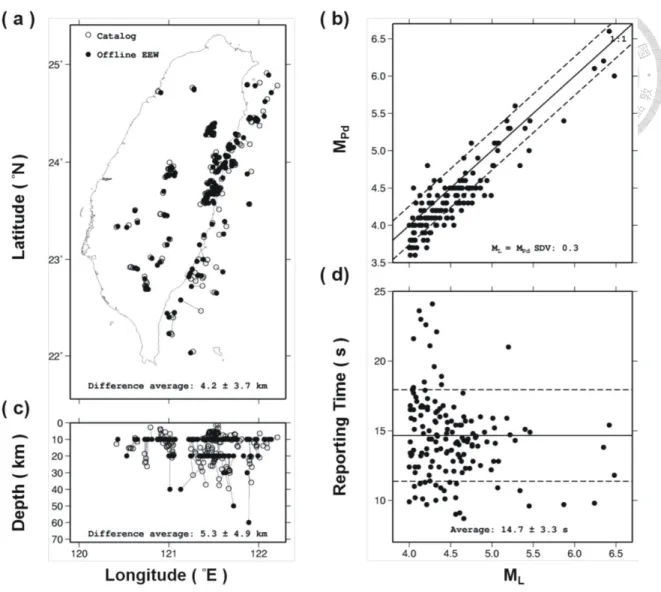
To calibrate the eBEAR system, an offline test was implemented in this study. From 2012 to 2013, we collected recorded seismic waveforms with magnitudes greater than 4.0, depths less than 40 km, and epicenters within 40 km of the coastline of Taiwan based on the upgraded CWBSN. A total of 154 seismic events, including four events with magnitudes between 6.0 and 6.5, were used in the test. The results, including earthquake locations and magnitudes, were compared to the CWB earthquake catalog. The reporting time of the offline test (defined as the time the EEW report is issued following the event origin time) does not include a telemetry delay of within 2 s. Figure 3-4 provides the offline performance of the eBEAR system in comparison with the results from the CWB catalog. The average errors for epicenter and focal depth locations are 4.2 and 5.3 km, respectively. The standard deviation of the local magnitude is 0.3 units. The average reporting time is 14.7 s. Some events located in southwestern Taiwan with relatively higher station density and coverage may be reported within 10 s. The offline results are acceptable for EEW purposes and suggest three points. First, the two-step method for determination of the epicenter and focal depth is suitable for a complicated tectonic environment such as Taiwan. Second, using a Pd value within a 3 s time window
41
following P-wave arrival is useful for measuring the size of moderate-sized earthquakes with magnitudes ranging from 4.0 to 6.5. Third, when an earthquake occurs in an area with a relatively higher station density and coverage, the number of updating earthquake messages quickly increases within the eBEAR system. For this type of event, the system is able to obtain a third earthquake message (an EEW report) within a short period of time.
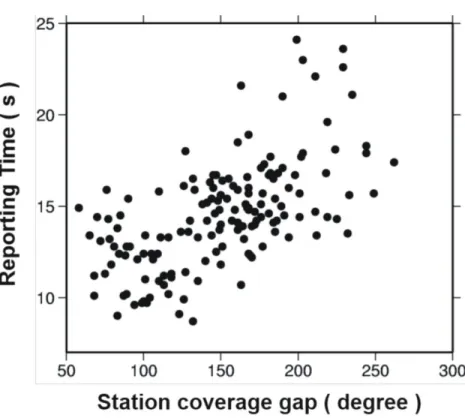
For further discussion of the reporting time, Figure 3-5 provides the relationship between the reporting time and the station coverage gap. For most inland events with a station coverage gap generally less than 150°, reporting can occur within 15 s. On the other hand, for offshore events the reporting times may take more than 20 s when the station coverage gap is greater than 200°. The results indicate that currently the station coverage gap is a key factor for controlling the reporting time of the eBEAR system.
42
Figure 3-4. A comparison between the offline test and the CWB published catalog, as follows: (a) the epicenters, (b) the magnitudes, (c) the focal depths, and (d) the reporting time of the offline test. Open circles represent earthquake locations obtained from the published CWB catalog.
Solid circles represent earthquake locations from the eBEAR system.
43
Figure 3-5. The relationship between reporting time and station coverage gap.
3.4 Online Performance
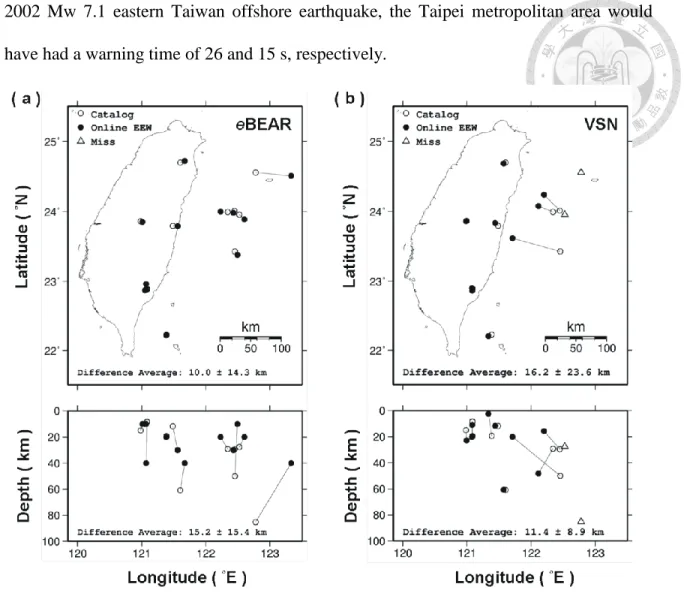
For an online system comparison between the VSN and eBEAR systems, we collected online operating performance data from January to March of 2014. Figure 3-6 indicates that the eBEAR system had no missed events and that determinations of location were better than for the VSN system. For inland earthquakes, both systems had location errors less than 10 km. On the other hand, for offshore earthquakes, the VSN system missed two events and displayed larger location errors of approximately 50–100 km. On average, the epicenter errors of the eBEAR and VSN systems are 10.0 and 16.2 km, respectively. When considering depth determinations, the VSN displayed better results than the eBEAR system because the VSN system used both P- and S-wave arrivals, whereas the eBEAR system only used P-wave arrivals. For magnitude determinations, the
44
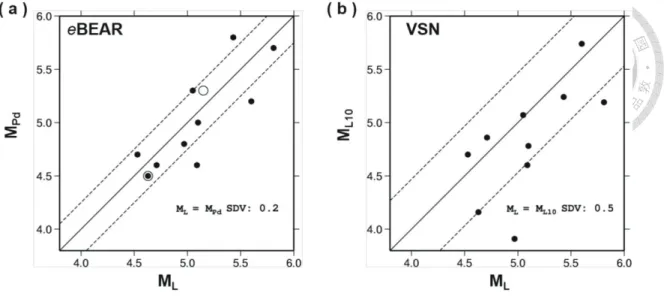
eBEAR system yielded a smaller standard deviation (0.2) compared to the VSN system,
with a standard deviation of 0.5, shown in Figure 3-7. The solid circles represent the events detected by both systems; the open circles represent the events only detected by the eBEAR system. If we only compare the solid circles, it also shows the eBEAR system has
better magnitude estimations than the VSN system. In the comparison of reporting times, Figure 3-8 indicates that almost every earthquake processed by the eBEAR system displayed an earlier reporting time. On average, the eBEAR system shortens reporting times by 3.2 and 5.5 s, compared to the VSN system for inland and offshore earthquakes, respectively. Because the eBEAR system contains 149 seismic stations distributed in a smaller station coverage gap and because station locations are denser than the VSN system based on 110 stations, the eBEAR system can obtain an EEW report more efficiently than the VSN system. Moreover, for an earthquake that occurred in the southern Taiwan offshore area, the station distributions of the eBEAR system and the VSN system are similar, but the difference of the reporting time is about 9 s. This indicates the eBEAR system can be operated more efficiently than the VSN system without considering the influence of the station distribution. Figure 3-9 provides warning times to target areas in metropolitan Taipei. Warning time is defined as the time between the reporting time and the arrival of the S wave. The eBEAR system provides a longer warning time than the VSN system. For the eastern offshore area of Taiwan, the eBEAR system can provide a warning time that is 5 s longer, on average, than the VSN system.
The major reason is that by adding the MACHO system and the YOJ station into the seismic network, the eBEAR system has a smaller station coverage gap. In addition, for events with the approximate locations of the 1999 Mw 7.6 Chi-Chi earthquake and the
45
2002 Mw 7.1 eastern Taiwan offshore earthquake, the Taipei metropolitan area would have had a warning time of 26 and 15 s, respectively.
Figure 3-6. Location estimations as compared to online performance between the eBEAR and VSN systems, as follows: (a) the epicenter distribution of the CWB catalog and events of the EEW alarms & missed alarms from the eBEAR system, and (b) the epicenter distribution of the CWB catalog and events of the EEW alarms & missed alarms from the VSN system. Open circles represent earthquake locations from the published CWB catalog. Solid circles represent earthquake locations from the EEW system. Open triangles represent missing reports from the EEW system.
46
Figure 3-7. Magnitude estimations as compared to online performance between the eBEAR and VSN systems, as follows: (a) results from the eBEAR system and (b) results from the VSN system. The solid circle represents the events detected by the eBEAR and VSN systems. The open circle represents the events only detected by the eBEAR system. The solid line represents the 1:1 line. Dashed lines represent one standard deviation.
Figure 3-8. The reporting time comparison for online performance between the eBEAR and VSN systems, as follows: (a) results from the eBEAR system using 149 stations within the CWBSN, and (b) results from the VSN system using 109 RTD stations.
47
Figure 3-9. Warning time comparisons for online performance between the eBEAR and VSN systems, as follows: (a) results from the eBEAR system using 149 stations, and (b) results from the VSN system using 109 RTD stations. The solid square represents the target area for obtaining warnings. Open circles represent epicenters. The number over the open circle is the warning time, defined as the time between the reporting time and the arrival of the S-wave. If the warning time value is negative, the target area has no warning time.
3.5 EEW Disseminations
The eBEAR system has issued EEW warnings to about 3600 junior and senior high schools in Taiwan since January 2014. Those schools receive warnings from the CWB and transfer messages to their broadcast system using a user display software, shown in Figure 3-10. From January 2014 to September 2014, there are 28 earthquakes with magnitude greater than 4.5 and depth less than 40 km reported by the CWB. The eBEAR system has reported 20 events and missed 8 events. Figure 3-11 shows the epicenters distribution of the reported and missed events, as well as the reporting times of the
48
eBEAR system. All of the missed events are located on the offshore area. For the reported
events, the average location error is 4.7±2:9 km and the average magnitude error is 0.2±
0:1. The 21 May 2014 Hualien earthquake with local magnitude 6.0 is the largest event during this period. The eBEAR system issued the alert 15.4 s after the earthquake occurrence. It can provide about 25 s leading time for the Taipei area.
Since January 2014, there have been two false alerts issued by the system. Neither false alert was caused by false triggers. Instead, improper operation caused the false alerts to be generated and sent to the schools. The first false alarm was caused by performing an offline test; because the offline and the online systems run on the same computer, the result of the offline test was sent to the online reporting system and caused a false alert.
To avoid this kind of false alarm, we separated the offline and online systems. The second false alarm was caused by the Earthworm communication modules that provide a rapid message exchange facility between two Earthworm processing systems. When the earthquake occurred, the EEW1 determined the source parameters and sent them to the DCSN using the communication modules. However, the EEW message could not be sent (and instead was stored in the memory) because the connection between the communication modules was broken. When the system operator found the connection problem and restarted them several hours later, they were reconnected again. As a result, the source parameters were received by the DCSN. The alert was then sent to the schools, but it was delayed for several hours after the earthquake occurred. To solve the connection problem, we started to monitor heartbeat debug messages, which is a hand-shaking procedure between the communication modules. The system operator can figure out the connection problems and fix them before the system is triggered by
49
earthquakes.
Figure 3-10. Graphical output of the eBEAR system during a simulation of the ML 6.5 earthquake in central Taiwan. (top-left) The origin event time and the name of the target city. (center) The rectangle represents the target area. The black line represents the wave front of the P wave. The white line represents the wave front of the S wave. (center-right) The countdown timer for S-wave arrival. (top-right) The predicted intensity of the target area.
50
Figure 3-11. EEW disseminations of the eBEAR system. There are 28 events with magnitude greater than 4.5 and depth less than 40 km from January 2014 to September 2014. The eBEAR system reported 20 events of them indicated as open circles. The size of circles corresponds to the reporting time. Eight events did not reported by the eBEAR system (open triangles). During this period the largest event occurred in the Hualien area with local magnitude 6.0 and reported at 15.4 seconds after the earthquake occurrence.
51
Chapter 4
Low-cost Seismometer for EEW
4.1 Palert Seismic Network
The PSN, which consists of 543 low-cost accelerometers, transmits three-component real-time data streams, i.e., the x, y, and z axis data streams, back to the data processing center for regional EEW. The Palert device, shown in Figure 4-1, can sample earthquake shaking at a frequency of 100Hz. Sampled data are digitized with 16-bit resolution between -2g and +2g dynamic range, and time stamped by the Network Time Protocol (NTP) server through the Internet. Figure 4-2 shows the station distribution of the PSN.
Most of the devices are installed on the wall or pillar at elementary schools. Real-time data are packed by each one-second duration and transmitted via Internet. Each Palert accelerometer can transmit data to two servers located at the NTU and the Academia Sinica Grid Computing (ASGC) Centre.
Figure 4-1. Low-cost seismometer. (a)The Palert device. (b) The i-touch device.