國立臺灣大學工學院材料科學與工程學系暨研究所 博士論文
Department of Materials Science and Engineering College of Engineering
National Taiwan University Doctoral dissertation
以脈衝電流燒結氧化鋁/奈米碳材複合材料 及其性質分析
Preparation of alumina/nano-carbon composites by pulsed electric current sintering and their performance
林鐘榮 Chung-Jung Lin
指導教授:段維新 博士
論文口試委員審定書
致 謝
志當存高遠!一個想要自我改變及突破的理想,我在 36 歲的年齡毅然決定 在職進修博士班!繁瑣的公務,常影響實驗研究及期刊投稿的進度,雖然在 學校研究的時間有限,只能善用平日下班後的夜間以及假日時間到實驗室磨 試片、做實驗,何其有幸能順利取得博士學位,最最感謝的就是指導老師段 維新教授,老師的指導及鼓勵,及適時指引實驗方向,使我在研究工作上獲 益良多。另外,我得以兼顧博士班學業與工作,還要感謝好夥伴逸樵一同討 論實驗方向及提供實驗樣品,CMC 實驗室學長姊及學弟妹們的協助,包括:
榮志大學長的引領;沛衣學姐的鼓勵與「贊聲」;紹寬、俊廷及宗德協助熱傳
儀器操作及 FESEM 預約時段等,均給予我相當大的幫助,因此才能有現在小 小的研究成果。另外也要感謝中研院物理所陳洋元教授及博後天蔚學長協助 PECS 試片燒結製作,衷心感謝在學習路上幫助過我的老師及研究夥伴們 , 讓我得以實現夢想,謹向大家致上最高的謝意!
最後還要深深感謝父母親的支持、摯愛的淑芬及三個貼心的孩子(昀潔、
昀蓁及昀翰)無悔的陪伴及鞭策,是我最堅強的後盾,讓我有更多的信心及 勇氣繼續大步前進,謝謝你們!
摘 要
近期氧化鋁奈米複合材料發展新增對電子元件中散熱基板的需求,本研究嘗
試添加少量 0.57~8.5 vol%的奈米碳(nano-carbons 包括:奈米碳管、石墨烯或奈米鑽 石)與氧化鋁粉末混合製漿,再壓成生胚片後以脈衝電流燒結技術(PECS)使奈米複 合材料緻密化,期望透過添加高導熱的奈米碳材料,大幅改善氧化鋁的導熱性和 韌性。
由於石墨烯及奈米碳管緻密化過程中在晶界累積形成阻礙以及奈米鑽石在緻密 化過程中發生釘扎效應(pinning effect),在添加少量石墨烯及奈米鑽石的確略微提 高氧化鋁之導熱率,但隨著奈米碳添加量的增加,卻反使導熱率快速下降。在校 正孔隙率和晶粒尺寸的影響之後,顯示添加少量的奈米碳對於導熱率的增加有所 助益,但是超過臨界值後,添加奈米碳後將使導熱率急速下降。
本論文討論三種不同奈米碳(nano-carbons)對於氧化鋁複合材料之熱物理性能的 影響,並且若要發揮的優異熱傳導性,必須同時考慮到結構特徵與熱傳方向。其 中,二維石墨烯的最佳傳熱方向是平面的,但卻恰好垂直於熱傳的目標方向;一 維奈米碳管的最佳傳熱方向是沿軸向,但由於奈米碳管的纏繞效應,傳熱的結果 顯示是隨機的,熱傳效益也可能相互抵消,未能發揮 CNT 的優良傳熱性能。零維 的納米金剛石是目前最好的添加劑,因為它沒有特定的傳熱方向,並且該結構不 會在晶界處產生阻礙,這會影響緻密化。這項工作的結果表明奈米鑽石和 PECS 技術的巨大潛力適合陶瓷複合材料的各種工程應用。
關鍵字: 石墨烯;奈米碳管;奈米鑽石;氧化鋁奈米複合材料;熱傳導
Abstract
The latest developments in power electronics have increased the demand for heat-dissipating substrates. The present study prepared the alumina slurry with the addition of a small amount (0.57 to 8.5 vol%) of nano-carbon (carbon nanotubes, graphene or nanodiamonds). The slurry was compressed into a green compact. The nanocomposite was prepared using the pulsed electric current sintering (PECS) method.
The nano-carbons (graphene/nanodiamond/CNT, less than 1 vol%) play the role of heat transfer in the nanocomposites. In terms of the structural characteristics, and the heat transfer, the best heat transfer direction for 2D-graphene is its planar direction. It happens to be perpendicular to the heat transfer direction of the target.
The best heat transfer direction of 1D-CNT is along the axis direction. Because of the entanglement of CNT, the direction of heat transfer is random, and the efficiency of heat transfer might offset each other. Therefore, the CNT failed to play an excellent role in heat transfer.
Zero-dimensional nanodiamond is currently the best additive because it has no specific heat transfer direction, and its specific surface area is smaller compared to that of graphene and CNT. Moreover, its presence does not affect the densification.
The present study shows that a small amount of nanodiamond (less than 1 vol%) leads to a better heat transfer than pure alumina.
Contents
論文口試委員審定書 ... I 致 謝 ... II 摘 要 ... III Abstract ... IV Contents ... V List of Tables ... XII
Chapter 1 Introduction ... 1
Chapter 2 Literature survey ... 3
2-1 Development and application of carbon nanotubes, graphene, and nanodiamond ... 3
2-1-1 Nano-carbon: graphite, carbon nanotubes, graphene, and nanodiamonds ... 3
2-1-2 Development of carbon nanotubes ... 3
2-1-3 Graphene - the first 2D material ... 4
2-1-4 Development of nanodiamond ... 4
2-1-5 Chemical properties and physical properties of nano-carbons ... 5
2-2 Nanocomposite ... 6
2-2-1 Brief introduction of nanocomposites ... 6
2-2-2 Characteristics and advantages of alumina nanocomposite... 8
2-3 Pulsed Electric Current Sintering ... 9
2-3-1 Principle of PECS ... 9
2-3-2 Applications and advantages of PECS ... 10
2-4 Introduction to material properties test methods ...11
2-4-1 Density ...11
2-4-2 Scanning Electron Microscope (SEM) ... 13
2-4-3 Raman spectroscopy ... 13
Chapter3 Experimental procedures ... 17
3-1 Experimental design ... 19
3-1-1 Starting materials ... 19
3-1-2 Preparation of alumina/CNT、graphene nanocomposites ... 23
3-1-3 Preparation of alumina/nanodiamond nanocomposites ... 28
3-1-4 Sintered specimen machining ... 28
3-2 Physical property testing ... 30
3-2-1 X-ray diffraction analysis ... 30
3-2-2 Density measurement... 31
3-2-3 Microstructure observation ... 33
3-2-4 Thermal conductivity measurement ... 34
3-2-5 Conductivity test ... 37
Chapter 4 Results ... 39
4-1 Alumina-CNT/graphene nanocomposite ... 39
4-1-1 Microstructure Analysis and EDS of green tapes ... 39
4-1-2 Sintering temperature planning... 43
4-1-3 Density of nanocomposite ... 44
4-1-4 Phase identification ... 46
4-2 Alumina-nanodiamond nanocomposite ... 50
5.1 Characteristic of adding carbon nanotubes to alumina nanocomposites ... 54
5.1.1 Effect of microstructure of alumina-CNT nanocomposites ... 54
5-1-2 Effect of thermal conductivity of alumina-CNT nanocomposites ... 63
5.2 Characteristic of adding graphene to alumina nanocomposites ... 67
5.2.1 Effect of microstructure of alumina-graphene nanocomposites ... 67
5.2.2 Effect of thermal conductivity of alumina-graphene nanocomposites .... 77
5.3 Characteristic of adding nanodiamond to alumina nanocomposites ... 82
5.3.1 Effect of microstructure of alumina-nanodiamond nanocomposites ... 82
5.3.2 Effect of thermal conductivity of alumina-nanodiamond nanocomposites... 85
5.4 Comprehensive comparison and discussion ... 87
5.4.1 Comparison of thermal conductivity of alumina-CNT composites with different production methods ... 87
5.4.2 Comparison of thermal diffusivity of alumina-graphene/CNT composites ... 89
5.4.3 Comparison of the specific heat capacity of alumina-graphene/CNT composites ... 92
5.4.4 Comparison of thermal conductivity of alumina-graphene/CNT composites ... 94
5.4.5 Calculation of mean free path of alumina-graphene/CNT composites.... 99
5.4.6 Comparison of porosity effect on thermal conductivity ... 101
5.4.7 Comparison of nano-carbon adding effect on thermal conductivity ... 106
Chapter 6 Conclusions ... 111
Chapter 7 Future works ... 112
References ... 113
List of Figures
Fig.2-1 The classification of ceramic nanocomposites
Fig.2-2 Schematic drawing of open pores and closed pore of ceramics Fig.2-3 Raman spectra from different types of sp2 nanocarbons
Fig.2-4 Raman spectra from different layers of graphene
Fig.3-1 Morphology of graphene sheets used in the present study Fig.3-2 Morphology of MWCNT used in the present study
Fig.3-3 Schematic drawing of large-area few-layers graphene producing Fig.3-4 Flow chart of green compact producing processes
Fig.3-5 (a) PECS equipment (b) PECS equipment in heating Fig.3-6 PECS firing process
Fig.3-7 Morphology of graphene/CNT/nanodiamond - alumina nanocomposite sintered specimen
Fig.3-8 Cross-section morphology of pure alumina sintered specimen Fig.3-9 XRD - JCPDS chart of alumina
Fig.3-10 Electronic balance for measure the weight of the sample in the water Fig.3-11 Field-emission scanning electron microscope equipment
Fig.3-12 Nano-Flash thermal conductivity analyzer Fig.3-13 Sample holder of thermal conductivity analyzer Fig.3-14 Flow chart of the experimental procedure
Fig.4-1 Cross-section morphology of Alumina+8.5 vol% CNT green compact
Fig.4-2 Isolated CNT in the cross-section morphology of Alumina+8.5 vol% CNT
Fig.4-6 XRD patterns of alumina, alumina-CNT nanocomposites
Fig.4-7 Raman spectra of alumina-1.8 vol% graphene green compact and sintered bulk, respectively
Fig.4-8 Raman spectra of alumina-graphene nanocomposites
Fig.4-9 XRD patterns of the alumina-nanodiamond composites sintered at 1400 ℃ Fig.5-1 EDS mapping of alumina + 1.8 vol% CNT
Fig.5-2 Fracture surface of pure alumina sintered specimen at 1500℃
Fig.5-3 Fracture surface of alumina-0.88 vol% CNT nanocomposite sintered at 1500℃
Fig.5-4 Fracture surface of alumina-1.8 vol% CNT nanocomposite sintered at 1500℃
Fig.5-5 Fracture surface of alumina-3.5 vol% CNT nanocomposite sintered at 1500℃
Fig.5-6 Fracture surface of alumina-8.5 vol% CNT nanocomposite sintered at 1500℃
Fig.5-7 Experimental data for (a) thermal diffusivity and (b) specific heat capacity of alumina-CNT composites as a function of measurement temperature.
Fig.5-8 Calculated thermal conductivity of alumina-CNT composites as a function of temperature
Fig.5-9 Thermal conductivity of CNT-alumina composite as a function of 1/T Fig.5-10 EDS mapping of alumina + 8.5 vol% graphene
Fig.5-11 Fracture surface of alumina specimen sintered at 1500℃
Fig.5-12 Fracture surface of alumina-o.88 vol% graphene nanocomposite sintered at 1500℃
Fig.5-13 Fracture surface of alumina-1.8 vol% graphene nanocomposite sintered at 1500℃
Fig.5-14 Fracture surface of alumina-3.5 vol% graphene nanocomposite sintered at 1500℃
Fig.5-15 Fracture surface of alumina-8.5 vol% graphene nanocomposite sintered at 1500℃
Fig.5-16 Bridging of the fracture surface for alumina-1.8 vol% graphene composite sintered at 1500℃
Fig.5-17 Carbon-rich zone of alumina-8.5 vol% graphene composite sintered at 1500℃
Fig.5-18 Experimental data for (a) thermal diffusivity and (b) specific heat capacity of alumina-graphene composites as a function of measurement temperature.
Fig.5-19 Calculated thermal conductivity of alumina-graphene composites as a function of temperature
Fig.5-20 Thermal conductivity for alumina/graphene nanocomposite as a function of 1/T
Fig.5-21 Fracture surfaces of alumina specimens sintered at 1400 ℃
Fig.5-22 Fracture surfaces of the alumina-nanodiamond composites sintered at 1400°C, the nanodiamond content in the composites is (a) 0.57 vol% and (b) 1.1 vol%
(c) 2.3 vol% (d) 5.6 %.
Fig.5-23 Experimental data for (a) thermal diffusivity and (b) specific heat capacity of alumina-nanodiamond composites as a function of temperature.
Fig.5-24 Calculated thermal conductivity of alumina-nanodiamond composites as a function of temperature.
Fig.5-25 Experimental data for thermal diffusivity of alumina-0.88 vol%
CNT/graphene composites as a function of measurement temperature.
Fig.5-26 Experimental data for thermal diffusivity of alumina-1.8 vol% CNT/graphene composites as a function of measurement temperature.
Fig.5-27 Experimental data for thermal diffusivity of alumina-3.5 vol% CNT/graphene
Fig.5-30 Experimental data for the specific heat capacity of alumina-1.8 vol%
CNT/graphene composites as a function of measurement temperature
Fig.5-31 Experimental data for the specific heat capacity of alumina-3.5 vol%
CNT/graphene composites as a function of measurement temperature
Fig.5-32 Experimental data for the specific heat capacity of alumina-8.5 vol%
CNT/graphene composites as a function of measurement temperature
Fig.5-33 Calculated thermal conductivity of alumina-0.88 vol% CNT/graphene composites as a function of temperature
Fig.5-34 Calculated thermal conductivity of alumina-1.8 vol% CNT/graphene composites as a function of temperature
Fig.5-35 Calculated thermal conductivity of alumina-3.5 vol% CNT/graphene composites as a function of temperature
Fig.5-36 Calculated thermal conductivity of alumina-8.5 vol% CNT/graphene composites as a function of temperature
Fig.5-37 Previous reported values for the thermal conductivity of alumina-CNT composites
Fig.5-38 Experimental data and calculated values for the thermal conductivity of alumina-graphene composite as a function of volume content. The value corrected by removing the effect of porosity (Eq. 4) and grain size (Eq. 7) is also shown. The straight line indicates the lower bound (Eq. 9) for a layered structure.
Fig.5-39 Calculated thermal conductivity of alumina- graphene/CNT/nanodiamond composites as a function of volume content.
Fig.5-40 Calculated thermal conductivity of alumina- graphene/CNT/nanodiamond composites as a function of relative density.
Fig.5-41 Schematic representation of fast channel for alumina-nanodiamond composites.
List of Tables
Table.3-1 Composition of the specimens
Table.3-2 Physical properties of commercial alumina powder
Table.4-1 The bulk density and the relative density of the sintered specimens
Table.4-2 Microstructural characteristics and thermal conductivity for the alumina-nanodiamond composites prepared in the present study.
Table.5-1 Previously reported values for the thermal conductivity of alumina-CNT composites
Chapter 1 Introduction
Recently, the importance of the thermal properties of materials has been increased through the way of practical needs and fundamental science. Due to the increase in the level of power dissipation, heat dissipation has become a key issue for persist progress in the electronics industry [1].
The development of nano-carbon such as nanodiamond, carbon nanotube, and graphene has undoubtedly accelerated the nanotechnology in recent years. From the structural illustration of some 0-, 1-, and 2- dimensional carbon nanomaterials occurring in different crystallographic forms, it was inferred that nano-carbon is comprised of a set of materials, mostly with different structure, morphology, and thermophysical properties. The above-mentioned materials all contain one of the critical elements, carbon, which is the primary building block of their structures [2].
The nano-carbon exhibits a wide range of unique properties, including large aspect ratio, exceptional high Young’s modulus as well as high strength [3]. Apart from the impressive mechanical performance, the thermal conductivity of nano-carbon also demonstrates higher-than-expected values [1]. Hence, the nano-carbon is strongly related to their exceptional properties facilitated by their nanoscale structure.
Moreover, nano-carbon has been used in many areas recently.
The discovery of carbon nanotubes (CNTs, termed one-dimensional carbon), graphene (termed two-dimensional carbon), and nanodiamond (termed zero-dimensional carbon) have enabled many opportunities [4]. For example, the nano-carbon exhibits incredibly high mechanical strength. The addition of CNTs and graphene into ceramics indeed enhances their toughness considerably [3]. Previous
studies have demonstrated that the addition of 1 vol% CNTs increases the toughness of alumina by 24 % [5]; the addition of 0.8 vol% graphene increases the toughness by 40 % [6].
In addition to the impressive mechanical performance, the thermal conductivity of CNT, graphene, and nanodiamond is higher than expected. For example, the thermal conductivity of CNT can reach ~3,500 W/mK [2]; the thermal conductivity of graphene can reach ~5,300 W/mK [2]; the thermal conductivity of diamond can reach ~2,200 W/mK [2]. This study attempts to add nano-carbons such as graphene, CNT, and nanodiamonds in the alumina composite. These excellent thermal conductivity properties are combined with alumina to form nanocomposites to maintain good alumina insulation. However, the previous reports [7-9] suggest that the addition of nano-carbons and the microstructure might play an essential role in the thermal conductivity.
This research tries to investigate the different nano-carbons on how to influence the thermophysical properties of Al2O3 - graphene/CNT/nanodiamond composites.
The relationship for microstructure- thermal conductivity is then established.
Chapter 2 Literature survey
2-1 Development and application of carbon nanotubes, graphene, and nanodiamond
2-1-1 Nano-carbon: graphite, carbon nanotubes, graphene, and nanodiamonds
Graphite, carbon nanotubes, graphene, and nanodiamonds are the allotropes of nano-carbons where graphite is a layered planar structure, and the carbon atoms in each layer are arranged in a honeycomb crystal structure. The periphery of each carbon atom is covalently bonded to three other carbon atoms, and the arrangement is a honeycomb-shaped plurality of hexagons with a weak van der Waals force between each layer. Since each carbon atom emits an electron, and those electrons can move freely.
The graphite has excellent electrical conductivity and is often used as an electrode in the industry.
2-1-2 Development of carbon nanotubes
Dr. Iijima discovered the carbon nanotube in 1991. He observed the carbon fiber from an arc-discharge evaporation method by SEM [10]. It is a kind of helical microtubules of graphitic carbon. Each carbon atom on the tube is sp2 hybridized. According to the number of layers of the tube, it is classified as single-walled CNT and multi-walled CNT. The radius of the tube is as thin as the nanometer scale, and tens of thousands of carbon nanotubes are only one hair width. It is why the so-called carbon
nanotubes.
2-1-3 Graphene - the first 2D material
Graphene is a monoatomic layer of graphite [11-14]. Each carbon atom is sp2 hybridized with adjacent three atoms to form a bond and extends into a two-dimensional structure honeycomb. Single-layer and perfect graphene have a high light transmission rate (absorb only 2.3%
visible light) [12], high thermal conductivity (~5,300 W/mK) [2], high Young’s modulus (1 TPa) [12], and extremely high electron mobility (2.5x105 cm2/Vs) [12] which is lower than silver or copper. As a conductor of heat, it surpasses all other known materials. Graphene is the thinnest and strongest material known to exist.
In 2004, the team led by Professor Geim of the University of Manchester in the United Kingdom used the “Scotch-tape” method to successfully separate graphene from graphite and transfer it to the ruthenium oxide substrate. Due to Professor Geim’s achievement of the pioneering experiment in two-dimensional graphene materials, he won the 2010 Nobel Prize in Physics.
2-1-4 Development of nanodiamond
Nanodiamond also has superior mechanical and thermal properties [15-17]. It combined with the sumptuous surface chemistry of nanoscale diamond particles, which make it an excellent filler material for
producing a layer on the surface of alumina. It is also the property of hardness that people are used to ignoring the high thermal conductivity of diamond. The moderate addition of nanodiamond on to the alumina matrix is expected to increase the overall thermal conductivity sharply. Diamonds and alumina do not react to compounds during sintering. Unfortunately, an excess fraction (over 5 vol%) of nanodiamond acts as a remarkably effective boundary pinning role in alumina throughout a wide sintering temperature range from 1200 up to 1700℃ [19].
2-1-5 Chemical properties and physical properties of nano-carbons
Due to the physical properties of carbon nanotubes, graphene, and nanodiamonds are applied in the industry, including supercapacitors, light transmitting touch panels, and so on [20-22]. However, it is still a research and developing the product at the laboratory test, and the products are yet to be mass-produced and widely used.
2-2 Nanocomposite
2-2-1 Brief introduction of nanocomposites
The composite material is an industrial material where it’s performance can be designed by human-made design. By selecting the composition of each component phase as well as mixing ratio and interface bonding type, the performance of the composite material can be adjusted in a wide range, and can also be specified. The material is given a predetermined property in the direction, and its performance may exceed the contribution of its composition to the material properties. It’s not processed entirely by the volume fraction. The composite material can even produce new features that the original structure does not have. When using the design ability of the composite material, it could combine many physical properties into ideal synergies including strength, rigidity, toughness, density, thermal insulation, insulation, wear resistance, thermal shock resistance, thermal fatigue resistance and so on.
Nanocomposites significantly increase the strength and can effectively improve the toughness to increase the reliability of ceramic materials [23]. Nanocomposites mainly strengthen the substrate phase by enhancing the microstructure. In the traditional ceramic process, the nanoparticle phase is uniformly dispersed in the base material, and the
pattern is different, and it is divided into four different types of nanocomposite ceramics showed in Fig. 2-1.
(1) Intra-type: The second phase is dispersed in the crystal grains of the substrate. When the nanocomposite material of this form is broken, the substrate mostly exhibits a transgranular fracture mode. In the meantime, high strength properties are obtained.
(2) Inter-type: The second phase is dispersed in the grain boundary of the substrate. When the nanocomposite material of this form is broken, the substrate mostly exhibits an intergranular fracture mode. Due to the increase of the crack transmission path, the damage energy can be reduced, and the toughness can be effectively improved.
(3) Intra/inter- type: The second reinforcement is distributed in the grains and the grain boundaries of the substrate at the same time. Therefore, the mechanical properties of the composite material are between the above two forms.
(4) Nano/nano-type: The second phase is similar to the particle size of the substrate phase and belongs to the grain size of the nanometer. The primary purpose of this composite is to add new functions such as machinability and superplasticity, like metals to ceramics [23].
Fig.2-1 the Classification of ceramic nanocomposites [23]
2-2-2 Characteristics and advantages of alumina nanocomposite
Alumina is the most widely used and easy-to-use ceramic material.
But its inherent brittleness makes its mechanical properties poor which limits its development and application functions. In view of the development of nanotechnology, if the second phase nanoparticle can be
In addition to strengthening toughness, alumina is often used in the electronics industry as a component substrate. Therefore, in addition to improving toughness, alumina composites are also the focus of the next stage of improvement and emphasis.
2-3 Pulsed Electric Current Sintering
2-3-1 Principle of PECS
The PECS principle is that a local high-temperature state is instantaneously generated due to a spark discharge occurring in a gap or at a contact point between particles [24-27]. It results in evaporation or melting on the surface of the particles and neck formation, which significantly increases the rate of diffusion and leads to higher densification. In addition to the high local temperature, the externally applied pressure contributes to the rearrangement of the particles and the destruction of the agglomerates. Moreover, it increases the driving force for sintering.
2-3-2 Applications and advantages of PECS
The most significant advantage of using PECS sintered ceramic specimen is that the sintering time could be significantly shortened and the densification would be achieved much easier. The time for high-temperature sintering could be reduced from several hours to several minutes by the fast heating rate (600℃/min). An additional benefit is that it could avoid damage to the specimen caused by a high-temperature environment where the sample is exposed for an extended period.
2-4 Introduction to material properties test methods
2-4-1 Density
As porosity increases, hardness and strength decrease. While the relationship between hardness and strength could be inferred according to the density value. Thus, the density is the most commonly measured property of ceramic properties. Besides, it can be used as a sintered compact; the hardness and strength of the material could be derived from the porosity (see Fig.2-2). The experiment is simple, as well as convenient, and it does not require highly complicated equipment. Density could usually be divided into four types:
(1) Theoretical Density( or True Density):
(2) Bulk Density (3) Apparent Density
(4) Relative Theoretical Density
Measurement method
(1) The specimen was first placed in a 150℃ oven to remove all the moisture in the pores and then to be dried. After that, the weight was recorded as W1.
(2) After boiling deionized water, the specimen was allowed to sink below the surface of deionized water, but not to contact the beaker wall. The sample was heated for half an hour and then cooled in water for one hour.
(3) The specimen was immersed in water and took out where its surface was slightly dried, and the weight was recorded as W2.
(4) The specimen suspended in water and the weight was recorded as W3. (5) According to the experimental principle, it could be calculated:
- Specimen volume V= W2 - W3 - Open pore volume = W2-W1
- Solid volume = W1-W3
- Apparent porosity P = (W2-W1) / V*100 - Water absorption rate A = (W2-W1) / W1*100 - Apparent density T= W1/( W1-W3)
- Bulk density = W1 / V
Fig.2-2 Schematic drawing of open pores and closed pore of ceramic
Open pore
Closed pore
2-4-2 Scanning Electron Microscope (SEM)
By using a focused electron beam, Scanning Electron Microscopy (SEM) scans the surface of the sample point by point. The electron beam interacts with the specimen to generate various physical signals (including backscattered electrons, secondary electrons, etc.). These signals are received, amplified by the detector and are converted to electronic signals.
Finally, it displayed an image of various features on the surface of the sample on the screen. The SEM has a significant depth of field, sharp stereoscopic image, broad magnification range, continuous adjustment of magnification, high resolution, ample sample chamber space, and most importantly, its sample preparation is quite simple. Unlike TEM observation samples, they require complicated processing procedures.
Therefore, the SEM is the most effective analytical tool for surface research of samples.
The electron beam source can be divided into a field emission electron source (field emission), and a thermal electron emission source (using W, LaB6 as a filament to emit an electron beam after heating). While the electron beams current density of the field emission electron source is higher, and it also provides better image quality.
2-4-3 Raman spectroscopy
Raman spectroscopy is a spectroscopy method that uses light scattering to measure molecular vibrations [28-29]. It is used to analyze the interaction of the phonon with the light generated in the sample.
Illuminating the laser light onto the molecule or crystal leads to energy exchange between the incident photon and the dielectric molecule.
Therefore, the frequency of the scattered light has changed after reflection.
By the inelastic collision process, the incident photon in an experimental apparatus will be excited and will lose or get one phonon energy. Change of the frequency between the incident light and the scattered light could be regarded as the energy exchange between the incident photons. It is related to the structure of the medium, the scattering molecule, the bonding, the vibration energy level, and the rotational energy level. Raman spectroscopy has been widely used in the analysis of related carbon materials, such as graphite, carbon nanotubes (see Fig. 2-3) with the advantage in fast, high resolution, non-destructive performance.
At present, Raman Spectra is the most common way to identify the graphene layer number, and it is a method to use the physical phenomenon in G'-band (also known as 2D band) phonon oscillation. In the graphene sample, the above phenomenon of phonon oscillation is related to the electrical structure of graphene. So the G'-band is very sensitive to changes in the electronic band structure, and the band structure is altered by the graphene layer–layer interaction [30]. Raman spectroscopy is very sensitive to the number of graphene layers. The spectral difference between
Fig.2-3 Raman spectra from different types of sp2 nanocarbons [28]
Fig.2-4 Raman spectra from different layers of graphene [30]
Chapter3 Experimental procedures
This study focuses on the effects of the addition of graphene, carbon nanotubes, and nanodiamonds on the properties of alumina composites. The experimental scheme is shown in Fig. 3-14. There are four sets of different proportions of carbon nanotube/graphene/nanodiamond-alumina specimen used.
Besides, pure alumina specimens were sintered respectively at 1350°C, 1400°C, and 1500°C as a control group (see Table 3-1 for ingredients). The paragraph introduces the following fields: the mixing preparation of alumina powder, the green compact production, PECS, specimen grinding, and instrument analysis.
Table.3-1 Composition of the specimens
CNT graphene nanodiamond
vol% wt % vol% wt% vol% wt%
Pure alumina - - - -
Adding CNT @ alumina nanocomposite
0.88 0.5
1.8 1
3.5 2
8.5 5
Adding Graphene @ alumina nanocomposite
0.88 0.5
1.8 1
3.5 2
8.5 5
Adding nanodiamond @ alumina nanocomposite
0.57 0.5
1.1 1
2.3 2
5.6 5
3-1 Experimental design
3-1-1 Starting materials
At the present work, this study used a high purity of 99.99% α-Al2O3 powder (TM-DAR, Taimei Chemicals Co., Japan,). The average particle size of the powder was 0.2 μm, and its surface area was 14.5 m2/g. The physical properties of the alumina powder used in this study are shown in Table 3-2 for details.
Graphene and carbon nanotubes are supplied by Ritedia Co., Ltd., and the microscopic images of graphene and carbon nanotubes are shown in Fig. 3-1, 3-2. The graphene was produced with a nickel-plating method shown in Fig. 3-3 [31]. This method involved the heating of nickel substrate to a temperature below its melting point under vacuum. Graphite source was also heated to allow the carbon dissolve in nickel. During cooling, graphene was formed on the surface of the nickel substrates.
The nanodiamond (DND) is formed in closed chambers during the detonation of a mixture of explosives such as trinitrotoluene (TNT) and hexogen (RDX), where supersaturated carbon vapor from the explosives are condensed into liquid droplets. Following that, the liquid droplets are crystallized to form diamond particles as the pressure and temperature drop.
The average particle size is 20 nm.
Table.3-2 Physical properties of commercial alumina powder
Taimei Chemicals Co., Japan TM-DAR
Remarks
Crystalline form Alpha
B.E.T. Specific
surface area m2/g
14.5
Primary particle size µm
0.10
measured bySEM
Bulk density g⁄cm³
0.9
Tapped density g⁄cm³
1.0
Pressed density g⁄cm³
2.3
uniaxial pressat 98MPa
Sintered density g⁄cm³
3.96
1350˚C for1Hr. in air
Fig.3-1 Morphology of graphene sheets used in the present study
Fig.3-2 Morphology of MWCNT used in the present study
Fig.3-3 Schematic drawing of large-area few-layers graphene producing 鎳
板 鎳 板
graphite
Ni-plate
Molding
3-1-2 Preparation of alumina/CNT、graphene nanocomposites
Slurry preparation
At present, there is no related research on the addition of graphene-based nanocomposites to alumina, and no associated papers related to preparing specimen by tape casting have been published. In this study, it is the first experiment that obtained densely sintered alumina nanocomposites by using the procedures of slurry, doctor blade formation, green tape lamination as well as degreasing and drying, and finally the step of PECS sintering (showed in Fig. 3-4). Firstly, the graphene is uniformly dispersed in the water using a surfactant to avoid agglomerate, and then the alumina powder is slowly added to the slurry to be regularly stirred and dispersed, following it, a 10 wt% concentration of PVA is added to increase the overall consistency of the solution. The step of forming the blade is carried out smoothly.
Mixing and specimen molding
The prepared slurry is passed through a screen to form a green specimen on a transparent slide (about 70 μm thick after drying), and then it was divided into 12 mm discs by a die. Following that, 50 discs are stacked together, and then there was slight pressure applied to make the raw specimen tightly joined together and dried in the air thereafter.
Because the ceramic green compact contains a polymer additive such as a dispersant, it is not conducive to the sintering densification process during the sintering process. Therefore, it is necessary to lose the high molecular
substance (PVA) by using the de-esterification method. The degreasing treatment was carried out at 400℃/8 hours, and during the degreasing process, the experimental conditions were well controlled, and the ceramic green specimen was not broken.
Fig.3-4 Flow chart of green compact producing processes
Thermal processing
Dense composites were prepared by Pulsed Electric Current Sintering (PECS, Dr. Sinter 515S, Sumitomo Coal Mining Co., Japan) under a uniaxial pressure of 50 MPa. Sintering equipment is shown in Fig.
3-5. The process started by heating to 400℃ and kept at the temperature for 5 min. The densification was carried out at 1500℃ with a heating rate of 100℃/min. The dwell time at 1500℃ was 10 min (see Fig. 3-6). Several alumina specimens were also prepared by PECS at 1350℃or at 1500℃.
Fig.3-5 (a) PECS equipment; (b) PECS equipment in heating
Fig.3-6 PECS firing process 20 min
3-1-3 Preparation of alumina/nanodiamond nanocomposites
The homogeneous alumina-nanodiamond mixtures were dispersed in water with the help of a dispersant D305. The slurries were dried at 60℃.
The dried powder is directly placed in a graphite mold and is then densified.
To obtain the best densification of the specimens, the sample of this group was also firing by Pulsed Electric Current Sintering (PECS, Dr.
Sinter 515S, Sumitomo Coal Mining Co., Japan), and the entire sintering process was carried out under vacuum.
3-1-4 Sintered specimen machining
After sintering, the appearance of the specimen is as shown in Fig.
3-7. The surface layer of the sample acts at a high temperature with the graphite mold of PECS to produce a black dense, hard shell layer (see Fig.
3-8), which cannot be polished with SiC abrasive paper. The hard shell surface could be removed by a diamond-grinding disc of Chemical &
Mechanical Planarization (CMP), and the sample is cut into a size of 10 mm × 10 mm by using a Low-Speed Saw and a diamond blade. The sample is slowly ground with different types of sandpaper (including
Fig.3-7 Morphology of graphene/CNT/nanodiamond - alumina nanocomposite sintered specimen
Fig.3-8 Cross-section morphology of pure alumina sintered specimen 1 cm
3-2 Physical property testing
3-2-1 X-ray diffraction analysis
The phase in composites was identified by using X-ray diffraction (XRD, TTRAX III, Rigaku Co., Japan) equipped with Cu Kα radiation
(λ=1.5406 Å)with a step size of 0.01° 2θ and a scan rate of 6° per min.
The scanned data is converted into a pattern by the drawing software, and then the standard database of JCPDS card (Fig. 3-9 is the alumina diffraction peak data) and the previous research papers are compared to determine the crystal phase. The characteristic peaks of the characteristic crystals of alumina and the characteristic peaks of possible impurities are removed.
Fig.3-9 XRD - JCPDS chart of alumina
3-2-2 Density measurement
The density of the sintered specimen was measured by the Archimedes' method. The sample was first dried in a dry box for 24 hours.
After taking out, the dry weight of the sample in the air was weighed, and the sample was weighed in deionized water. The weight is W2 (refer to Fig.
3-10), and the apparent density of the sintered body can be calculated according to the following formula.
Apparent Density D = W1 W1-W2
The relative density is obtained by dividing the apparent density by the theoretical density.
Fig.3-10 Electronic balance for measuring the weight of the sample in the water
3-2-3 Microstructure observation
A field emission scanning electron microscope (FESEM, NOVA 450, FEI Co., USA) was used to observe the morphology of fracture surfaces.
The instrumental device is as shown in Fig. 3-11. The SEM is used with the Mapping function of Energy-dispersive X-ray spectroscopy (EDS) to analyze the elemental composition of each phase in the microstructure.
Moreover, before the specimen is observed by SEM, the surface is coated with a layer of platinum (Pt) by using an ion coater to avoid the space-charge effect caused by the non-conductivity of the ceramic sample.
The ion coater is setting with current 20 mA and working time 180 seconds to prevent blurring of the image due to the space-charge effect when observing the microscopic image.
Fig.3-11 Field-emission scanning electron microscope equipment
3-2-4 Thermal conductivity measurement
The thermal diffusivity and heat capacity of metals, graphite, coatings, composites, ceramics, polymers, and other materials were measured with a flash method (LFA 447, Netzsch Co., Germany). The specimen is cut into a size of about 10 mm × 10 mm (adjusted according to the size of the specimen holder), and the thickness of the specimen was
Before heat measurements, the top and bottom surfaces of all specimens were sprayed with a thin layer of carbon to minimize the radiative heat transport. The front surface of the sample was heated by a high-performance Xenon flash lamp. After monitored by an infrared detector, the resulting temperature of the sample surface rose. As it is shown in the temperature-time curve, the thermal diffusivity along the PECS pressing direction was determined. The experiment controls the various temperature of samples for measurement ranged from 25°C to 300°C, with an interval of 25°C as a measurement point, each measurement point is measured ten times and then averaged. This experiment (see Fig.3-12、3-13) is mainly operated with ASTM E-1461 standard, and the thermal conductivity κ and the specific heat capacity Cp
are obtained by the following formula:
𝜅 = 𝛼 × 𝜌 × 𝐶𝑝 (1)
where,κ:thermal conductivity (W/mK) α:thermal diffusivity (mm2/s) ρ:bulk density (g/cm3)
Cp:specific heat capacity ( J/gK )
Fig.3-12 Nano-Flash thermal conductivity analyzer
3-2-5 Conductivity test
Since the pure alumina sintered specimen is not electrically conductive, it would not be able to build a dense network if the addition of the best conductive CNT, graphene or nanodiamond isn’t enough (less than 5% by weight). Therefore, sintered specimens with CNT, graphene, or nano-diamonds would be still non-conductors. The resistance value can be measured by a simple volt-ohm-milliammeter (TES 3010 Digital clamp meter). The surface of the sample is first ground with 1000 grit sandpaper to remove the foreign substances on surfaces, and then two points are measured on the surface of the sample with a three-meter electric meter.
Besides the resistance value is also measured separately on the upper and lower parallel faces, the results show that these are all non-conductive.
Powder mixing
Density (Archimedes’ method) Phase identification (XRD) Microstructure observation
(FESEM) Thermal analysis Sample preparation Firing process (PECS)
Debinder Tape casting Powder Drying
+ Graphene + CNT + Nanodiamond
Chapter 4 Results
4-1 Alumina-CNT/graphene nanocomposite
4-1-1 Microstructure Analysis and EDS of green tapes
In this experiment, alumina was used as the substrate, and 0.8 vol%, 1.8 vol%, 3.5 vol%, and 8.5 vol% graphene or carbon nanotubes were added, and then sintered by PECS. The starting materials include alumina powder (TM-DAR, Daming Chemical), and the average powder particle size is about 0.2 μm; the sample adds a few layers of graphene, and the pure graphene shows a sheet structure under SEM observation. Each sheet structure has a size of about 1 μm.
After the green compact was dried, the cross-section of the green compact was observed by SEM showed in Fig. 4-1. Even if the sample has been added to 8.5 vol% graphene, the SEM observation shows that the sample holds a uniform distribution of alumina, and graphene has no particularly visible agglomeration.
The green compact is mixed and produced in the medium-low temperature process. We can see from the SEM and the green compact after the debinding process, the independent and dispersed CNTs still exists (see Fig 4-2 for details). The heating temperature does not affect the structure of the CNT.
The morphology of the crystal grains in the green compact was observed by SEM, and it was examined whether the added graphene and
the carbon nanotubes were uniformly distributed green compact, and the atoms were transmitted through the EDS mapping function shown in Fig.
4-3. The distribution of the slurry was examined in the case of slurry mixing, and there was no local component dense phenomenon in the green compact, indicating that there was no apparent CNT and graphene agglomeration before sintering.
Fig.4-1 Cross-section morphology of Alumina+8.5 vol% CNT green compact
Fig.4-2 Isolated CNT in the cross-section morphology of Alumina+8.5 vol%
CNT green compact
CNT
Fig.4-3 EDS mapping for a cross-section of alumina+8.5 vol% CNT green compact
4-1-2 Sintering temperature planning
According to the Santanach study [32], when the pure alumina is sintered by the PECS method with the sintering temperature is above 1300
°C, it could achieve densification shown in Fig. 4-4.
Fig.4-4 Previous studies of PECS firing temperature[32]
Subsequently, when added CNT and Graphene specimen in this experiment, since the specific surface area of CNT and graphene is large, a small amount of additional accounts for a considerable volume fraction.
Therefore, it is necessary to increase the sintering temperature to ensure a reasonable performance of sintering, and thus, the sintering temperature is increased to 1500 °C. Subsequent experimental results also show that the addition of CNT and graphene makes densification difficult to achieve;
hence, it is necessary to increase the sintering temperature in the alumina nanocomposite.
Besides, when the initial raw material is mixed, about 10% PVA is added to assist the blade forming process. As we know that PVA is easy to form agglomeration, in order to avoid the possibility of PVA residue after the specimen is sintered, there are procedures that should be operated as follows: After the green compact is stacked, the specimen was heated to 400℃ at a rate of 0.5 C/min, and the temperature was maintained for 8 hours for debinding. Following that, the color of the sample is white;
therefore, there should be no carbon residue or only a minimal amount of carbon residue on it. In addition, sintering at 600℃ for 5 min by PECS should be able to effectively burn off the PVA residue (boiling point is 228
℃).
4-1-3 Density of nanocomposite
The density measurement results of the sintered specimens are shown in Table 4-1. A further result of the density will be analyzed later in this study. The theoretical density is calculated to be 2.25 g/cm3 for graphitic and 3.98 g/cm3 for alumina powder [33].
Sample Bulk density (g/cm3)
Theoretical density
Relative density (%)
Sintering temperature
Alumina, fine grained 3.82
3.98
95.98 1350℃
Alumina, coarse grained 3.89 97.74 1500℃
Alumina + 0.88 vol% CNT 3.88 3.96 97.86 1500℃
Alumina + 1.8 vol% CNT 3.82 3.95 96.74 1500℃
Alumina+ 3.5 vol% CNT 3.73 3.92 95.17 1500℃
Alumina+ 8.5 vol% CNT 3.55 3.83 92.62 1500℃
Alumina+ 0.88 vol% graphene 3.87 3.96 97.61 1500℃
Alumina + 1.8 vol% graphene 3.83 3.95 96.99 1500℃
Alumina + 3.5 vol% graphene 3.76 3.92 95.93 1500℃
Alumina+ 8.5 vol% graphene 3.59 3.83 93.66 1500℃
Table.4-1 the bulk density and the relative density of the sintered specimens
4-1-4 Phase identification
Fig. 4-5 、 4-6 shows XRD patterns of sintered alumina nanocomposites samples with different additives. There is a specific peak at 26.6° in the XRD pattern [34-35] when the only graphene was added to the sintered specimens. That indicates a highly organized crystal structure with an interlayer spacing of 0.34 nm, which is equal with the layer spacing of regular graphite. It’s probably because the interlayer spacing of the few-layer graphene has a structure similar to the regular graphite [6].
We make sure that there is some few-layer graphene in the sintered nanocomposites. That would bring influence to the thermophysical properties of the sintered specimens.
Fig.4-5 XRD patterns of alumina, alumina-graphene nanocomposites
Fig.4-6 XRD patterns of alumina, alumina-CNT nanocomposites
Fig.4-7 Raman spectra of alumina-1.8 vol% graphene green compact and sintered bulk, respectively
Fig.4-7 shows the Raman spectra that correspond to the alumina-1.8 vol% graphene nanocomposites before and after sintering by PECS.
Raman spectroscopy is very sensitive to the number of graphene layers.
Therefore, the number of graphene layers could be distinguished by the displacement and the width of G'-band [30]. After sintering, the peak of the G’ band is slightly moving to the right. That means the layers of graphene in the nanocomposite in increased. Due to the growth of alumina grains, the graphene is transferred by the alumina grain boundary to form a graphene aggregate.
Fig. 4-8 shows the Raman spectra of alumina-graphene nanocomposites samples. There is indeed some defective graphene in the nanocomposite by the characteristic peak D band, G band, and D’ band [28]. However, we cannot rule out that these characteristic peaks are affected by carbon infiltration from the graphite die.
4-2 Alumina-nanodiamond nanocomposite
4-2-1 Green compact and sintering
This study employs the following approaches. High purity 99.99%An alumina powder (α-Al2O3, TM-DAR, Taimei Chemicals Co., Japan,) with a purity of 99.99% was used in the present study. The mean average particle size of the powder was 0.2 μm, and its surface area was 14.5 m2/g. The nanodiamond (DND) is formed in closed chambers during the detonation of a mixture of explosives such as trinitrotoluene (TNT) and hexogen (RDX), where supersaturated carbon vapor from the explosives are condensed into liquid droplets. Following that, the liquid droplets are crystallized to form diamond particles as the pressure and temperature drop.
The average particle size is 20 nm. The nanodiamond (DND) is formed during the detonation of a mixture of explosives such as trinitrotoluene (TNT) and hexogen (RDX) in closed chambers, where supersaturated carbon vapor from the explosives condense into liquid droplets, which crystallize to form diamond particles as the pressure and temperature drop.
The average particle size is 20 nm. The amount of added nanodiamond added was 0.5, 1, 2, and 5 wt% respectively, which was corresponding to 0.57, 1.1, 2.3 and 5.6 vol%, respectively.
In the present study, the homogeneous alumina-nanodiamond
FUJI ELECTRONIC INDUSTRIAL CO., LTD.). The graphite dies are used under a uniaxial pressure of 50 MPa during sintering processes. The process was heated from 600ºC room temperature for 5 minutes and then heated to 1400ºC for 10 minutes. After sintering, the specimens were ground with a diamond pad and diamond paste in order to complete measurement and analysis.
4-2-2 Density of nanocomposite
The density of the alumina-nanodiamond composites was measured by the Archimedes water immersion method. The relative density was calculated by using 3.98 g/cm3 as the theoretical density for alumina and 3.5 g/cm3 for diamond.
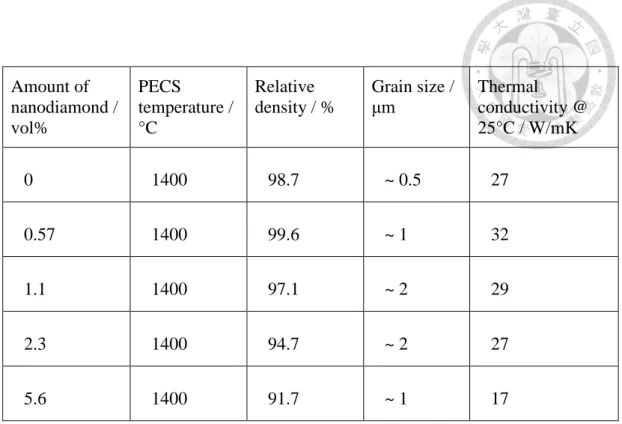
The measured densities of the samples as a function of nanodiamond concentrations are listed in Table 4-2. Nevertheless, all sintered samples showed high densification within a broad range, from 99.6% to 91.7%.
However, a gradual decrease in the density of alumina-nanodiamond composite was recorded with the increasing nanodiamond concentrations.
Kume et al. proposed that diamond and alumina are sintered by HIP/HOP method, and the relative density of 5% added diamond is maintained above 90% [36]. The experimental results fully support the earlier report.
Amount of nanodiamond / vol%
PECS
temperature /
°C
Relative density / %
Grain size / μm
Thermal conductivity @ 25°C / W/mK
0 1400 98.7 ~ 0.5 27
0.57 1400 99.6 ~ 1 32
1.1 1400 97.1 ~ 2 29
2.3 1400 94.7 ~ 2 27
5.6 1400 91.7 ~ 1 17
Table.4-2 Microstructural characteristics and thermal conductivity for the alumina-nanodiamond composites prepared in the present study.
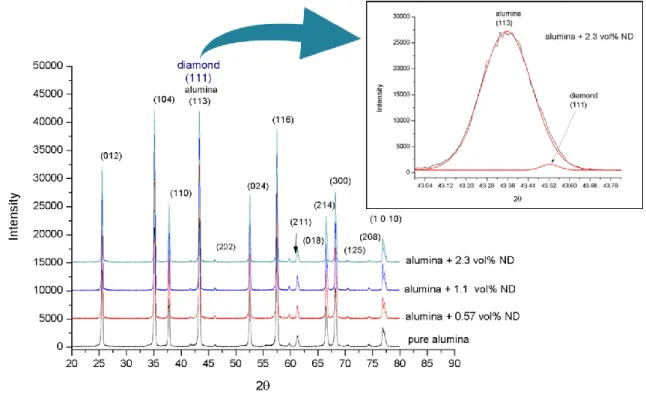
4-2-3 Phase identification
Figure 4-9 shows the XRD patterns of the alumina-nanodiamond composites. When added nanodiamond samples of different compositions and sintered at 1400 °C by PECS, the characteristic peaks showed the crystallization position of alumina. With the addition of nanodiamond, the diamond [111] and alumina [113] peak position is very close. As the composition increases, the mixing diffraction peaks of the alumina [113]
peak at 26.6° [34-35]. Apart from corundum and nanodiamond, no diamond-to-graphite conversion could be detected in any of the x-ray diffraction patterns of the composites.
Fig. 4-9 XRD patterns of the alumina-nanodiamond composites sintered at 1400 ℃
Chapter 5 Discussion
5.1 Characteristic of adding carbon nanotubes to alumina nanocomposites
5.1.1 Effect of microstructure of alumina-CNT nanocomposites
The specimen was prepared by initial powder agitation, doctor blade forming, lamination drying, and PECS sintering. The EDS was used as the composition mapping. Fig. 5-1 shows the alumina nanocomposite with 1.8 vol% CNT added. The experimental results show that the distribution of aluminum atoms and oxygen atoms is relatively average, while the content of carbon is relatively low, which is less obvious. If the content of some regions is below the lower limit, the reflected electrons will not be enough to show bright spots. However, the results can be seen from the EDS results. The alumina composite sintered specimen has no significant agglomeration phenomenon, and the specimen production method is quite successful and feasible.
Fig.5-1 EDS mapping of alumina + 1.8 vol% CNT
C
O Al
Effect of CNT addition on grain size
PECS dramatically contributes to the densification of sintering.
According to the previous study [7], in the case of slow sintering of general heating equipment, the relative density decreases sharply with the increase in the content of carbon nanotubes. For example, the relative density is only 79.5% for a composite of 10 vol% carbon nanotubes. In addition to the effect of the carbon nanotubes, densification may be affected by temperature gradients within the sample itself due to heat transfer from the heating element to the center of the sample. In contrast, the relative density of the composite that is rapidly hot-pressed by sintering can be only slightly reduced.
That can be attributed to a hot press sintering method, which can quickly reach a rapid sintering temperature and minimize the temperature gradient between the graphite mold and the sample. Besides, the use of current through the graphite mold and partially through the green compact during sintering can produce a remarkable effect. The ceramic/CNT composite can be sintered to approximately theoretical density by an electric field-assisted sintering process such as PECS.
The decrease in the density of the sintered specimen may be
substrate, the subsequent study of grain size and microstructure defects can explain the effect of sintering of alumina/CNT composites on microstructure.
If the dopant such as CNT is small enough, then the dopant will be dragged away by the grain boundary of alumina during the grain growth stage, and will not affect the grain growth of alumina [40-41]. The added CNTs are tubular and have a relatively large specific surface area, so that entanglement is apt to occur, which affects the grain growth of the alumina.
The PECS sintering process is carried out at 1500 °C with pure alumina and also with the addition of 0.88 vol%, 1.8 vol%, 3.5 vol% as well as 8.5 vol% CNT nanocomposite to the alumina. Fig. 5-2 to Fig.
5-6 showed the fracture surface with different composition components sintered at 1500 °C.
Fig.5-2 Fracture surface of pure alumina sintered specimen at 1500℃
trans granular
frac ture
Fig.5-4 Fracture surface of alumina-1.8 vol% CNT nanocomposite sintered at 1500℃
Fig.5-5 Fracture surface of alumina-3.5 vol% CNT nanocomposite sintered at 1500
Fig.5-6 Fracture surface of alumina-8.5 vol% CNT nanocomposite sintered at 1500℃
It can be observed from Fig. 5-2 that when the pure alumina specimen is sintered, the grain growth stage is not hindered and the average alumina powder particle size is about 0.1-0.2 μm. Moreover, and the grain growth wasn’t obstructed during the sintering process, and its final average is about 3μm. The average grain size of the CNT added specimen was only 1 μm. The relative density also dropped from 97.8% to 92.6%. The refinement of the bulk microstructure and the grain size are quite uniform. There are no crystals with particular heterogeneous growth,
Effect of CNT Addition on Grain Facet of Alumina Nanocomposites
In addition to the grain size, the grain shape in the composite is also affected by the CNT's crystalline phase concerning alumina. On the fracture surface of the monolithic alumina, facets having sharp edges can be seen in each of the crystal grains, which is the main feature of the pure alumina trigonal system (α-Al2O3). It can be observed in Fig. 5-2 that each alumina grain has a sharp facet. Fig. 5-3 shows that the nanocomposite with only 0.88 vol% CNT added has a considerable influence on the crystallinity of alumina grains after sintering at 1500℃and the facets of alumina grains become unclear. Many of them contain blunt edges, which show that even if CNTs do not form chemical bonds with alumina, they hinder the growth of alumina grains and affect the crystallinity of alumina recrystallization.
Effect of CNT Addition on the Fracture Surface of Alumina Nanocomposites
It is observed from Fig. 5-2 that the fracture surface of the pure alumina specimen is a distinct intergranular fracture mode, and each crystal grain remains reasonably intact. After the addition of CNTs, the fracture mode changes to the coexistence of intergranular and transgranular fracture mode [42]. From Fig. 5-3, the cross-section is reasonably smooth. After 0.88 vol% of CNTs are added, the grain boundary bonding gets stronger.
As the strength increases, the specific alumina crystal grains directly rupture, resulting in transgranular cracking. The toughness of alumina composites can be improved [43-45].
5-1-2 Effect of thermal conductivity of alumina-CNT nanocomposites
Regarding the thermal conductivity of alumina composites, this experiment uses a flash thermal conductivity analyzer to conduct tests, in which the thermal diffusivity and specific heat are measured by instrument operation, and the thermal conductivity is calculated by the formula. The other specific heat measurement is obtained by comparing the actual temperature rise of the sample with the temperature rise of the known specific heat standard sample, indicating the heat storage capacity of the material.
In this experiment, 0.88 vol%, 1.8 vol%, 3.5 vol%, and 8.5 vol%
CNT were added to the alumina substrate, and there are two control groups:
the first one is a pure alumina substrate including 1350℃ of sintering (the crystal grains were small), and the other one is a pure alumina substrate sintered at 1500℃ (large crystal grains). The temperature of the test piece base measured by the flash method is from 25 to 300℃, so that the simulated composite material may face the actual working temperature in the future, ensuring the thermal conductivity of the material at medium-high temperature (300℃). There will be no rapid deterioration.
Fig. 5-7, 5-8 can be summarized that adding a small amount of CNT can significantly increase the thermal conductivity, but the thermal conductivity decreases as the amount of CNT increases. In particular, when added the excess amount of CNT (addition of 8.5 vol%), it led to lower thermal conductivity. It can be said that the excess amount of MWCNTs
results in the formation of carbon-rich regions in the boundaries to affect the densification and heat transfer of the sintered samples.
Thermal diffusivity / mm2 /s
(a)
(b)
Specific heat capacity / J/gK
Fig.5-8 Calculated thermal conductivity of alumina-CNT composites as a function of temperature
It is shown in Fig. 5-9 that the thermal conductivity of CNT-alumina composites with different compositions is linear with the reciprocal of the measured temperature, indicating that the carrier of heat conduction is phonon regardless of pure alumina or composite [9]. The primary mechanism of heat transfer in alumina-based ceramics is the vibration of the alumina lattice. Therefore, the thermophysical properties (thermal diffusivity and heat transfer coefficient) depend mainly on the mean free path of the phonons and the speed at which the sound passes through the structure.
Fig.5-9 Thermal conductivity of CNT-alumina composite as a function of 1/T