國立臺灣大學公共衛生學院職業醫學與工業衛生研究所
碩士論文
Graduate Institute of Occupational Medicine and Industrial Hygiene College of Public Health
National Taiwan University Master thesis
大氣中真菌孢子的分布與環境因子的相關性 Temporal distribution of ambient fungal spores and the
association with environmental parameters
黃聖厷
Sheng-Hung Huang
指導教授 : 郭育良 博士、吳焜裕 博士
Advisor : Yue-Leon Guo, Ph.D; Kuen-Yuh Wu, PHD
中華民國 105 年 7 月
July, 2016
誌謝
時光飛逝,研究所兩年就這樣過去了,在當中無不受到許多人的幫助,也成 就了今天這本論文的誕生。首先最要感謝指導教授郭育良老師,憶起當時初進實 驗室時,老師就說這裡是你最後可以犯錯的機會,更是你改進錯誤的地方,當中 也許莽撞、也許迷失,或許事情並無做得盡善盡美,但感謝老師不放棄的指導,
不僅給予學術上的教導,重要的是那份態度與自我要求的精神。感謝吳焜裕老 師、吳章甫老師、黃耀輝老師與張靜文老師在論文上的指導與建議。感謝趙馨老 師、沈偉強老師在我需要協助時,引領我去看到事情的不同面向。再來幫助我最 多的就是 Bird,從一開始帶我們做實驗,每天都耗費許多精力,帶領我們判讀玻 片,到後來論文及報告的部分,只要有對於真菌上的疑惑,總是能提供我很好的 想法及方向。感謝秉鈺學姐、士群學長在我對於研究上有困難時,總是適時的給 予幫助,以及其他在我報告時,不吝於分享意見的每一位實驗室夥伴,還有我的 實驗室同學蔡宜秦,一起承擔那做實驗的辛勞。最後我要感謝家人與朋友,在背 後支撐著我,在我徬徨苦悶時,能有所依靠。
研究所的結束不是個終點,兩年的淬煉使自己成長,也期許在未來的道路 上,能依舊保有學生時代的熱誠。要感謝的人太多,我想就感謝天吧!
中文摘要
背景: 暴露到真菌會造成不良的健康影響,像是呼吸道疾病、過敏性疾病和感染
等等。真菌會存在於多項種環境介質中,且在生物氣膠中占有相當的部分。真菌孢
子在生成、釋放、運輸和沉降的過程中,己經知道會受到氣候因子的影響。但我們
對於台北都會區真菌孢子濃度的認知還是有限的。因此本研究目的是要去探討每
日的真菌孢子濃度,並去評估它與環境因子的相關性。
方法: 在 2015 整年間,採用 Burkard 七天連續性孢子採樣器去監測每日的孢子濃
度,採樣器架設在台北巿古亭國小的頂樓,流率為每分鐘 10 公升。氣象資料從中
央氣象局-台北測站取得,空氣汙染物資料由環保署空氣品質監測站-古亭測站取
得。除描述性統計外,真菌孢子濃度和環境因子的相關性使用多變項線性回歸分析。
結果: 我們取得了 309 個樣本在本次研究中。出現頻率超過 70%的真菌孢子為
Ascospores, Aspergillus/ Penicillium, Basidiospores, Cladosporium, Smuts
及Arthrinium 。大部分的真菌孢子在夏季的濃度較高,且發現到真菌孢子會與風
速呈現負相關,與溫度、露點溫度、和空氣汙染物呈現正相關。
結論: 真菌孢子濃度會受到氣象因子及空氣汙染物所影響,且在台北有著一定的
分布狀況。在夏季,較高的溫度及濕度會使得孢子的濃度提高;而當大雨或強風出
現時,濃度就會下降。本篇研究提供了台北真菌孢子室外基礎濃度。未來研究可用
此結果,進行更進一步的健康研究。
關鍵字 : 大氣、真菌孢子、環境因子、空氣污染物
Abstract
Background: Fungal spores are important ambient pollutants which present in all kinds
of environment and it contributes as a major component of ambient bio-particle. Exposure
to fungal spores is resulting to the adverse health outcomes such as respiratory diseases,
allergic disease and infection. Fungal spores are mainly determined by climate factors
include production, release, transport and deposition patterns. Previous study had
reported the temporal distributions of ambient fungal spore in Taipei area. However,
fungal spores were monitored only 7-day/month during 2005-2009. Little is known about
daily concentrations of ambient fungal spores. Therefore, the aim of this study is to
monitor daily concentration of fungal spore and evaluate their relationship with the
environmental parameters.
Method: Using the Burkard seven-day volumetric spore trap to monitor the daily
concentration of fungal spore during 2015 in Taipei. Sampler was set up on the rooftop
of Guting elementary school. The flow rate of sampler is 10 L/min. Daily meteorological
data were retrieved from Central Weather Bureau (CWB)- Taipei station. Daily air
pollutants were acquired from Taiwan Environmental Protection Administration
monitoring station-Guting station. Descriptive statistics of concentrations of ambient
fungal spores presented the distribution and characteristic of fungi. The relationships
between the concentrations of fungal spores and environmental parameters were
estimated by using multiple linear regression.
Results: A total of 309 samples were successfully collected during 2015. The most
prevalence fungal taxa were Ascospores, Aspergillus/ Penicillium, Basidiospores,
Cladosporium, followed by Smuts, Arthrinium, presenting in more than 70% of the
samples. Most concentration of fungal taxa were highest in summer. Fungal spores were
negatively correlated with wind speed, and positively associated with temperature, dew
point temperature and air pollutants.
Conclusions: We found the temporal distribution of fungal spores in Taipei.
Concentration of fungal spores were affected by the meteorological parameters and air
pollutants. Higher levels of fungal concentration was found in summer, likely related to
higher temperature and humidity. While there were the heavy rainfall and strong wind,
the concentration decreased. This study provides baseline information on concentration
of ambient fungal spores in Taipei. Further study can utilize it to investigate the health
outcomes associated with fungal spores.
Keyword: Ambient, Fungal spores, Environmental parameters
Table of contents
口試委員審定書---Ⅰ 誌謝---Ⅱ 中文摘要---Ⅲ
Abstract---Ⅳ Table of contents---Ⅵ List of Tables and Figures---Ⅶ
Chapter 1 Introduction---1
1.1 Background---1
1.2 Objective---2
Chapter 2 Literature review---3
2.1 Introduction to fungi---3
2.2 Sporulation and fungal spores releasing---3
2.3 Fungal importance and disease---4
2.4 Determinants of ambient fungal spores---5
Chapter 3 Materials and Methods---7
3.1 Study design---7
3.2 Ambient fungal spores---7
3.3 Air pollutant and meteorological data---8
3.4 Statistic analysis---9
Chapter 4 Results---11
4.1 Distributions and temporal trends of ambient fungal spores---11
4.2 Determinants of ambient fungal spores---11
Chapter 5 Discussions---14
5.1 Distributions and temporal trends of ambient fungal spores---14
5.2 Determinants of ambient fungal spores---15
5.3 Advantages and limitations---20
Chapter 6 Conclusions---21
Reference---22
List of Tables and Figures
Table 1a. Descriptive statistics for outdoor fungal concentrations (#/M3) in Taipei in 2015 (N=309). ---29 Table 1b. Descriptive statistics for environmental parameters in Taipei in 2015. ---30 Table 2 Spearman’s correlation coefficients between the concentrations of major
ambient fungal spores and environmental parameters in 2015. ---31 Table 3 Multiple regression for major fungal spores and 0- , 1- and 2-day-lag
environmental parameters in 2015. ---32 Figure 1. Temporal trend for daily concentration of total spores (spore m-3) in Taipei
during 2015. ---34 Figure 1a. Temporal trend for monthly concentration of Ascospores,
Aspergillus/Penicillium, Basidiospores, Cladosporium (spore m-3) in Taipei during 2015. ---35 Figure 1b. Temporal trend for monthly concentration of Smuts, Arthrinium, Nigrospora, Periconia (spore m-3) in Taipei during 2015. ---36 Figure 1c. Temporal trend for monthly concentration of Curvularia, Bortrytis, Torula
(spore m-3) in Taipei during 2015. ---37 Figure 2. Monthly averages of meteorological parameters (Temperature, Dew point
temperature, Wind speed, Relative humidity) in Taipei during 2015. ---38 Figure 3. Monthly averages of meteorological parameters (Solar radiation, Rainfall) in
Taipei during 2015. ---39 Figure 4. Monthly averages of air pollutants (CO, NO2, O3, SO2, PM2.5, PM2.5-10) in
Taipei during 2015. ---40
Chapter 1 Introduction
1.1 Background
Fungal spores are one of the most important ambient pollutants which present in all
kinds of environment and it contributes as a major component of ambient bio-particle
(Kochar et al, 2014). Some fungi such as Zygomycota, Ascomycota, and Basidiomycota
contain most genera of fungi that produce airborne fungal allergens (Levetin et al,
2016).Some fungi produce mycotoxin such as aflatoxins, ochratoxins . These fungi and
it production are not only find in food, but also find in the air or the settled dust. Exposure
to fungal spores is resulting to the adverse health outcomes such as respiratory diseases,
allergic disease, infection and even cancer. Aerobiological studies can help us to make
sure of the concentration of the fungal spores present in the atmosphere and give better
understanding of the relationship between their concentrations and the meteorological
parameters (Grinn-Gofron et al, 2015). Previous study by Chao and Lee in 2013 had
reported the temporal distributions of ambient fungal spore in Taipei area. However,
fungal spores were monitored only 7-day/month during 2005-2009 (Chao et al, 2013).
Little is known about daily concentrations of ambient fungal spores.
1.2 Objective
The aim of this study is to monitor daily concentration of fungal spore and evaluate their
relationship with the environmental parameters.
Chapter 2 Literature review
2.1 Introduction to fungi
A fungus, any of about 99,000 known species of organisms of the kingdom Fungi,
which includes the yeasts, rusts, smuts, mildews, molds, and mushrooms, is a eukaryote
that digests food externally and absorbs nutrients directly through its cell walls (Carris et
al, 2012). A typical fungus consists of a mass of branched, tubular filaments, called
hyphae (singular hypha), enclosed by a rigid cell wall (Moore, 2016). Many fungi are
free-living in soil or water; others form parasitic or symbiotic relationships with algae,
plants or animals. Fungi are involved in a wide range of activities like some fungi are
decomposers, which are responsible breaking down organic matter and releasing carbon,
oxygen, nitrogen, and phosphorus into the soil and the atmosphere with bacteria.
2.2 Sporulation and fungal spores releasing
Following a period of growth, fungi enter a reproductive phase by forming and
releasing vast quantities of spores. In both sexual and asexual reproduction, fungi produce
spores, which are usually single cells produced by fragmentation of the mycelium or
within specialized structures (sporangia, gametangia, sporophores, etc.) (Boundless,2016).
There are two effects of meteorological variables on release processes include inert
release process and active release process (Jones et al, 2004). The inert release process of
material from a surface will depend on the balance of two groups of forces, i.e. bonding
forces and removal forces. Forces such as the electrostatic force if the particle and surface
are differently charged, or surface tension if the surface is wet, will tend to retain the
particle on the surface, as will any physical attachment, it is called bonding forces.
Bonding effects are most likely to be affected by the temperature and humidity of the
surrounding air, and by the radiation balance of the surface. Forces, which is greater than
the forces attaching the particle to the surface, might remove the particle from the surface
when the movement of the surface is varying and the surface accelerates away from the
particle. Such movement may occur as a result of wind, impact of raindrops or other
physical disturbance. The active release process are most in Ascomycetes and
Hymenomycetes (the largest order of Basidiomycetes), active release of ascospores and
basidiospores takes place release frequently depends on the activity of turgid cells, which
require a supply of water, and spores can be ejected for substantial distances—in the case
of asci, 2–300 mm depending on species.
2.3 Fungal importance and disease
Fungi are essential to many household and industrial processes, making of bread, wine,
beer, and certain cheeses (Moore, 2016). Studies of fungi have greatly contributed to the
accumulation of fundamental knowledge such as molecular biology, genetic engineering,
and other basic disciplines of biology. The medical relevance of fungi was discovered by
Scottish bacteriologist Alexander Fleming, who published a scientific report announcing
the discovery of penicillin, the first of a series of antibiotics in 1929. However, there are
also adverse health effects of fungi. For example, Aspergillosis, an infection caused by
Aspergillus, cause allergic reactions, lung infections, and infections in other organs (CDC,
2016). Candidiasis, a fungal infection caused by yeasts that belong to the genus Candida,
caused health hazard depending on the area of the body that is infected such as in the
mouth or throat is called “thrush”, in the vagina is referred to “yeast infection”, in
bloodstream and spread throughout the body is called Invasive candidiasis.
2.4 Determinants of ambient fungal spores
Fungal spores are known to be influenced by the environment and biological factors
such as geographical location, air pollution, weather conditions, human activity and local
source of vegetation (Grinn-Gofron´ et al, 2015). Other study reported fungal spores are
mainly determined by climate factors include production, release, transport and
deposition patterns. In this study, there were a strong relationship between the lichen-
forming fungal spores and rainfall events by using spearman's correlation tests (Favero-
Longo et al, 2014). Study in Poland reported temperature is the environmental factor that
can significantly affect the growth and development of fungi, including the abundance of
their sporulation (Kasprzyk et al, 2016). The fungal spores also associated with lag day.
In Sydney study reported the environmental parameters like relative humidity in the
previous 1,2 and 3 days were positively correlated with the concentration of Alternaria
and other parameters associated with spores on sampling day. (Stennett et al, 2004).
Chapter 3 Materials and Methods
3.1 Study design
We monitor daily ambient fungal spores during 2015 in Taipei, Taiwan. Investigating
the composition and temporal distribution of concentrations of ambient fungal spores
during the study period. We also evaluate the relationships between the concentrations of
fungal spores and environmental parameters and air pollutants.
3.2 Ambient fungal spores sampling
Using the Burkard seven-day volumetric spore trap to monitor the daily fungal spores
from January to December during 2015 in Taipei. Sampler was set up on the rooftop of
Guting elementary school of Taipei city at a height 15 meters above the ground, where
the Environmental Protection Administration (EPA) monitoring station is located. The
flow rate of sampler is 10 L/min and the spores were impacted onto Melinex tape coated
with Lubriseal grease (A.H. Thomas, Inc., Philadelphia, PA, USA) which moves past the
inlet at 2 mm per hour over a 24-hour period. We calibrated the flow rate after we replaced
the drum with the tape once a week. The collected 7-day tapes were cut into seven
segments which spores were trapped on it through a 2 mm X 14 mm orifice and presented
fungal concentrations over 24 hours on a 48 mm band. Each segment was fixed on
microscopic slide and colored with glycerin jelly. We identified samples under
microscopic at a 1000x magnification using longitudinal traverse method. Then, we
transformed spores counts into average daily concentrations (spore m-3). Samples
identified base on fungal spore morphological characteristics. We using the fungal spore
identification of American Academy of Allergy Asthma & Immunology (AAAAI) to
identify 24 fungal taxa including Alternia, Ascospores, Aspergillus/Penicillium,
Arthrinium, Basidiospores, Botrytis, Cercospora, Cladosporium, Curvularia, Drechslera/Helminthosporium, Epicoccum, Fusarium, Nigrospora, Oidium/Erysiphe, Periconia, Peronospora, Pithomyces, Polythrincium, Rusts, Smuts, Stemphylium, Torula, Tetraploa and Ulocladium. The identified fungal spores which were not on the list were
categorized as other fungi. Fungal spores were broken or covered by gel or particle that
difficult to identify were categorized as “unidentified” spores. Fungal spores were still
undiscovered were categorized as “unknown” fungi.
3.3 Air pollutant and meteorological data
Daily meteorological data were retrieved from Central Weather Bureau (CWB)- Taipei
station (121°30’ 24.15”E, 25°02’ 22.62”N). The Taipei station was the closest station to
our sampling site. The data included temperature (°C, Sheathed Thermometer.), relative
humidity (%, Hair hygrometer), rainfall (mm, tipping-bucket raingauge), dew point
temperature (°C, hair hygrometer), solar radiation (MJ/m2, solar-cell sunshine recorder)
and average wind speed (m/s, anemometers). Daily air pollutants were acquired from
Taiwan Environmental Protection Administration monitoring station-Guting station
(121°31’ 46.40’’E, 25°01’ 4.19’’N). The data Included sulfur dioxide, carbon monoxide
(ppm, carbon oxide analyzer, absorbing non-dispersive infrared.), ozone (ppb, ozone
analyzer, ultra-violet (UV) absorption.), PM2.5 (μg/ m3, beta ray analyzer, differences of
radiation strength on the filter paper), PM10 (μg/ m3) and nitrogen dioxide (ppb, nitrogen
oxide analyzer, theorem of chemiluminescence.).
3.4 Statistic analysis
Analysis were performed by Microsoft Excel, JMP 10 and SAS version 9.4 (SAS
Institute Inc., Cary, NC, USA). Descriptive statistics of concentrations of ambient fungal
spores such as mean, median, standard deviation, minimum, maximum, and IQR
presented the distribution of fungi.
The relationships between the concentrations of fungal spores and environmental
parameters and air pollutants were used multiple regression. The day-lag before the
sampling day of meteorological parameters also analysis on it. We used base-10 logarithm
to transform fungal concentration to normality. Simple linear regression was used to
determine which variable were significantly associated with fungal spores. Those
significant variable were included for forward stepwise regression with p-value of 0.2 or
smaller, and then the variables with highest p-value were excluded until all remaining
variables were with p-value of 0.01 or smaller. Avoiding zero values, we add 0.5 to fungal
spore counts on log transformation of fungal concentrations.
Chapter 4 Results
4.1 Distributions and temporal trends of ambient fungal spores
There were total 309 fungal samples in this study during 2015. The missing data
included New year, Chinese new year, failure drum exchange and power problem. Table
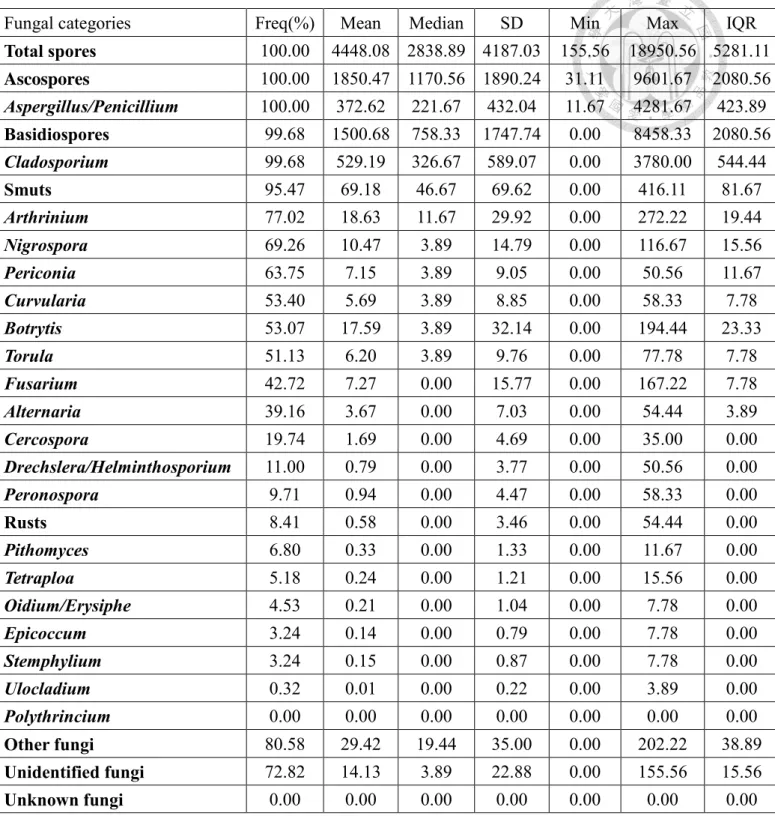
1a showed the distribution of ambient fungal spores. The mean concentrations of total
fungal spores was 4448.08 spore m-3. The most prevalence fungal taxa were Ascospores,
Aspergillus/ Penicillium, Basidiospores, Cladosporium, followed by Smuts, Arthrinium,
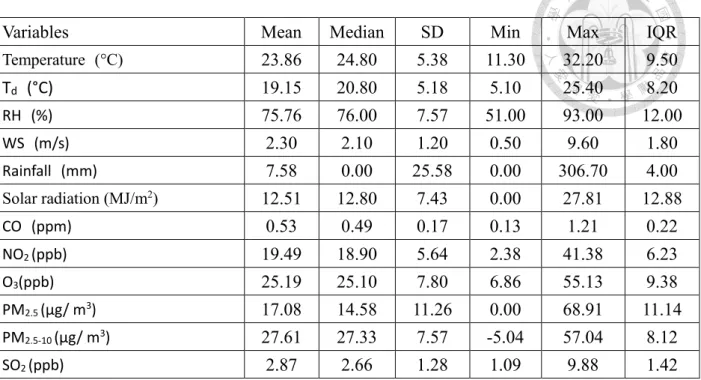
presenting in more than 70% of the samples. Table 1b showed the distribution of
environmental parameter. The mean temperature was 23.86 °C.
The temporal distribution for monthly concentrations of total fungal spores during the
sampling period showed in figure 1. The concentrations of total spores was highest in
summer (June to August). Figure 1a-1c showed the temporal distribution for monthly
concentrations of fungal categories. Most concentration of fungal taxa were highest in
summer, except for a peak in Curvularia in September and Botrytis in May.
4.2 Determinants of ambient fungal spores
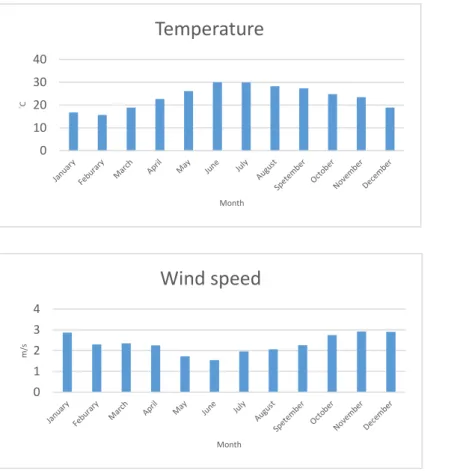
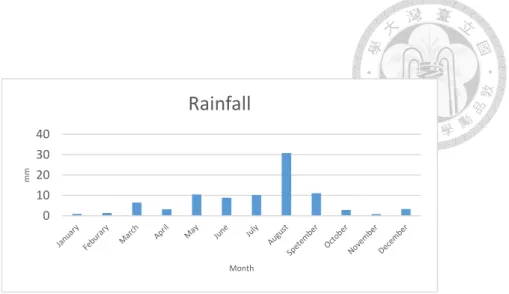
Figure 2-3 showed the monthly averages of meteorological factors in Taipei during the
study period. Temperature, solar radiation and dew point temperature were highest in
summer. Relative humidity was highest in March. Wind speed was highest in winter.
Rainfall was highest in August. Figure 4 showed the monthly averages of air pollutants.
Most air pollutants were lowest concentration in summer, except for SO2.
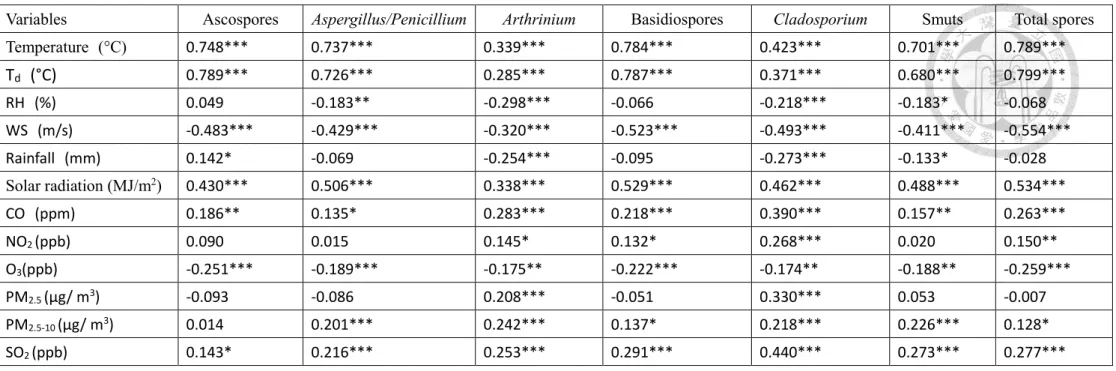
The relationships between the concentrations of major ambient fungal spores and
environmental parameters showed in Table 2. Most fungal taxa were positively associated
with air pollutants, except for O3. Most fungal taxa were negatively associated with
relatively humidity, wind speed and rainfall, but positively with solar radiation,
temperature and dew point temperature.
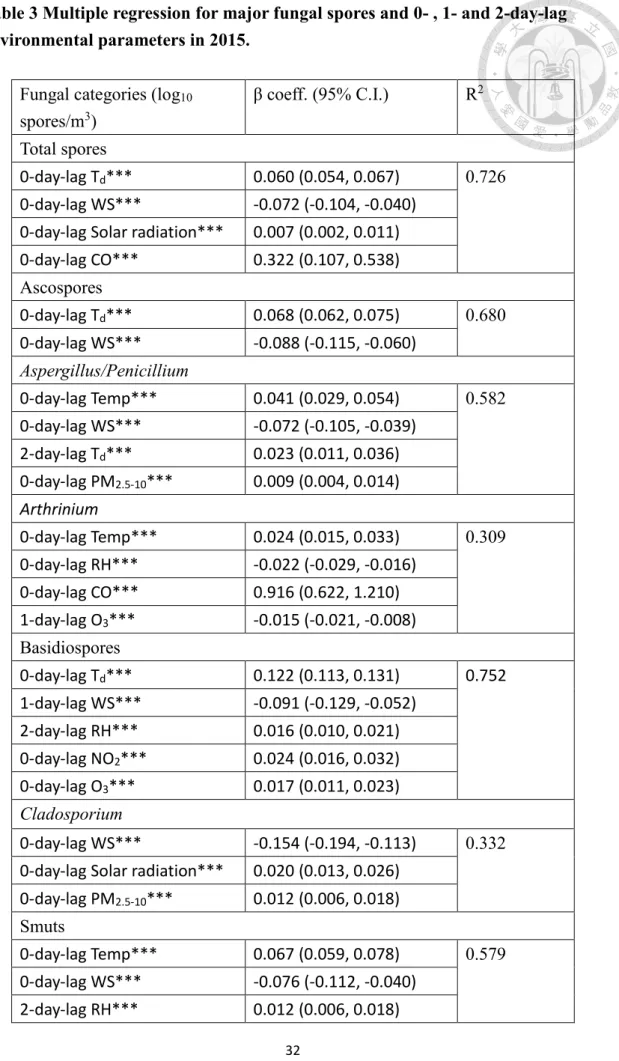
Table 3 showed the multiple regression for fungal spores including total spores,
Ascospores, Aspergillus/Penicillium, Arthrinium, Basidiospores, Cladosporium and
Smuts and 0- , 1- and 2-day lag environmental parameters. Most fungal taxa were
positively associated with dew point temperature, but negatively with wind speed. We
found 72.6% of the variability in the total spore concentrations was explained by the
model. In the model, total spores were positively associated with dew point temperature,
solar radiation and CO on sampling day, but negatively with wind speed. We found 68.0%
of the variability in the Ascospores concentrations was explained by the model. In the
model, Ascospores were positively associated with dew point temperature, but negatively
associated with wind speed on sampling day. 58.2% of the variability in the
Aspergillus/Penicillium concentrations was explained by the model. In the model,
Aspergillus/Penicillium were positively associated with temperature and PM2.5-10, but
negatively with wind speed on sampling day. On two day before sampling day,
Aspergillus/Penicillium were positively associated with dew point temperature. 30.9% of
the variability of the Arthrinium was explained by the model. Arthrinium were positively
associated with temperature and CO on sampling day, but negatively associated with
relatively humidity. It was also negatively associated with 1-day-lag ozone. 75.2% of the
variability of the Basidiospores was explained by the model. Basidiospores were
positively associated with dew point temperature, NO2, O3 on sampling day.
Basidiospores were positively associated with 2-day-lag relative humidity, but negatively
with 1-day-lag wind speed. We found 33.2% of the variability of the Cladosporium was
explained by the model. In the model, Cladosporium were positively associated with solar
radiation and PM2.5-10, but negatively with wind speed on sampling day. 57.9% of the
variability of the Smuts was explained by the model. Smuts were positively associated
temperature and PM2.5-10, but inversely associated with wind speed on sampling day.
Smuts were positively associated with 2-day-lag relatively humidity, but negatively with
2-day-lag rainfall.
Chapter 5 Discussions
5.1 Distributions and temporal trends of ambient fungal spores
This study using Burkard seven-day volumetric spore trap collect ambient fungal
spores, and investigate the distributions and characteristic of ambient fungal spores in
Taipei during 2015. We found the most prevalent fungal spores in Taipei were Ascospores,
Aspergillus/Penicillium, Basidiospores, Cladosporium, presented in almost 100% of the
samples. Smuts, Arthrinium, presented in more than 70% of the samples. The results were
similar to previous study in Hualien, Taiwan. Ho et al. (2005) showed Ascospores,
Cladosporium, Aspergillus/Penicillium and Ganodema were the most prevalent fungal
categories in Hualien, Taiwan, presented in more than 60% of the samples. Wu et al. (2004)
found that Cladosporium, Ascospores, Periconia, Basidiospores, Botrytis, Smuts,
Alternaria, Aspergillus/Penicillium were the most prevalent fungal taxa in Tainan, Taiwan
during the sandstorm episode days, and days before and after the episodes. Both in
previous study in Taiwan, although the sampling site were different, the results were the
same to us. Study using the Burkard portable air sampler in Taipei, found the most
prevalent fungal taxa were Cladosporium and Penicillium, presented in more than 70%
of the sample (Chao et al, 2012). Burch et al. (2002) showed the major composition of
fungal taxa in Tulsa site were Cladosporium, Basidiospores and Ascospores. Study in
Havana (Cuba) showed the results that Cladosporium, Coprinus, Lepthosphaeria,
Aspergillus/Penicillium were the most prevalent fungal categories (Almaguer et al, 2014).
Other study in Seoul showed that Ascomycota and Davidiella (anamorph : Cladosporium)
were the most prevalent fungal taxa (Oh et al, 2014). Study in other country, the
dominants fungal taxa were similar to our findings. There were differences of the fungal
taxa compositions between our findings and the previous studies because of different
study period, climate, local source of vegetation.
It is well known that weather conditions influence the daily variability as well as
seasonal levels of ambient spore concentrations (Grinn-Gofroń et al, 2011). In our study,
concentrations of ambient fungal spores had seasonal patterns, with higher level in
summer. There were similar results in previous study in Taiwan (Ho et al, 2005; Wu et al,
2004). Because of higher temperature and humidity, concentration of fungal spores were
higher in summer.
5.2 Determinants of ambient fungal spores
Weather conditions influence the biology of fungi such as production, release,
dispersion and deposition of spores as well as the diversity and number of airborne bio-
particles (Almaguer et al, 2014). A typical pattern of growth depends on response to the
nutrients in the environment, modified by other environmental factors (University of
Sydney, 2004; Carlile et al, 1994; Robson et al, 2007).
During sporulation, the environment plays a major role in determining whether a
fungus forms sexual or asexual spores. The important factors are include water, light,
nutrients, oxygen, pH and temperature (University of Sydney, 2004). The majority of
fungi are mesophilic, growing usually be correlated with a limited range of temperatures
between 15°C and 35°C. In our findings, there were similar trend on temperature and
fungal categories. The higher temperature in summer, the higher concentration of fungal
spores. Most fungal taxa were positively correlated to temperature in our study. It was
similar to previous study in Taiwan (Ho et al, 2005; Wu et al, 2004) and other study in
the world (Rodríguez-Rajo et al, 2005; Artac et al, 2014). In our study, most fungal taxa
were positively correlated to dew point temperature. The water vapor in the air becoming
saturated and condensing out is called dew point temperature. Most often humidity we
meet as ‘‘relative humidity’’ given as a percent—meaning the higher the percent, the
closer the temperature and dew point are (Grinn-Gofron et al, 2011). The higher relative
humidity and dew point temperature, the more water vapor content in the environment to
produce the spores. We found that relative humidity was little difference. It was almost
70-80% in whole year of 2015. However, the dew point temperature was highest in
summer. Thus, there were more water vapor to help fungi to grow. Previous study showed
total spores, Basidiospores, Ascospores, and Alternaria were significantly and positively
correlated with dew point temperature (M. Burch et al, 2002). Study in Poland showed
the Aspergillus and Penicillium were positively correlated with dew point temperature on
1-, 2-, 3-day-lag and sampling day (Grinn-Gofron et al, 2011).
In the atmospheric environment, air movement is often unpredictable in the transport
and dispersal of fungal spores (Wiley et al, 2007). How well spores are dispersed and
survive over horizontal distance is determined by their ability to survive in the ambient
environment, such as size (Jones et al, 2004). Pasanen et al. (1991) found that spores of
Aspergillus fumigatus and Penicillium were released from leaves when the air velocity
was 0.5 m/s, while Cladosporium required an airflow of at least 1.0 m/s for spore release.
Minimum wind was directly correlated with spore counts, while maximum wind was
negatively correlated. High wind speed is also likely to disperse spore clouds to dilute
spore concentrations (Wiley et al, 2007). In our study, most fungal taxa were negatively
correlated with wind speed. It was similar to the previous study that Li found that wind
speed was negatively correlated with Basidiospores (Li, 2005).
Movement due to the wind (either waving or fluttering) or being struck by a raindrop
or other physical disturbance of the plant surface may result in material resting on the
surface being lifted into the air (Jones et al, 2004). We found that most fungal categories
were negatively correlated with rainfall. Previous study found that rainfall had significant
influence on decreasing fungal spore number (Sivasakthivel et al, 2015). There was a
study found intermittent rain produced a spore concentration peak for each rainfall event,
but a lower total number of spores than for continuous rain (Jones et al, 2004; Gottwald
et al, 1997). Although rainfall can help spores to disperse, rain also removes particles
from the air by both rainout and washout effects (Burge et al, 2000).
In our finding, fungal taxa were positively correlated to radiation. There was a report
found that high UV-B radiation levels of the Antarctic environment as spores have shown
higher germination rates (Tosi et al, 2005). Other study reported that some fungi absorb
solar radiation to enhance the growth (Dadachova et al, 2007). However, a study found
that UV-B radiation reduced hyphal growth (Tosi et al, 2005), and high-intensity 405-nm
light inactivate germinating spores of fungi (Murdoch et al, 2013).
Approximately 24% of the count of total atmospheric particles and 5-10% of the total
suspended particulate matter were reported to be contributed by bio-aerosols (Adhikari et
al, 2006). Previous study found that PM10 were positively correlated to fungal taxa (Sousa
et al, 2008). In our study, particulate matter were positively correlated with most fungal
categories. PM could bind with airborne pollen and fungal spores altering their
morphology and changing the dispersal pattern of bio-aerosols in ambient air by altering
the particle aerodynamic properties (Adhikari et al, 2006).
Tropospheric ozone is a strongly phytotoxic oxidant, possibly altering the production
content of pollen (Adhikari et al, 2006). Study reported that ozone has been shown to
significantly reduce plant growth and yields through the induction of oxidative stress in
plants, leading to enhancement of senescence, reduction of net photosynthesisand the
premature degradation of vital leaf proteins (Tiedemann et al, 2000). Previous study
written by S.I.V. Sousa et al found that most fungal categories were negatively correlated
with ozone (Sousa et al, 2008). However, other study found that Cladosporium and
Alternaria were positively correlated to ozone (Grinn-Gofron et al, 2011). Tiedemann and
Firsching. (2000) reported that the pathogenicity of rust fungi could be increased by ozone.
Therefore, besides causing respiratory health hazard, ozone may also influence the
sources of ambient bioaerosols (Adhikari et al, 2006). We found that ozone was
negatively correlated with fungal taxa. Sulfur dioxide is known to have antifungal activity
and has been used for the control of postharvest fungal diseases (Fenn et al, 1988). We
found sulfur dioxide was negatively correlated with some fungal taxa. Sulfur dioxide has
been shown to inhibit growth of fungi and to inhibit germination of fungal spores (Babich
et al, 1978). Effect of SO2 such as formation of sulphate and toxic intermediate solution
products, reductions in pH and loss of nutrients, were probably reduced the abundance of
fungal species (Newsham et al, 1992). Although SO2 was positively correlated with most
fungal categories in spearman’s rank test, we found sulfur dioxide was not the mainly
parameters to affect the spores concentration in multiple regression.
5.3 Advantages and limitations
This study collected daily ambient fungal spores in Taipei during 2015. The results
could clearly understand the concentrations of fungal spores in Taipei, further know about
its distribution, characteristic and relationships with environmental parameters. However,
there were limitations during this sampling period. For example, first of all, there were
only one instrument located 15 m above ground level. This can not interpret whole of
Taipei, and the exposure of fungal spores may not realistically reflect to the human.
Second, for microscopic method, we counted only 24 fungal taxa, but there were more
than ten thousands of fungi in the world. Third, unidentified fungi on fungal categories,
because of broken or covered by gel or particles may underestimated the concentration of
fungal spores. Forth, meteorological parameters and fungal spores samples acquired from
different place.
Chapter 6 Conclusions
We used Burkard seven-day volumetric spore trap to monitor daily ambient fungal
spores in Taipei from January to December during 2015, and investigate the distributions
and characteristics of ambient fungal spores. We found the temporal distribution of fungal
spores in Taipei. Concentration of fungal spores were affected by the meteorological
parameters and air pollutants. In summer, the higher temperature and humidity, the higher
level in concentration. While there were the heavy rainfall and strong wind, the
concentration decreased. Most air pollutants bind with fungal spores. When the
concentration of pollutants were higher, it found higher concentration of fungal spores.
This study is baseline of concentration of ambient fungal spores in Taipei. Further study
can utilize it to investigate the health outcome.
Reference
Adhikari A, Reponen T, Grinshpun SA, Martuzevicius D , LeMasters G : Correlation of
ambient inhalable bioaerosols with particulate matter and ozone: A two-year study.
Environmental Pollution 140 (2006) 16e28
Almaguer M & Aira MJ & Rodríguez-Rajo FJ & Rojas TI : Temporal dynamics of
airborne fungi in Havana (Cuba) during dry and rainy seasons: influence of
meteorological parameters. Int J Biometeorol (2014) 58:1459–1470
Babich H and Stotzky G : Influence of pH on inhibition of Bacteria, Fungi, and
Coliphages by Bisulfite and Sulfite. Environmental research 15, 405-417 (1978)
Boundless (2016). Boundless Biology. Retrieved from
https://www.boundless.com/biology/textbooks/boundless-biology-textbook/fungi-
24/characteristics-of-fungi-149/fungi-reproduction-591-11810/
Burch M ·Levetin E : Effects of meteorological conditions on spore plumes. Int J
Biometeorol (2002) 46:107–117
Burge HA and Rogers CA : Outdoor Allergens. Environmental Health Perspectives Vol
108, Supplement 4 (2000).
Chao HJ & Chan CC & Rao CY & Lee CT & Chuang YC & Chiu YH & Hsu HH & Wu
YH : The effects of transported Asian dust on the composition and concentration of
ambient fungi in Taiwan. Int J Biometeorol (2012) 56:211–219
Chao, HJ; Lee, MF : Characteristics and health impacts of ambient bioparticles in
Northern Taiwan (2013)
Favero-Longo SE, Sandrone S , Matteucci E , Appolonia L , Piervittori R : Spores of
lichen-forming fungi in the mycoaerosol and their relationships with climate factors.
Science of the Total Environment 466–467 (2014) 26–33
Carris, LM, Little CR, and Stiles CM : Introduction to Fungi. 2012. The Plant Health
Instructor. DOI:10.1094/PHI-I-2012-0426-01. Retrieved from
http://www.apsnet.org/edcenter/intropp/pathogengroups/pages/introfungi.aspx
Centers for Disease Control and Prevention : Fungal diseases. 2016
Grinn-Gofron A. : Airborne Aspergillus and Penicillium in the atmosphere
of Szczecin, (Poland) (2004–2009). Aerobiologia (2011) 27:67–76
Grinn-Gofroń A & Strzelczak A : The effects of meteorological factors on the
occurrence of Ganoderma sp. spores in the air. Int J Biometeorol (2011) 55:235–241
Dadachova E, Bryan RA , Huang X, Moadel T , Schweitzer AD , Aisen P , Nosanchuk
JD, Casadevall A : Ionizing Radiation Changes the Electronic Properties of Melanin and
Enhances the Growth of Melanized Fungi. PLoS ONE, 2007 | Issue 5 | e457
Grinn-Gofron´ A •Bosiacka B : Effects of meteorological factors on the composition of
selected fungal spores in the air. Aerobiologia (2015)
Ho HM, Rao CY, Hsu HH, Chiuc YH, Liud CM, Chao HJ : Characteristics and
determinants of ambient fungal spores in Hualien, Taiwan. Atmospheric Environment
39 (2005) 5839–5850
Jones AM, Roy M. Harrison. : The effects of meteorological factors on atmospheric
bioaerosol concentrations—a review. Science of the Total Environment 326 (2004) 151–
180
Kochar S, Ahlawat M, Dahiya P.,and Chaudhary D.: Assessment of allergenicity to
fungal allergens of Rohtak city, Haryana, India. Allergy Rhinol (2014)
Kasprzyk I . Kaszewski BM . Weryszko-Chmielewska E . Nowak M . Sulborska A
Kaczmarek J . Szymanska A . Haratym W . Jedryczka M : Warm and dry weather
accelerates and elongates Cladosporium spore seasons in Poland. Aerobiologia (2016)
32:109–126
Li, D.-W. : Release and dispersal of basidiospores from Amanita muscaria var. alba and
their infiltration to a residence. Mycol. Res. 109:1235-1242 (2005).
Levetin E, Horner WE, and Scott JA, ARMCCM : Taxonomy of Allergenic Fungi. 2016
American Academy of Allergy, Asthma & Immunology (J Allergy Clin Immunol Pract
(2016)
Moore D : fungus. (2016). In Encyclopædia Britannica. Retrieved from
https://global.britannica.com/science/fungus
Murdoch LE, Mckenzie K, Maclean M, Macgregor SJ, Anderson JG : Lethal effects of
high-intensity violet 405-nm light on Saccharomyces cerevisiae, Candida albicans, and
on dormant and germinating spores of Aspergillus niger. Fungal biology 117 (2013) 519
e527
Newsham K, Frankland JC, Boddy L and Ineson P : Effects of dry-deposited sulphur
dioxide on fungal decomposition of angiosperm tree leaf litter I. Changes in
communities of fungal saprotrophs. New Phytol. (1992), 122, 97-110
Oh SY, Fong JJ, Park MS, Chang L, and Lim YW : Identifying Airborne Fungi in Seoul,
Korea Using Metagenomics. Journal of Microbiology (2014) Vol. 52, No. 6, pp. 465–
472
Rodríguez-Rajo FJ, Iglesias I and Jato V : Variation assessment of airborne Alternaria
and Cladosporium spores at different bioclimatical conditions. Mycol. Res. 109 (4):
497–507 (April 2005).
Stennett PJ ·Beggs PJ : Alternaria spores in the atmosphere of Sydney, Australia,
and relationships with meteorological factors. Int J Biometeorol (2004) 49:98–105
Sousa SIV, Martins FG, Pereira MC, Alvim-Ferraz MCM, Ribeiro H,
Oliveira M, Abreu I : Influence of atmospheric ozone, PM10 and meteorological factors
on the concentration of airborne pollen and fungal spores. Atmospheric Environment 42
(2008) 7452–7464
Sivasakthivel S, Nandini. N : Seasonal Distribution of Ambient Fungal Spore in
Bengaluru, Karnataka, India. 2015 IJSRSET | Volume 1 | Issue 4 |
Tiedemann AV , Firsching KH : Interactive effects of elevated ozone and carbon dioxide
on growth and yield of leaf rust-infected versus non-infected wheat. Environmental
Pollution 108 (2000) 357±363
Tosi S . Onofri ES. Brusoni EM . Zucconi EL. Vishniac H : Response of Antarctic soil
fungal assemblages to experimental warming and reduction of UV radiation. Polar Biol
(2005) 28: 470–482
University of Sydney. : FUNGAL BIOLOGY .2004. Retrieved from
http://bugs.bio.usyd.edu.au/learning/resources/Mycology/contents.shtml
Wu PC, Tsai JC, Li FC, Lung SC, Su HJ : Increased levels of ambient fungal spores in
Taiwan are associated with dust events from China. Atmospheric Environment 38
(2004) 4879–4886
Wiley J & Hoboken : Sampling and analysis of indoor microorganisms (2007).
Table 1a. Descriptive statistics for ambient fungal concentrations (#/M3) in Taipei in 2015. (N=309)
Fungal categories Freq(%) Mean Median SD Min Max IQR
Total spores 100.00 4448.08 2838.89 4187.03 155.56 18950.56 5281.11 Ascospores 100.00 1850.47 1170.56 1890.24 31.11 9601.67 2080.56 Aspergillus/Penicillium 100.00 372.62 221.67 432.04 11.67 4281.67 423.89 Basidiospores 99.68 1500.68 758.33 1747.74 0.00 8458.33 2080.56 Cladosporium 99.68 529.19 326.67 589.07 0.00 3780.00 544.44
Smuts 95.47 69.18 46.67 69.62 0.00 416.11 81.67
Arthrinium 77.02 18.63 11.67 29.92 0.00 272.22 19.44
Nigrospora 69.26 10.47 3.89 14.79 0.00 116.67 15.56
Periconia 63.75 7.15 3.89 9.05 0.00 50.56 11.67
Curvularia 53.40 5.69 3.89 8.85 0.00 58.33 7.78
Botrytis 53.07 17.59 3.89 32.14 0.00 194.44 23.33
Torula 51.13 6.20 3.89 9.76 0.00 77.78 7.78
Fusarium 42.72 7.27 0.00 15.77 0.00 167.22 7.78
Alternaria 39.16 3.67 0.00 7.03 0.00 54.44 3.89
Cercospora 19.74 1.69 0.00 4.69 0.00 35.00 0.00
Drechslera/Helminthosporium 11.00 0.79 0.00 3.77 0.00 50.56 0.00
Peronospora 9.71 0.94 0.00 4.47 0.00 58.33 0.00
Rusts 8.41 0.58 0.00 3.46 0.00 54.44 0.00
Pithomyces 6.80 0.33 0.00 1.33 0.00 11.67 0.00
Tetraploa 5.18 0.24 0.00 1.21 0.00 15.56 0.00
Oidium/Erysiphe 4.53 0.21 0.00 1.04 0.00 7.78 0.00
Epicoccum 3.24 0.14 0.00 0.79 0.00 7.78 0.00
Stemphylium 3.24 0.15 0.00 0.87 0.00 7.78 0.00
Ulocladium 0.32 0.01 0.00 0.22 0.00 3.89 0.00
Polythrincium 0.00 0.00 0.00 0.00 0.00 0.00 0.00
Other fungi 80.58 29.42 19.44 35.00 0.00 202.22 38.89
Unidentified fungi 72.82 14.13 3.89 22.88 0.00 155.56 15.56
Unknown fungi 0.00 0.00 0.00 0.00 0.00 0.00 0.00
Freq-frequency; SD-standard deviation; Min-minimum; Max-maximum; IQR-inter-quartile range
*Frequency was the percentage of samples (total n=309) with presence of that specific fungal category.
Table 1b. Descriptive statistics for environmental parameters in Taipei in 2015. (N=309)
Variables Mean Median SD Min Max IQR
Temperature (°C) 23.86 24.80 5.38 11.30 32.20 9.50
Td (°C) 19.15 20.80 5.18 5.10 25.40 8.20
RH (%) 75.76 76.00 7.57 51.00 93.00 12.00
WS (m/s) 2.30 2.10 1.20 0.50 9.60 1.80
Rainfall (mm) 7.58 0.00 25.58 0.00 306.70 4.00
Solar radiation (MJ/m2) 12.51 12.80 7.43 0.00 27.81 12.88
CO (ppm) 0.53 0.49 0.17 0.13 1.21 0.22
NO2 (ppb) 19.49 18.90 5.64 2.38 41.38 6.23
O3(ppb) 25.19 25.10 7.80 6.86 55.13 9.38
PM2.5 (μg/ m3) 17.08 14.58 11.26 0.00 68.91 11.14
PM2.5-10 (μg/ m3) 27.61 27.33 7.57 -5.04 57.04 8.12
SO2 (ppb) 2.87 2.66 1.28 1.09 9.88 1.42
SD-standard deviation; Min-minimum; Max-maximum; IQR-inter-quartile range
Table 2 Spearman’s correlation coefficients between the concentrations of major ambient fungal spores and environmental parameters in 2015.
Variables Ascospores Aspergillus/Penicillium Arthrinium Basidiospores Cladosporium Smuts Total spores
Temperature (°C) 0.748*** 0.737*** 0.339*** 0.784*** 0.423*** 0.701*** 0.789***
Td (°C) 0.789*** 0.726*** 0.285*** 0.787*** 0.371*** 0.680*** 0.799***
RH (%) 0.049 -0.183** -0.298*** -0.066 -0.218*** -0.183* -0.068
WS (m/s) -0.483*** -0.429*** -0.320*** -0.523*** -0.493*** -0.411*** -0.554***
Rainfall (mm) 0.142* -0.069 -0.254*** -0.095 -0.273*** -0.133* -0.028
Solar radiation (MJ/m2) 0.430*** 0.506*** 0.338*** 0.529*** 0.462*** 0.488*** 0.534***
CO (ppm) 0.186** 0.135* 0.283*** 0.218*** 0.390*** 0.157** 0.263***
NO2 (ppb) 0.090 0.015 0.145* 0.132* 0.268*** 0.020 0.150**
O3(ppb) -0.251*** -0.189*** -0.175** -0.222*** -0.174** -0.188** -0.259***
PM2.5 (μg/ m3) -0.093 -0.086 0.208*** -0.051 0.330*** 0.053 -0.007
PM2.5-10 (μg/ m3) 0.014 0.201*** 0.242*** 0.137* 0.218*** 0.226*** 0.128*
SO2 (ppb) 0.143* 0.216*** 0.253*** 0.291*** 0.440*** 0.273*** 0.277***
*p<0.05; **P<0.01; ***P<0.001
Note: Temp-temperature ; Td-dew point temperature ; RH-relative humidity ; WS-wind speed ; O3-ozone ; CO-carbon monoxide;SO2-sulfur dioxide;NO2-
nitrogen dioxide
Table 3 Multiple regression for major fungal spores and 0- , 1- and 2-day-lag environmental parameters in 2015.
Fungal categories (log10
spores/m3)
β coeff. (95% C.I.) R2
Total spores
0-day-lag Td*** 0.060 (0.054, 0.067) 0.726 0-day-lag WS*** -0.072 (-0.104, -0.040)
0-day-lag Solar radiation*** 0.007 (0.002, 0.011) 0-day-lag CO*** 0.322 (0.107, 0.538) Ascospores
0-day-lag Td*** 0.068 (0.062, 0.075) 0.680 0-day-lag WS*** -0.088 (-0.115, -0.060)
Aspergillus/Penicillium
0-day-lag Temp*** 0.041 (0.029, 0.054) 0.582 0-day-lag WS*** -0.072 (-0.105, -0.039)
2-day-lag Td*** 0.023 (0.011, 0.036) 0-day-lag PM2.5-10*** 0.009 (0.004, 0.014) Arthrinium
0-day-lag Temp*** 0.024 (0.015, 0.033) 0.309 0-day-lag RH*** -0.022 (-0.029, -0.016)
0-day-lag CO*** 0.916 (0.622, 1.210) 1-day-lag O3*** -0.015 (-0.021, -0.008) Basidiospores
0-day-lag Td*** 0.122 (0.113, 0.131) 0.752 1-day-lag WS*** -0.091 (-0.129, -0.052)
2-day-lag RH*** 0.016 (0.010, 0.021) 0-day-lag NO2*** 0.024 (0.016, 0.032) 0-day-lag O3*** 0.017 (0.011, 0.023) Cladosporium
0-day-lag WS*** -0.154 (-0.194, -0.113) 0.332 0-day-lag Solar radiation*** 0.020 (0.013, 0.026)
0-day-lag PM2.5-10*** 0.012 (0.006, 0.018) Smuts
0-day-lag Temp*** 0.067 (0.059, 0.078) 0.579 0-day-lag WS*** -0.076 (-0.112, -0.040)
2-day-lag Rainfall*** -0.002 (-0.004, -0.001) 0-day-lag PM2.5-10*** 0.011 (0.006, 0.017)
**P<0.01; ***P<0.001
Note: Temp-temperature ; Td-dew point temperature ; RH-relative humidity ; WS-
wind speed ; O3-ozone ; CO-carbon monoxide;SO2-sulfur dioxide;NO2-nitrogen
dioxide
Figure 1. Temporal trend for daily concentration of total spores (spore m-3) in Taipei during 2015.
0 2000 4000 6000 8000 10000 12000 14000 16000 18000 20000
2015/1/8 2015/2/8 2015/3/8 2015/4/8 2015/5/8 2015/6/8 2015/7/8 2015/8/8 2015/9/8 2015/10/8 2015/11/8 2015/12/8 Fungal spores conc. (spore m-3)
Day
Total spores
Figure 1a. Temporal trend for monthly concentration of Ascospores, Aspergillus/Penicillium, Basidiospores, Cladosporium (spore m-3) in Taipei
during 2015.
-1000 0 1000 2000 3000 4000 5000
Fungal spores conc. (spore m-3)
Month
Ascospores
-500 0 500 1000 1500
Fungal spores conc. (spore m-3)
Month
Aspergillus/Penicillium
-1000 0 1000 2000 3000 4000
Fungal spores conc. (spore m-3)
Month
Basidiospores
0 500 1000 1500
Fungal spores conc. (spore m-3)
座標軸標題
Cladosporium
Figure 1b. Temporal trend for monthly concentration of Smuts, Arthrinium, Nigrospora, Periconia (spore m-3) in Taipei during 2015.
-50 0 50 100 150 200
Fungal spores conc. (spore m-3)
Month
Smuts
0 10 20 30 40 50
Fungal spores conc. (spore m-3)
Month
Arthrinium
-10 0 10 20 30 40
Fungal spores conc. (spore m-3)
Month
Nigrospora
0 5 10 15 20 25
Fungal spores conc. (spore m-3)
Month
Periconia
Figure 1c. Temporal trend for monthly concentration of Curvularia, Bortrytis, Torula (spore m-3) in Taipei during 2015.
-5 0 5 10 15 20
Fungal spores conc. (spore m-3)
Month
Curvularia
-20 0 20 40 60
Fungal spores conc. (spore m-3)
Month
Bortrytis
-5 0 5 10 15 20
Fungal spores conc. (spore m-3)
Month
Torula
Figure 2. Monthly averages of meteorological parameters (Temperature, Dew point temperature, Wind speed, Relative humidity) in Taipei
during 2015.
0 10 20 30 40
°C
Month
Temperature
0 10 20 30
°C
Month
Dew point temperature
0 20 40 60 80 100
%
Month
Relative humidity
0 1 2 3 4
m/s
Month
Wind speed
Figure 3. Monthly averages of meteorological parameters (Solar radiation, Rainfall) in Taipei during 2015.
0 10 20 30 40
mm
Month
Rainfall
0 5 10 15 20 25
MJ/m2
Month
Solar radiation
Figure 4. Monthly averages of air pollutants (CO, NO2, O3, SO2, PM2.5, PM2.5-10) in
Taipei during 2015.
0 0.2 0.4 0.6 0.8
ppm
Month
CO
0 10 20 30
ppb
Month
NO2
0 10 20 30 40
ppb
Month
O3
0 2 4
ppb
Month
SO2
0 10 20 30
μg/ m3
Month
PM2.5
0 20 40
μg/ m3
Month
PM2.5-10