行政院國家科學委員會專題研究計畫 成果報告
台美國合計畫─跨領域使用者導向課程的施行與成效─以 情境故事法為設計方法的個案研究(I)
研究成果報告(精簡版)
計 畫 類 別 : 個別型
計 畫 編 號 : NSC 98-2410-H-011-022-
執 行 期 間 : 98 年 08 月 01 日至 99 年 07 月 31 日 執 行 單 位 : 國立臺灣科技大學工商業設計系
計 畫 主 持 人 : 唐玄輝 共 同 主 持 人 : 陳文誌
計畫參與人員: 碩士級-專任助理人員:蔡艾靜 碩士級-專任助理人員:蕭貴霙 學士級-專任助理人員:林岳賢
碩士班研究生-兼任助理人員:林穎謙 碩士班研究生-兼任助理人員:陳正偉
報 告 附 件 : 出席國際會議研究心得報告及發表論文
處 理 方 式 : 本計畫可公開查詢
中 華 民 國 99 年 10 月 29 日
行政院國家科學委員會專題研究計畫 成果報告
台美國合作計劃─跨領域使用者導向課程的施行與成 效─以情境故事法為設計方法的個案研究(I)
計畫類別: 個別型
計畫編號: NSC-98-2410-H-011-022
執行期間: 自民國 98 年 08 月 01 日起至民國 99 年 07 月 31 日 執行單位: 國立台灣科技大學工商業設計系﹝所﹞
計畫主持人:唐玄輝 共同主持人:陳文誌
計畫參與人員:蔡艾靜、蕭貴霙、林穎謙、陳正偉、林岳賢
內容目錄
一、前言與研究目的... 1
二、研究方法... 1
三、研究結果... 2
四、討論與結論... 8
國科會補助專題研究計畫成果報告自評表... 11
處理方式: 本計畫可公開查詢
中 華 民 國 99 年 10 月 20 日
一、前言與研究目的
全球化的趨勢改變了產業與企業的經營模式,自從 70 年代開始,已有許多 的公司相當熱衷於使用團隊合作的工作方式,在現今的工作環境中更是普遍 (Cotton, 1993)。設計教育隨著業界的趨勢而調整,這些調整包括了所操作的設計 主題與方法、工具等。目前,許多的產業已朝向跨領域合作設計的模式運作,但 在學校教育中,卻較少發現跨領域合作的教學方式。因此,跨領域合作可以說是 現今設計教育的重點之一。但在跨領域的團隊中,團隊學員的專業背景不盡相同,
且所使用的「專業語言」也有所不同,要如何拉近各領域學員的認知與想法,成 為跨領域設計課程成功的關鍵之一。 Carroll (2000) 認為情境故事法可以提供一 個較為明確與具體的方式,來描述未來生活中,協助重點分類與概要整理,協助 設計者組織、擷取片段、歸納,並在技術尚未成熟前定義技術的挑戰所在。
本研究目的將情境故事法運用於結合設計與工程背景學生的跨領域合作教 學課程中,藉以了解不同領域的學生在設計過程中所面對的問題,並探討情境故 事法對於跨領域合作設計團隊的影響。育的執行方式與建議。本研究預期透過 1 年的時間完成以下四項主要目標:1.執行跨領域使用者導向課程,並修正此課程 內容與施行方式。2.了解此課程執行對於學生在跨領域、科技應用創新、使用者 導向、設計原型四大方向的成效為何。3.了解透過情境故事法的運用對於學生在 跨領域、應用創新、使用者導向、設計原型四大方向的學習影響為何。4.產生跨 領域使用者導向之課程的執行重點與施行細則。
二、研究方法
本研究利用參與式觀察、問卷及訪談方式,收集相關資料,以探討運用情境 故事法在跨領域合作設計課程上的問題與影響。以下分別介紹實驗課程、參與者 以及資料收集與分析的方法。
2-1 使用者導向創新設計課程
本研究以「使用者導向創新設計」課程,作為研究的主要對象。該課程的主 要目標在於協助學生:1) 學習智慧生活科技重要概念以及應用層面;2) 培養跨 領域知識分享與合作學習的能力;3) 培養設計思考的能力。課程以「智慧生活 科技」為設計主題,共計進行 18 周,分別由不同領域的專家,以不同的面向,
引導學生了解智慧生活科技的基本概念與發展狀況。課程中將不同領域的學生以 混合編組的方式,進行跨領域的合作設計專案。
2-2 參與者
該課程的學生分別來自於台灣科技大學、台北科技大學、台灣大學、台北教 育大學等 4 所學校,學生的主修領域則包含了工業設計、商業設計、數位媒體等 設計領域,以及資訊工程、資訊管理、土木工程、網路媒體、醫學工程等工程領 域的學生。所有參與者以 8 人為一組的方式,共計分成 4 組,共計 32 人,進行
為期 4 個月的設計活動,並於課程前、課程中與課程後等三個不同的階段,分別 進行相關的調查與訪談。
2-3 問卷調查
為了解情境故事法對於跨領域合作的影響,研究分別於學期初、學期中以及 學期末等時段,對參與者進行課程前、中、後等 3 個階段的問卷調查,以了解合 作的狀況,以及學員的認知與態度的變化,同時作為訪談問項的參考依據。以下 分別說明各階段問卷調查的主要項目,以及問卷設計的方式:
第一階段:課程前–調查學員在參與跨領域課程前,對於跨領域合作、情境 故事法、設計與工程領域的認知,以及過去的團隊工作經驗。第二階段:課程中 段–調查的主要內容包含個人角色的定位與認知,以及團隊的運作狀況等。第二 階段的結果並與第一階段調查結果加以比較後,作為訪談問題的依據,以便準確 地擬定訪談的問題。第三階段:課程結束後–針對學員對於跨領域合作的成效,
以及情境故事法的操作等議題,進行調查,並與教學前所作的調查,進行比較分 析。藉以了解設計領域與工程領域學生,在跨領域合作時所面臨的問題,並提出 未來在跨領域合作的發展方向。
三個不同階段的問卷,除了共同的問題外,隨著階段與探討議題的改變,逐 漸增加問題。答題的方法採用李克特量表 (Likert scale) 的 7 級量表方式進行評 估,1 表示非常不同意,7 表示非常同意。
2-4 深度訪談
除了以問卷調查方式取得相關的資料外,為了更深入的了解,學員對於跨領 域合作以及情境故事法的認知與態度,於課程進行至 2/3 時,以深度訪談方式,
對於每一團隊進行訪談。訪談過程中全程錄音,之後並轉成逐字稿。逐字稿中以 隊名及成員編號標示訪談內容,稿中以各團隊隊名的第一個字母作為團隊代號,
分別為 C、I、R、S 等四個字母,成員編號則以數字依照選課名單進行排列,如 C1 代表 C 團隊的 1 號成員。訪談內容共分為跨領域合作、溝通、情境故事、團 隊互動以及課程學習等五大部分。
2-5 資料分析方法
研究所收集的資料,包含問卷與訪談 2 大類。其中問卷的資料,運用 SPSS 統計軟體,進行 T 檢定以及 Scheffe's Test 事後比較,檢視設計與工程兩大領域 對情境故事學習的了解與運用上的變化。訪談的部分,則針對團隊及個人,依據 Paulus (2000)、Nigel & Anita (1995)、Joachim & Petra (2004) 等文獻中的方法與
合作設計所產生的問題,主要可分為溝通、團隊成員及設計過程三大主項,而在 規畫課程時,即希望情境故事法能為跨領域團隊合作帶來良好的成效,而透過深 度訪談,確實也發現情境故事法在溝通、學習及學員方面,產生認同和良好影響。
3-1 跨領域合作設計問題
透過訪談研究發現,跨領域合作設計所產生的問題,透過深度訪談之後,得 到異質性背景、溝通、領導者、人員組成、如何形成有共識的目標、概念的分析 與評估等 6 項主因,以下為各項問題之詳述。
3-1.1 異質背景與溝通問題
在研究觀察中發現,各團隊在合作時,不同專業的成員間都有一個共同的疑 問:「你們到底會什麼?」。由於對另一個專業領域的不了解與認知上的差異,形 成了整個團隊運作中最大的阻礙。從訪談中發現,不同的學習背景,是造成各領 域在思考上與特質上產生差異的主因。這些差異最直接的影響,就是形成團隊內 部的溝通問題。例如根據本次課程觀察發現,工程領域的成員對於問題的思考較 具深度,他們大都會提出:你該怎麼做、你可以怎麼做等的言論。但設計領域的 成員則是以較具廣度的方式思考事物,針對產物創意有所發展。參與的成員提出 以下描述:
可能科技的比較實際一點,然後設計的比較虛幻一點。我們設計講一個概念出來,
他們可能馬上就說那可能是直流電或交流電,他們會跟我們講,但我們會跟他講,
我們看過什麼未來的東西,跟他們溝通。他們一開始都覺得很唬爛 (I5)。
要達到有效的分享,以建立共識,並提高合作的效益,須要有良好的溝通 (Paulus, 2000)。跨領域的溝通中,除了一般性的語言使用技巧外,專業語言的使 用是另一個重要的因素。由於工程與設計領域都各自擁有不同的專業術語,要如 何以對方聽得懂的方式來陳述、說明想法與概念,便成為有效溝通的重要的因素 之一。
3-1.2 人員組成比例與領導者
在一開始的研究觀察中,並未發現成員領域的比例,對於跨領域設計團隊造 成影響,但在訪談中發現,成長背景的配置會對於團隊的影響,其實從學期初就 開始發生。雖然團員們了解此次任務的主要目標對象是人,但在專案過程中,討 論的議題始終圍繞在技術的問題上,不斷地循環。多數團員認為,這種現象是由 於人員比例分配不均所造成的結果。導致部分領域成員在意見的表達及團隊決策 過程中,處於弱勢,甚至使整個團隊目標偏移。成員說出了其中的原因:
票不等價,每個人發表的意見沒有那麼的等值的,他的力量不是相等的 (R1)。
團隊的領導者對於團隊的成效也扮演著重要的角色 (Parker, 1996),本研究 中,四個團隊的領導者,都是以自然產生的方式選出。其領導風格及專業背景,
都會產生影響。觀察中發現,當領導者較為強勢時,團隊較容易受領導者的專業 領域影響,這些影響除了思考模式外,也會影響到整個團隊的走向。領導者不該
是個扮演最後決定權的決定者,而是一個較為中立的協調者,協調團隊內部的運 作與溝通,並組織規劃團隊的任務流程。但個案中某些小隊因為其領導者的強勢 作風,在過程中產生不少的爭執。
3-1.3 共識的形成與概念分析和評估
在團隊對於問題及目標,取得普遍的了解及認知之前,由於缺乏共同的目標,
會使團隊陷入尋找目標及確認目標的迴圈之中。另外,也有成員提到進度的問題,
在進一步了解後發現,這種現象多半是因為團隊無法取得共識,陷入進退兩難時 所造成。而情境故事法中的腦力激盪法,能在短時間內快速累積大量的概念與想 法,各團隊在取得這些概念後,必須要決定哪些概念該被留下,或者必須淘汰。
所有的團隊都使用多數決的方式進行概念的篩選,而其中僅有 C 團隊會針對所 提出的概念,先進行分析與分享後,再進入所謂的評估階段,也就是決定階段,
其餘三個團隊,則先對所提出的概念進行評估、篩選後,才進入分析階段。
由於 C 團隊討論過程中,對於團隊中所提出的所有想法,都會進行分析與 思考,此種方式使團隊耗費大量的時間,進行分享與溝通,成員甚至表示,這種 處理方式似乎較無效率可言。部分團隊在重新分析評估先前所刪除的概念時發現,
許多被淘汰的想法,其實是有存在的價值,因而又不斷回頭檢視先前所提出的概 念,以至於在評估與分析概念的階段中,不斷的循環。因此,有成員認為,與其 在評估與分析概念中不斷的循環,不如先完整分析所有概念後,再決定是否取 用。
3-2 情境故事法的運用
本節將討論情境故事法在跨領域團隊中的運用成效,以及執行情境故事法所 產生的問題。
3-2.1 情境故事的運用成效
研究在規畫課程時,即希望情境故事法能為跨領域團隊合作帶來良好的成效,
而透過深度訪談,確實也發現情境故事法在溝通、學習及學員方面,產生認同和 良好影響,以下為情境故事法的運用成效之詳細敘述。
1.溝通方面
情境故事法在課程中的角色,就如同現實生活中的共通國際語言「英文」一 樣,讓使用各種不同語言為母語的族群,可以透過一個共通的國際語言進行溝通。
此論點也可以從學員們在問卷調查中的反應找到證據。表 3-1 為課程中,針對學 員們對於情境故事法的了解,所進行的三次問卷調查結果統計,經 Scheffe's Test
有關情境故事法在跨領域合作設計課程中的影響,從參與者的主觀問調查結 果來看,對於提升團隊創新與創造力,以及強化使用者導向概念的發展等項目的 了解與認知,隨著課程的進行,都有所提升,如表 3-1 所示。
表 3-1 對情境故事法的了解變異數分析表
變異數 學期初 [A]
(n=38)
學期中 [B]
(n=33)
學期末 [C]
(n=32 ) 單變量檢定
Scheffe's Test 平均數 標準差 平均數 標準差 平均數 標準差 F 值 p 值
了解情境故事法與其目的 3.868 1.562 5.666 0.595 5.625 0.609 33.494 0.000 [A] < [B]、[C]
情境故事法可協助跨領域團隊溝通 5.157 1.053 5.545 0.832 6.125 0.659 10.630 0.000 [A] < [B] < [C]
情境故事法可以提昇團隊的創新能力 5.131 0.963 5.484 1.003 5.625 0.870 2.550 0.083 情境故事法可以強化團隊使用者導向
的概念 5.105 1.133 5.878 0.649 6.125 0.707 13.175 0.000 [A] < [B]、[C]
情境故事法可提高團隊創造力 5.078 1.075 5.181 1.073 5.500 1.163 1.340 0.267
* p < 0.05
設計與工程領域學員,對於情境故事法的了解,並無顯著的差異。表 3-2、
3-3 與表 3-4 為針對設計與工程領域學員,三個不同階段的問卷結果所做的比較 分析。從這些表中的數據顯示,設計與工程領的學員,在學期初、學期中與學期 末等 3 個階段,對於情境故事法的了解與態度,並無顯著的差異。但仔細的分析 其平均數的變化,發現工程領域的學員,在初期時對於情境故事法的認同低於設 計領域,但在期中之後,對於情境故事法的理解與認同度,高過於設計領域的學 員。
表 3-2 學期初-對情境故事法的了解調查 T 檢定分析表
變異數 設計領域 (n=12) 工程領域程(n=26) T 檢定
平均數(M) 標準差 平均數(M) 標準差 T 檢定值 p 值 (雙尾) 了解情境故事法與其目的 4.416 1.083 3.615 1.698 1.494 0.144 情境故事法可協助跨領域團隊溝通 5.250 1.055 5.115 1.070 0.362 0.720 情境故事法可以提昇團隊的創新能力 5.416 0.792 5.000 1.019 1.249 0.220 情境故事法可以強化團隊使用者導向的概念 5.500 1.000 4.923 1.163 1.481 0.147 情境故事法可提高團隊創造力 5.416 .792 4.923 1.163 1.329 0.192
* p < 0.05
表 3-3 學期中-對情境故事法的了解調查 T 檢定分析表
變異數 設計領域 (n=11) 工程領域 程(n=22) T 檢定
平均數(M) 標準差 平均數(M) 標準差 T 檢定值 p 值 (雙尾) 了解情境故事法與其目的 5.545 0.522 5.727 0.631 -0.823 0.417 情境故事法可協助跨領域團隊溝通 5.272 0.904 5.681 0.779 -1.347 0.188 情境故事法可以提昇團隊的創新能力 5.272 0.904 5.590 1.053 -0.855 0.399 情境故事法可以強化團隊使用者導向的概念 5.818 0.750 5.909 0.610 -0.374 0.711 情境故事法可提高團隊創造力 5.272 1.272 5.136 0.990 0.339 0.737
* p < 0.05
表 3-4 學期末-對情境故事法的了解調查 T 檢定分析表
變異數 設計領域(n=11) 工程領域程(n=21) T 檢定
平均數(M) 標準差 平均數(M) 標準差 T 檢定值 p 值 (雙尾) 了解情境故事法與其目的 5.454 0.687 5.714 0.560 -1.152 0.258
情境故事法可協助跨領域團隊溝通 5.909 0.700 6.238 0.624 -1.358 0.185 情境故事法可以提昇團隊的創新能
力 6.000 0.774 5.428 0.870 1.829 0.077 情境故事法可以強化團隊使用者導向
的概念 6.090 0.539 6.142 0.792 -0.194 0.847 情境故事法可提高團隊創造力 5.090 1.136 5.714 1.146 -1.465 0.153
* p < 0.05
3.團隊成員方面
情境故事法之所以可以達到溝通的目的,另一個因素為「同理心」,也就是 透過「使用者」這個共同的話題。多數學員在訪談中都提到這項特性,在多數人 都有相關經驗的情況下,許多話題或生活經驗可以快速地引起共鳴。情境故事法 不只在語言與目標上,對於跨領域團隊有所幫助,其發散思考的特性,也可有效 去除各專業領域的本位主義,對於刺激團隊進行發散性的思考,具有正面的成效。
有學員提到:
情境故事法擴大思考,我們從社會、經濟、科技,有時我們是從社會發現問題,
但從經濟、科技各方面思考,會讓這個東西更完整,它是一種擴散思考 (C1)。
情境故事法運用於跨領域團隊,不只是作為共同的語言與產出共同的目標,
甚至可用來檢視整個設計流程,以及檢視產品的合理性。當團隊可以明確的透過 情境,描述產品的功能與使用過程時,則表示概念趨近於成熟,反之,則如同學 員們所描述的狀況,產品定義可能有所缺失。
3-2.2 執行情境故事法所產生的問題
前面的描述中發現,情境故事法雖然為溝通、設計學習及團隊成員帶來良好 成效,但是在執行上,仍會因人事時地物等因素,在過程中產生一些疑慮或問題,
以下為學員在訪談過程中所指出有關執行方面的問題。
1.使用者定義不清
研究中發現,設計領域成員在情境的運用上,往往只到發想階段,也就是預 想情境的部分就停止了,而課程中的四個團隊,在運用上也呈現相同的狀況,這 種現象,不只讓團隊所發展的情境與產品功能流於虛幻空談,未經驗證的概念構 想,甚至直接影響到整個團隊的目標。問卷調查中針對了解情境故事法與其目的 的調查結果,經 Scheffe's Test 比較後發現,學期初到學期中都有明顯的提升 (學 期初 [A] < 學期中 [B]、學期末 [C] ),但學期中至學期末則未再有在明顯地增 加。經由訪談後發現,各團隊對於情境故事法的運用,都停留在預想情境的階段,
有說出來,而且我們幾乎不作使用者觀察,我覺得這也是問題啦 (R8)。
課程的設定,是希望設計領域的學員帶領整個團隊進行情境故事的活動,如 同設計學員所言,情境在產品設計的學習過程中,是不可或缺的一部分。因此,
課程安排上並沒有特別強調或忽視任何一個環節與流程。但研究結果發現,設計 領域的學員對於情境故事的了解,僅限於預想宏觀情境、預想微觀情境,也就是 說設計領域學員與其他學員,對於情境故事法的認知,都僅限於假設性的描述之 中,並沒有進入所謂的觀察情境,也就是使用者觀察階段。因此,設計領域的學 員無法成功地帶領整個團隊,進行情境故事的活動。由此可見,所謂的以使用者 為中心的概念,並非是理論的探討,而是需要身體力行的法則。沒有實際的進入 使用者的活動,體會其細節,就無法真正發揮情境故事法的功用。
2.實際觀察不足
明確的團隊目標,可以提升團隊運作的成效及效率,相反的,則會阻礙團隊 運作的過程。情境可作為跨領域團隊的共通語言,「使用者」是跨領域團隊的共 同目標,使用者觀察則是強化情境與確立使用者的重要過程,因此,情境故事法 中的使用者定義,對於跨領域團隊具有相當直接的影響。
案例中的 R 團隊,曾在使用者定義上,以上班族女性為主要的設計對象。
雖然他們已對使用者做出定義,但在發展產品形式以及功能的過程中,卻不斷發 生問題,使團隊在使用者與產品形式上,不斷地重覆思考,而且無法找出適當的 解決方案,這種狀況也發生在 C 團隊上。而 I 團隊與 S 團隊則將使用者定義在「全 民」,這種廣義的定義方式,更無法幫助設計過程的推進。主要原因是其忽略了 目標族群中,還有許多細項必須加以定義,如:年齡、工作、經濟狀況等。因此,
在沒有進行觀察,即開始進行產品功能定義的情況下,往往造成所有假設都可能 發生的現象,此種狀況無形中浪費了團隊許多的資源。 最後變成學員們各說各 話:
我們會認為情境就自己想像,去符合使用者就好了 (只到預想情境階段) (R2)。
3.課程時間安排不夠完善
以產品設計來說,使用者是決定產品方向的一項重要指標 (Vredenburg, Mao, Smith, & Carey, 2002),即使運用了情境故事法,但缺乏對使用者的真實了解,還 是會產生問題。從研究訪談及觀察發現,各團隊在初期產生大量概念後,即開始 思考,要如何呈現概念,甚至是直接討論相關技術可行性。至於產品要給誰用?
則出現需多虛幻且籠統的使用者,給所有人、全民、給所有上班族,對於使用者 的定義卻停留在預想情境的階段。成員說出了其中的原因:
我們會認為情境就自己想像,去符合使用者就好了 (R2)。
研究中發現,當產品所觸及的使用者越廣大,使用定義就更加不容易,而大 部分的團隊在定義使用者時,往往只做全面性的定義,如上班族、老人、小孩等,
忽略了這些族群只是族群的統稱,像是老人也有性別、年齡的分別、身體狀況的 差異等因素,這些都是案例中團隊未注意的項目。在研究觀察中,發現了導致這 種現象的幾個原因:1) 設計領域與技術領域的成員人數不平衡;2) 時間壓力;
3) 在課程中未特別指示,甚至說明使用者定義的相關訊息;4) 沒有做實際的觀 察。
上述四個原因中,以沒有進行實際觀察,所造成的影響最大,是造成使用者 定義不清的最主要原因。事實上,觀察不只是情境故事重要的關鍵,對於整個產 品設計也是相當重要的一環。而這觀察的工作並不單是設計領域成員的責任,而 是需要整個團隊共同參與。設計者在進行設計活動時,往往以創造者的角度進行 思考,而忽略了誰才是真的使用者。其實設計者自己也可以是個使用者,甚至是 親身參與體驗,如此才能設身處地的以同理心來思考使用者的需求,以及所面臨 的問題。許多受訪者認為親身體驗是有機會增強產品可行性的方式,他們表示:
觀察有點像在反映自己,有的是觀察自己有的是觀察家人的生活 (I1)。
本研究引用情境故事法完善的教學流程而規劃課程,如圖 3-1,但是礙於學 校課程時間之限制,導致情境故事法中相當重要的使用者調查,明顯地被忽視,
此為本研究課程規劃上缺失,但也因此發現,在往後相關課程編排時,可成為前 車之鑑,避免再次產生這樣的問題。
圖 3-1 本研究情境故事教學流程
四、討論與結論
的個人溝通意願及技巧不佳,則溝通更為困難。
而情境故事法是有順序的敘述型式,對活動作有形描述的設計方法。運用此方法,團隊可以 自由地表達自己的想法及概念,有效地彙整各不同的觀點,同時從不同的觀點進行切入。例如 SET 分析,配合跨領域團隊專業領域異質性的特質,可在短時間內獲得大量且多面向的概念,並 歸納整合成共同的目標。因此,情境故事法可有效的銜接各種不同專業領域,在溝通與思考模式 上的銜接,其最主要的原因在於情境著重於生活,也就是體驗,這些事物在每個人的生活中都有 機會接觸到、看到,甚至是自身的經驗,達到 Nigel & Anita(1995)所提出的六項關鍵,因此,很 容易在團隊間形成共鳴,並在短時間內去除各領域的本位主義,讓工程不再只是生硬的技術理論;
設計不再是虛無飄渺的虛構想像。
4-2 情境故事法對於團隊成員的問題與成效
本研究中,發現團隊的領導者及團隊成員的專業比例,對於團隊的決策有很大的影響。從觀 察中發現,當領導者較為強勢時,團隊較容易受領導者的專業領域影響,包含思考模式,進而影 響到整個團隊的走向。而團隊成員的專業比例不均,例如,工程人員偏多時,較易在技術的議題 上不斷反覆的討論,內容也經常侷限在技術的運用及可行性等議題,導致部分領域成員在意見表 達及團隊決策過程中處於弱勢,甚至使整個團隊目標偏移,長時間下來,讓少數領域成員開始處 於被動或弱勢的情況,變成與 Paulus(2000)所提的降低團隊創造力的因素相符。另外,情境故事 法雖然是結合情境描述及視覺化溝通的溝通方式,但以研究案例來說,視覺化的溝通顯得相當薄 弱,主要的溝通方式都集中使用敘述性的情境描述。這也是受到人員配置的影響,當特定領域人 員比例多過另一領域時,溝通模式就會受到影響,例如,當設計人員比例太低或專業能力有所缺 失時,很難引導團隊運用情境進行視覺化溝通與描述,這樣的情況將減少情境故事法之成效。
但這樣的問題,可以經由情境故事的敘述上得到補強。如同文獻所提到,情境故事法是在產 品設計與開發的過程中,透過一個想像的故事,從使用者的角度,來發掘產品的構想;並透過使 用情境的模擬,探討、分析人與產品之間的互動關係。因此,使用者在跨領域的團隊中,是共同 的焦點與目標,而情境故事法的運作流程,事實上就是以使用者為中心。在概念發想過程階段,
團隊成員不需滲入大量的專業知識,只須將個人的生活及體驗,於討論過程中加以分享與討論。
由於這些事物源自於每個人的生活與自身經驗,因此很容易在團隊間形成共鳴,並在短時間內去 除各領域的本位主義,降低團隊中專業人員比例不均之意見分歧,和多數決而偏向某領域所產生 的問題,使得原本會降低團隊創造力之變因,成為提升團隊創造力之因素。如同參與成員所說:
「情境故事法提供領域一個思考的軸心在那,雖然大家不同領域,對於情境、對於故事 OK 一定
可以理解它是甚麼東西,所以說正常情況下,當不知道發生什麼是不知道怎麼辦的時候,大家圍 起來看這個點看這故事怎麼走,這樣比較不容易離題。」
4-3 情境故事法對於設計過程的成效與問題
如前面所述,情境的描述能有效拉近設計與工程領域溝通上的差異,提供一個共通的「語言」,
「以使用者為中心」可建立跨領域團隊的共同目標,而「使用者觀察」則是連結情境與使用者的 要素。「觀察」是此過程相當重要的一環,使用者觀察可避免各領域成員,以個人認知或想像產 生虛構的情境,影響團隊目標的訂定。根據研究統計的結果發現,不論工程或是設計領域成員,
都認同情境故事法可以強化團隊的使用者導向概念,並增加團隊創造力,有效提高產品的成熟
度。
相對的,如果情境故事法運用不當,則會成為跨領域團隊的阻礙。研究中發現,課程初期,
若不同專業領域的成員無法對問題與目標達成共識時,會使團隊耗費大量的時間進行概念的分享 與溝通。不良的溝通,讓部分的團隊未能在專案初期,進行正確的決策,導致後期的估與分析階 段,不斷地回頭檢視先前被放棄的概念,影響了設計的進行。另一方面,在團隊無法提出討論議 題,或者成員無法提出相關議題的反證或論點時,「默許」成為了大多數隊員的選擇。但也常因 此產生了將錯就錯的情況,而讓團隊陷入困境,最後不得已,只好回頭重新檢視設計議題。這些 問題都是因為團隊對於使用者定易不清,或者觀察不確實所導致。
本研究探討跨領域合作設計課程的相關問題,以及情境故事法對於此類型課程的效益與影響。
研究中以實際施行的課程,進行實地的觀察,並透過階段性的問卷調查,以及深度訪談等方式,
收集參與者的意見與經驗。綜合有的資料,發現跨領域合作設計課程,存在著因異質背景所產生 的溝通問題,人員組成比例與領導者,以及共識的形成與概念的分析和評估等問題。其中,除了 人員組成比例與領導者的問題是屬於組織結構的問題外,其餘的問題都與溝通有關。而溝通的主 要問題,則是因成員的異質性所產生的思考方式差異,以及無法互相理解的專業術語。研究中也 發現,情境故事法所使用的各種情境,可以有效地作為不同專業領域成員溝通時的共同語言。透 過情境,不同專業屬性的成員們,可以將設計的焦點集中在使用者,進行產品各項功能與使用的 情境分析與討論,同時以相關的生活經驗,作為溝通的基礎。
情境故事法在跨領域合作設計課程中,對於溝通、設計的學習,以及團隊成員的共識與思考 方面,都有正面的影響。情境故事法讓不同專業領域的成員,可以藉由情境作為溝通的媒介,其 至是成為一種跨領域溝通的「語言」。參與的成員們認為,此種方法對於提升團隊創新與創造力,
以及強化使用者導向概念發展等項目,都有所助益。經由情境所帶來的「同理心」,也讓團隊的 成員產生共識,可以快速的建立共同目標。雖然研究中發現,情境故事法對跨領域合作設計課程 的執行,具有上述的一些優點,但也同時發現一些執行上的問題,像是使用者的定義不清、實際 觀察不足,以及課程時間安排不夠完善等。使用者的定義在情境故事中,是很重要且基礎的項目,
但研究中發現,部分團隊並未確實的定義目標使用者,許多有關使用者的描述,都只是團隊成員 的想像,並未經由實際的觀察,確認使用者的各種屬性與需求,導致無法正確地評估所提出的設 計概念。另外,回顧整個課程的規畫與執行過程,發現課程進度與活動,忽略了使用者調查的項 目,也因此造成學員們多是以推論、想像的方式設定使用對象。
從本研究結果觀察,隨著產業與社會的改變,設計教育也需要調整。本研究以實證的方法,
進行實驗課程,探討跨領域合作設計課程,以及情境故事法的施行問題與影響。期望研究中所發 現的各項問題,以及情事法所帶來的影響,可以作為未來相關研究與教學時的參考與應用。
國科會補助專題研究計畫成果報告自評表
1. 請就研究內容與原計畫相符程度、達成預期目標情況作一綜合評估
█達成目標
□ 未達成目標(請說明,以 100 字為限)
□ 實驗失敗
□ 因故實驗中斷
□ 其他原因 說明:
最終成果包含:1.實際執行兩次跨領域使用者導向課程,建立課程結構與執行重點,透過問 卷與訪談結果,提出跨領域設計教育的建議,為設計業界培養跨領域人才。2.透過質性與量 化分析,了解跨領域課程執行,對於學生在跨領域、科技應用創新、使用者導向、設計原型 四個能力的影響與變化,發表設計教育研究成果。3. 了解將情境故事法對於跨領域的幫助與 影響,提供設計實務運用此法時的參考。
2. 研究成果在學術期刊發表或申請專利等情形:
論文:█已發表 □未發表之文稿 □撰寫中 □無 專利:□已獲得 □申請中 □無
技轉:□已技轉 □洽談中 □無 其他:
林穎謙、唐玄輝,民 98,情境故事法對於跨領域合作設計課程之影響。工業設計雜誌,第 37 卷,第 2 期,121 號,204-210 頁。
唐玄輝、林穎謙,民 99,情境故事法運用於跨領域合作設計課程的問題與影響。設計學 報。(審查中)3. 請依學術成就、技術創新、社會影響等方面,評估研究成果之學術或應用價 值(簡要敘述成果所代表之意義、價值、影響或進一步發展之可能性)(以 500 字為限)
從本研究因應全球化的經營模式與競爭,發現跨領域合作已逐漸取代傳統的個人運作模 式。跨領域團隊擁有許多同質性團隊所沒有的先天優勢,但也必須面對因異質性所產生的問 題。本研究運用具有「使用者為中心」理念與視覺化溝通特性的情境故事法,進行跨領域的 合作設計教學,藉此了解跨領域合作設計課程的問題,並探討情境故事法對於跨領域合作設 計團隊的影響。問卷調查與訪談發現,跨領域團隊運作過程的問題包含,因成員異質背景所 產生的溝通問題,成員的專業比例、領導和共識的形成、與概念評估等四項。而情境故事法 則可以作為溝通的媒介,有效地幫助跨領域的設計團隊,進行設計思考與概念上的溝通,並 可有效地協助工程領域的學員,順利進入設計運作流程。另外,執行情境故事法最重要的部 分是確實地定義使用者,經由實際的使用者觀察,確認相關的定義與需求。
本研究成果可以作為情境故事法教學時的參考,藉以提升設計教育的品質,為設計教育 盡一分心力,具有設計教育研究上的重要性。本研究對於情境故事法的應用,將為設計實務 提供設計方法上的技術創新,因此對於實務與學術都有一定的價值。
國科會補助專題研究計畫項下 出席國際學術會議心得報告
日期:2010 年 10 月 26 日
一、參加會議經過
兩年一次的設計運算與認知研討會是設計研究中最重要的研討 會之一,結合了設計研究、電腦運算、認知心理等三大領域,為跨 領域的研討會。感謝國科會的補助,本人從第一屆設計運算與認知 研討會開始參加,至今已是第四屆。本次參加前即被邀請作為研討 會的 Vice-Chairs,除負責推廣此研討會外,還是文章審查委員、及 最佳海報的評審委員,Vice-Chairs 的資料如下圖所示。
計畫編號: NSC-98-2410-H-011-022
計畫名稱: 跨領域使用者導向課程的施行與成效─以情境故事法為設計方法的個案研究 出國人員姓名: 唐玄輝
服務機構及職稱: 台灣科技大學工商業設計系 會議時間: 99 年 7 月 10 日至 99 年 7 月 14 日 會議地點: 德國斯圖加特
會議名稱: (中文) 2010 設計運算與認知研討會
(英文) Design Computing & Cognition 2010
發表論文題目: (中文) 測量產業團隊腦力激盪時設計活動的改變
(英文) Measuring cognitive design activity changes during an industry team brainstorming session
研討會前兩天為工作坊,作主題式的研究分享,共有八個工作 坊如下。
Workshop 1: Assessing the Impact of Complexity Science in Design
Workshop 2: Design Communication
Gap between Abstract Requirements and Concrete Implementation Strategies
Workshop 6:
Design CreativityWorkshop 7: Shape Grammar Implementation: From Theory to
Useable SoftwareWorkshop 8: Research Methods for Design Cognition
本人也與 Jeff Kan 共同籌備了一個工作坊,討論設計認知的研
究方法,會中熱烈討論設計認知的未來與研究方向。並與設計認知
領域的學者交換研究心得,及籌劃國際合作的可能性。工作坊內容
如下圖所示。
工作坊後,為三天的研討會,會中有海報發表與論文發表,過
程中本人除參與他人的發表外,還與他人討論自己的文章。本研討
二、與會心得
以下是會議文章的列表,近 30 篇,可以發現亞洲區的文章十分 稀少,台灣與大陸各有一篇,日本有三篇。
Paper Title List of Authors Country
Imaging the designing brain: A neurocognitive exploration of design thinking
Katerina Alexiou, Theodore
Zamenopoulos and Sam Gilbert UK Different function breakdowns for one existing product:
Experimental results
Thomas Alink, Claudia Eckert,
Ruckpaul Anne and Albert Albers Germany, UK Enabling creativity through innovation challenges: The
case of interactive lighting
Stefania Bandini and Giuseppe
Vizzari Italy
A computational design system with cognitive features based on multi-objective evolutionary search with fuzzy information processing
Michael Bittermann Netherlands
Narrative bridging Katarina Borg Gyllenback and
Magnus Boman Sweden
The curse of creativity David Brown USA
Beyond the design perspective of Gero's FBS framework
Gaetano Cascini, Luca Del Frate, Gualtiero Fantoni and Francesca Montagna
Italy, Netherlands
A general knowledge-based framework for conceptual design of multi-disciplinary systems
Yong Chen, Ze-Lin Liu and You-Bai
Xie China
Facetwise decomposition of modelling activities in the algorithm for inventive problem solving ARIZ and in evolutionary algorithms
Céline Conrardy, Roland De Guio
and Bruno Zuber France
Learning concepts and language for a baby designer Madan Mohan Dabbeeru and
Amitabha Mukerjee India
An anthropo-based standpoint on mediating objects:
Evolution and extension of industrial design practices
Catherine Elsen, Françoise Darses and Pierre Leclercq
Belgium, France Exploring multiple solutions and multiple analogies to
support innovative design Apeksha Gadwal and Julie Linsey USA
Formal model of computer-aided visual design Ewa Grabska and Grazyna
Slusarczyk Poland
Design agents and the need for high-dimensional
perception Sean Hanna UK
Associative spatial networks in architectural design - Artificial cognition of space using neural networks with spectral graph theory
John Harding and Christian Derix UK
Creative and inventive design support system:
Systematic approach and evaluation using quality engineering
Hiroshi Hasegawa, Yuki Sonoda,
Mika Tsukamoto and Yusuke Sato Japan
Studying the unthinkable designer Ann Heylighen Belgium
Interactive, visual 3D spatial grammars Frank Hoisl and Kristina Shea Germany Approximate enclosed space using virtual agent Aswin Indraprastha and Michihiko
Shinozaki Japan
Interactions between brand identity and shape rules Rosidah Jaafar, Alison McKay, Alan de Pennington and Hau Hing Chau UK Measuring cognitive design activity changes during an Jeff Kan, John Gero and Hsien-Hui Malaysia,
industry team brainstorming session Tang USA, Taiwan A framework for constructive design rationale Udo Kannengiesser and John Gero Australia,
USA A case study of script-based techniques in urban planningAnastasia Koltsova and Gerhard
Schmitt Switzerland
Organizing a design space of disparate component topologies
Mukund Kumar and Matthew
Campbell USA
Scaling up: From individual design to collaborative design to collective design
Mary Lou Maher, Mercedes Paulini and Paul Murty
USA, Australia Comparing stochastic design decision belief models:
Pointwise versus interval probabilities Peter Matthews UK
A computational concept generation technique for
biologically inspired engineering design Jacquelyn Nagel and Robert Stone USA
Complex product form generation in industrial design: A Voronoi diagram based bookshelf
Axel Nordin, Damien Motte, Andreas Hopf, Robert Bjärnemo and Claus-Christian Eckhardt
Sweden
Building better design teams: Enhancing group affinity to
aid collaborative design Michael Oren and Stephen Gilbert USA
Line and plane to solid: Analyzing their use in design
practice through shape rules Gareth Paterson and Chris Earl UK The redefinition of the paradox of choice Michal Piasecki and Sean Hanna UK A graph grammar based scheme for generating and
evaluating planar mechanisms
Pradeep Radhakrishnan and
Matthew Campbell USA
Rethinking automated layout design: Developing a creative evolutionary design method for the layout problems in architecture and urban design
Sven Schneider, Jan Ruben Fischer, Reinhard König and Frank Petzold
Germany
Applying clustering techniques to retrieve housing units from a repository
Alvaro Sicilia, Leandro Madrazo
and Mar Gonzalez Franco Spain A comparison of cognitive heuristics use between
engineers and industrial designers
Seda Yilmaz, Shanna Daly, Colleen Seifert and Richard Gonzalez USA Cognitive heuristics in design: Instructional strategies in
idea generation
Seda Yilmaz, Colleen Seifert and
Richard Gonzalez USA
Generic non-technical procedures in design problem solving: Is there any benefit to the clarification of task requirements?
Constance Winkelmann and
Winfried Hacker Germany
Virtual impression networks for capturing deep impressions
Eiko Yamamoto, Mohd Yusof Nor Fasiha, Toshiharu Taura and Yukari Nagai
Japan
大多數的文章來自於歐美,這顯示亞洲區設計研究的不普及。
值得思考的是,台灣這幾年企圖以設計力與創造力重建台灣的經濟
應該鼓勵設計思考與認知相關研究,透過以人為主的觀念,除
提昇研究水準外,也增進台灣設計潛力。這幾年中國大陸在設計領
域急起直追,但是台灣得設計產業及學術界,是少數目前比中國大
陸還先進的領域之一,如能更積極地推動設計相關學術的發展,這
對於台灣的設計科學研究將有很大的助益。
Measuring Cognitive Design Activity Changes During an Industry Team Brainstorming Session
Jeff WT Kan
Taylor's University College, Malaysia
Krasnow Institute for Advanced Study, Fairfax, USA
John S Gero
Krasnow Institute for Advanced Study, Fairfax, USA
Hsien-Hui Tang
National Taiwan University of Science and Technology, Taipei, Taiwan
This paper presents the results of using an ontologically-based method of measuring cognitive design issues and design processes on an in-situ team brainstorming session to study the changes in cognitive design issues and design processes at the beginning, middle and end of the session. Detailed results of the distributions of issues and processes are presented.
Introduction
This paper uses an ontological view of understanding design cognition.
The ontological view consists of issues and processes. It is assumed that designers use different cognitive resources for different design issues and different design processes, and that they use different cognitive resources to handle the states before and after any design processes. This ontological view is used to analyse a protocol of a design session of a team of design- ers from industry brainstorming.
J. Kan, J.S. Gero and H-H. Tang 2
Quantifying Design Processes
In order to establish a common ground to study design activities, an estab- lished ontology from the literature is used as an overarching principle to guide the protocol study.
The FBS Ontology
The research commenced with the following statement about designing:
“The meta-goal of design is to transform requirements, more generally termed functions which embody the expectations of the purposes of the resulting artefact, into design descriptions. The result of the activity of designing is a design description.” [1]
This view centers design around the creation of artefacts, whether phys- ical or virtual. Anything that is not related to the resulting artefacts is not considered within this framework. For example, supporting activities such as planning and scheduling are not included. People can spend all their time planning and scheduling without producing any design description.
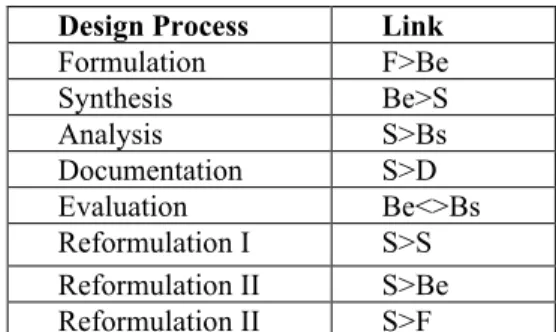
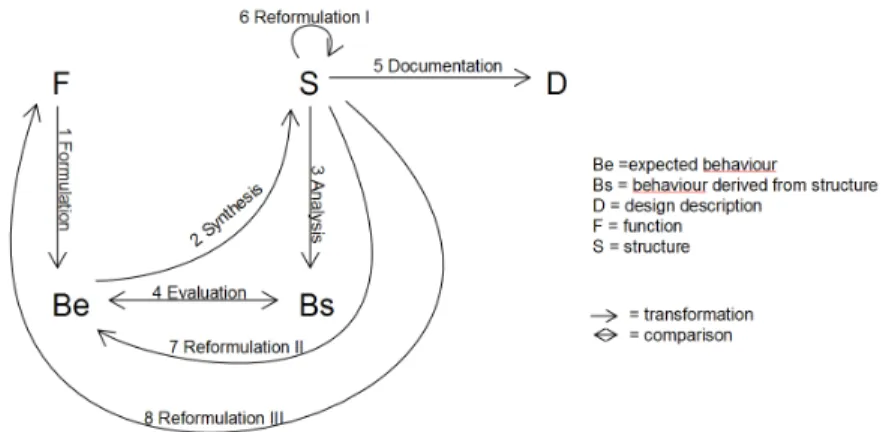
The FBS design ontology [1], as a formal model, models designing in terms of three fundamental classes of issues: function, behavior, and struc- ture; along with two external classes: design descriptions and require- ments. In this view the goal of designing is to transform a set of functions into a set of design descriptions. The function (F) of a designed object is defined as its teleology; the behavior (B) of that object is either its ex- pected behavior (Be) or behavior derived from the structure (Bs), where structure (S) are the elements and their relationships that go to make up the artefact. A design description cannot be transformed directly from the functions, which undergo a series of processes among the FBS issues. Fig- ure 1 shows the relationship among these issues with the resulting proc- esses that link the issues.
Formulation (FBe) is the transformation of the function issues of a design into issues of expected behavior. Synthesis (BeS), is the trans- formation of the expected behavior issues (Be) into structure issues of the artefact that aim to satisfy the requirements. Analysis (SBs) is the deri- vation of “actual” behavior issues from the synthesized structure (S). Eval- uation (BsBe), is the comparison of the actual behavior (Bs) with the expected behavior (Be) to decide whether the artifact is to be accepted.
Documentation (SD), is the production of any design description from structure issues of the designed artefact.
Traditional models of designing reiterate the analysis -synthesis - evalu- ation processes until a satisfactory design is produced. In the FBS ontolo-
3
Measuring Cognitive Design Activity Changes 3
ontology, Figure 1, three types of reformulations is introduced to expand the design state space so as to capture the innovative and creative aspect of designing, which have not been well articulated in most models because they have not been adequately understood.
Fig. 1 The FBS ontology of designing
Reformulation type I (SS’), addresses changes in the design state space in terms of structure issues. Reformulation type II (SBe’), ad- dresses changes in design state space in terms of behavior issues. A review of synthesized structure may lead to the addition of expected behavior va- riables. Reformulation type III (SF’), addresses changes in design state space in terms of function issues.
The Brainstorming Session
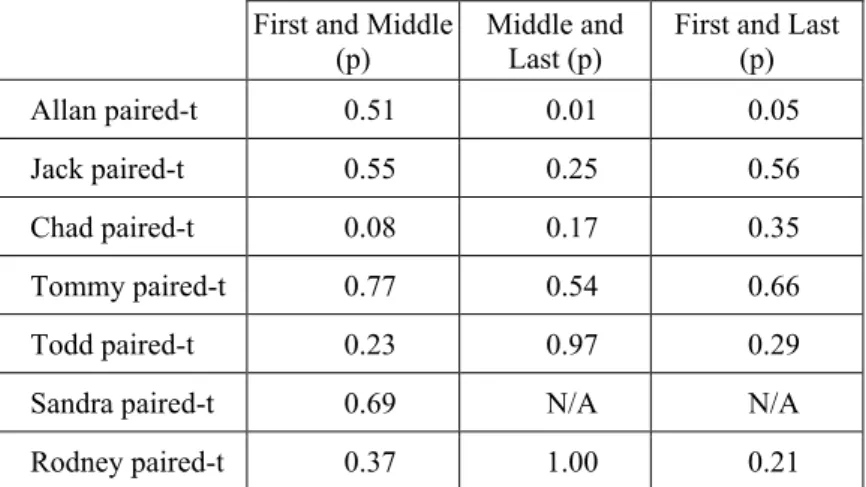
Data for a brainstorming design session was obtained from the 7th Design Thinking Research Symposium [2]. The source data was a video of design meetings taking place in a product design practice. The data is made up of a 4-camera video recording, Figure 2, and the transcripts of the voice communication. The team consisted of a business consultant, who acted as the moderator (Allan), three mechanical engineers (Jack, Chad and Todd), an electronics business consultant (Tommy), an ergonomicist (Sandra), and an industrial design student (Rodney). They were all from the same company and the student, Rodney, was on an internship with the company.
In this brainstorming session, the team was asked to provide ideas for solving technical issues of a working demonstrator of a thermal printing
J. Kan, J.S. Gero and H-H. Tang 4
the paper surface and optimum angle with the media despite wobbly arm moment; and 2) protecting the print head from abusive use and overheat- ing. Observing the protocol, it can be divided into two episodes corre- sponding to these two primary concerns. The video and the transcript of the utterances formed the basis of a think-aloud protocol [3], [4].
The remainder of the paper commences with a brief qualitative descrip- tion of the design session and is followed by sections on quantitative measurements of the cognition of the design activity. The quantitative sec- tions commence with the word counts and turn taking of the team mem- bers. This is followed by a more detailed analysis based on the FBS ontol- ogy issues and processes coding scheme.
Qualitative Observations
The whole session lasted about one hour and thirty-five minutes. The ses- sion can be divided into two episodes; the first one concerned the problem of keeping the print head in contact and at the optimum angle to the media, despite wobbly arm moments. The second episode dealt with protecting the print head from abusive use and overheating. In the first episode, par- ticipants were asked to generate ideas from available products that follow a contour. Several products were mentioned, such as a sledge, snowboard, wind surfboard, shaver, snowmobile, train, and slicer. Other concepts such as wheels, spirit level, feedback to user, and laser leveler were also dis- cussed. Loosely related to those analogies, a few shapes, such as a mouse- type pen, were proposed. Besides product behavior, user behavior was also considered.
In the second episode, ways of protecting the print head were discussed.
A sheath protecting the print head was proposed, the idea of a viscous damper such as leaky syringe was discussed. Other ideas like spring loaded cap, dead man's handle and a dock or cradle, that provides cleaning and charging when the pen is not in use were also discussed. Sandra left about thirty minutes before the end of the session.
Quantitative Observations
This section quantifies some of the qualitative observations in terms of word count and turn taking.
Word Count and Turns Variation during the Session
This section commences with the total number of words and turns in five minutes intervals across the session, Table 1, published by Gero and Kan [5]. Figure 2 is the corresponding trends of word count and turns.
5
Measuring Cognitive Design Activity Changes 5
Table 1 Total number of words and turns in five minutes intervals [4].
Interval 1 2 3 4 5 6 7 8 9 10
Total no.
words 907 863 828 761 830 700 804 800 758 845
Total no. turns 21 61 78 63 74 45 68 77 84 94
Interval 11 12 13 14 15 16 17 18 19
Total no.
words 786 717 766 782 684 717 700 738 810
Total no. turns 88 91 84 93 59 46 63 94 109
Fig. 2 The percentages of total words and total turns in five minutes intervals for the entire team, “Poly” is the polynomial line of best fit [5].
Looking at the team as a whole their percentages of interactions in- creased but their number of words remained fairly constant. This may in- dicate they have learned by producing a shared mental model [6], which is implied by the increased interaction with each interaction requiring fewer words to communicate.
Word Count and Turns of Groups
The group of mechanical engineers was the biggest group with the same background. Since they belong to the same design profession, it is ex- pected that they will share similar mental models, hence their conversation may display a common pattern. However, neither the curves in Figure 3, nor a statistical analysis, suggest any correlating patterns.
Todd was the most active participant in this group based on the word count. Figure 4 shows that the word count curves of Todd and Tommy are
J. Kan, J.S. Gero and H-H. Tang 6
form a cross-discipline sub-team.
Fig. 3 The percentages of word count of the three mechanical engineers in a five minutes interval [5]
Fig. 4 The percentages of word count of Todd and Tommy [5]
FBS Segmenting and Coding
The brainstorming protocol is segmented and coded strictly based on these six categories of issues according to the following rule: one segment per code/ one core per segment. This deals with the problem of how many codes should there be to a segment. Those utterances that do not fall into these categories were not coded.
Results
This section presents the statistical results of the FBS coding that quanti- fies the protocol into issues in terms of FBS. Two remotely-located inde- pendent coders segmented and coded the sessions and arbitrated through internet telephony. The inter-coder agreement was over 80% and each
7
Measuring Cognitive Design Activity Changes 7
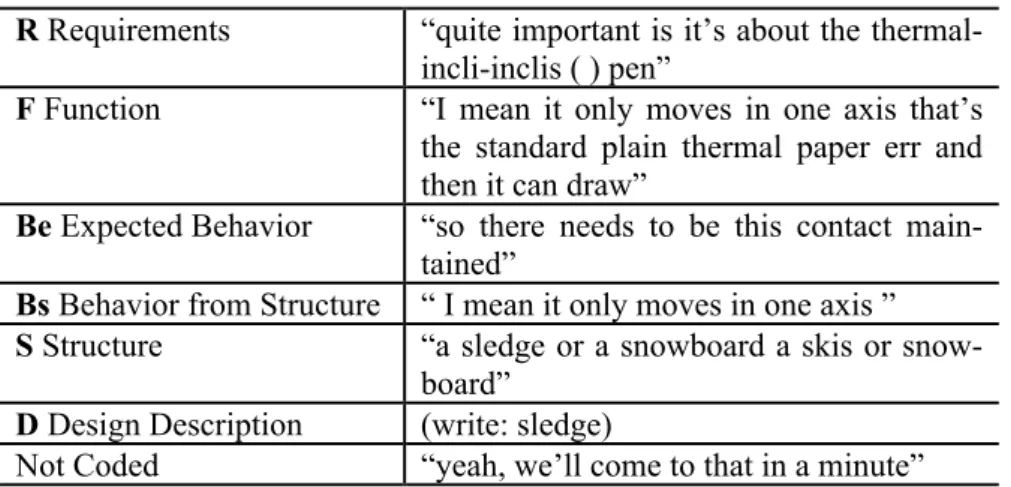
coder’s agreements with the arbitrated set was over 88%. Table 2 shows examples of each code.
Table 2 Examples of coding
R Requirements “quite important is it’s about the thermal- incli-inclis ( ) pen”
F Function “I mean it only moves in one axis that’s the standard plain thermal paper err and then it can draw”
Be Expected Behavior “so there needs to be this contact main- tained”
Bs Behavior from Structure “ I mean it only moves in one axis ” S Structure “a sledge or a snowboard a skis or snow-
board”
D Design Description (write: sledge)
Not Coded “yeah, we’ll come to that in a minute”
Issue Distribution of the Session
After arbitrating there were 1,280 segments that contained FBS issues. Ta- ble 3 summarizes the counts and percentages of each issue.
Table 3 Count and Percentage of Issues
F Be Bs S D
Count 47 275 369 512 77
Percentage 4.0 21.0 29.0 40.0 6.0
The percentages of FBS issues reflect the nature of the session – they were mainly borrowing behavior and structure of other objects. The behav- ior issues occupied half of the counts followed by structure. The low count of D was because only shared documentations were coded. Not withstand- ing the nature of the session, functional aspects were discussed.
The percentages in Table 2 only give an account of the whole session, however according to Asimow elementary model [7], design can be char- acterized by a series of cycles through analysis of the problem, synthesis of a solution, and evaluation of the solution. If Asimow's model is mapped onto this ontology, the analysis of the problem will involve function is- sues; the synthesis of solution will involve structure issues and the evalua-
J. Kan, J.S. Gero and H-H. Tang 8
of designing the number of the FBS issues needs to be counted within a sequence.
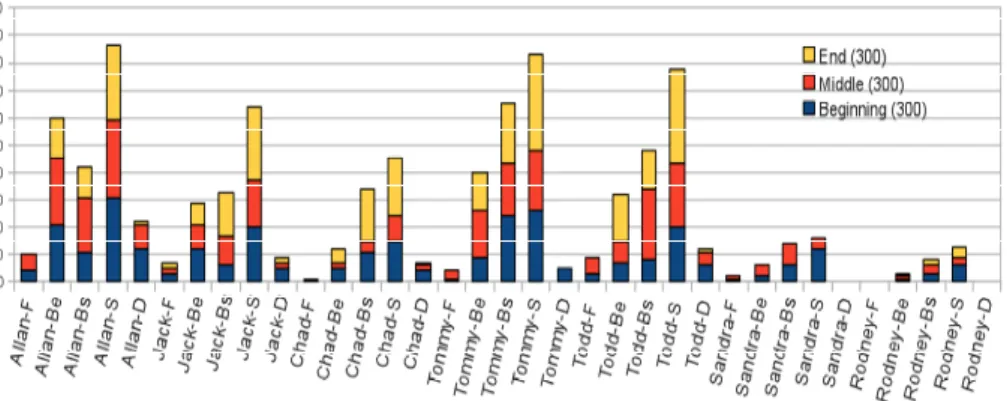
In the next sub-section, the contribution of FBS issues over the session will be presented. Results are also presented that differentiate the contribu- tion of individuals and sum them for the whole team.
Distribution and Variations of FBS Issues
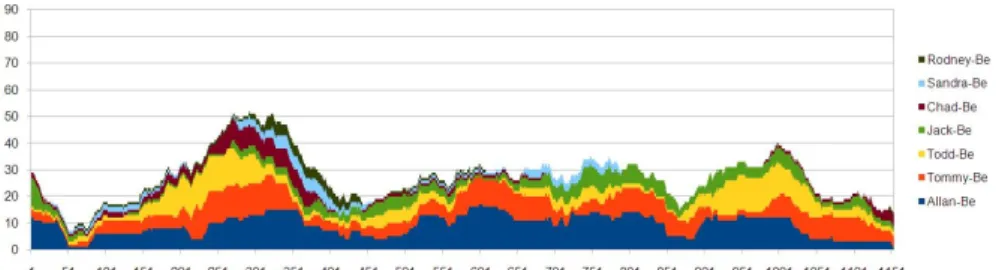
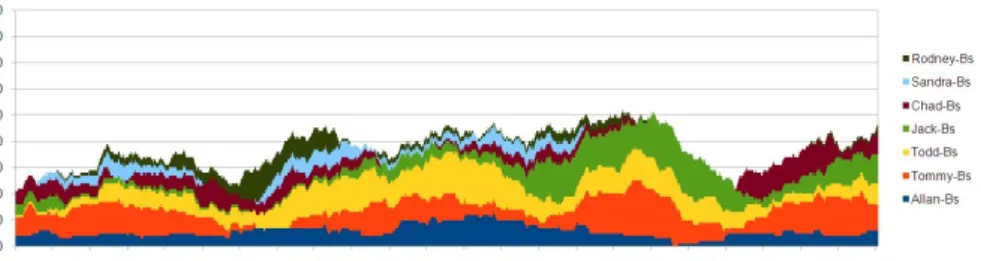
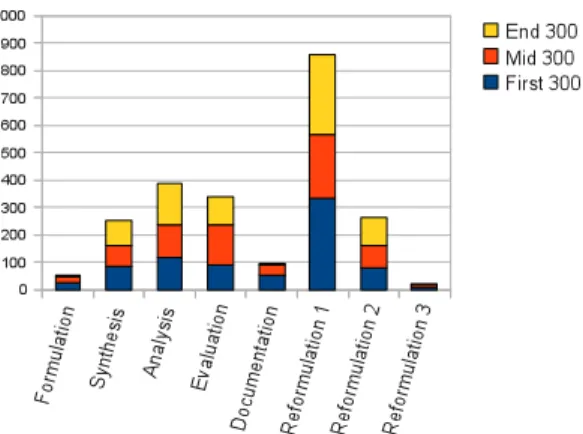
In order to obtain a more fine-grained understanding of how the issues are distributed, a window of 128 segments is taken and moved segment by segment from the beginning to the end of the protocol. This produces an averaging of that issue over those segments. With this 128 segments slid- ing window the number of FBS issues produced by an individual is counted and presented in Figures 6 to 10 for issues F, Be, Bs, S and D re- spectively. The horizontal axes show segment numbers and the vertical axes show issue counts. In each of the graphs the top surface of the graph shows the overall behavior of the team, while the shading maps onto indi- vidual team members.
Fig. 6 F issue distribution of individuals with a 128 segment moving window.
Fig. 7 Be issue distribution of individuals with a 128 segment moving window.
9
Measuring Cognitive Design Activity Changes 9
Fig. 8 Bs issue distribution of individuals with a 128 segment moving window.
Fig. 9 S issue distribution of individuals with a 128 segment moving window.
Fig. 10 D, issue, distribution of individuals with a 128 segment moving window.
As expected in a brainstorming session the structure issue, S, is the domi- nant issue. Again as expected in a brainstorming session the issues of ex- pected behavior, Be, and behavior from structure, Bs, are relatively low as team members had been advised to suspend judgement. One unexpected result is that the F issues concentrate towards the middle rather than at the beginning of the session as has been observed elsewhere [8].
From Figures 6 to 10, qualitatively it appears that there are changes in
![Table 1 Total number of words and turns in five minutes intervals [4].](https://thumb-ap.123doks.com/thumbv2/9libinfo/9128025.412154/26.892.194.697.236.636/table-total-number-words-turns-minutes-intervals.webp)
![Fig. 3 The percentages of word count of the three mechanical engineers in a five minutes interval [5]](https://thumb-ap.123doks.com/thumbv2/9libinfo/9128025.412154/27.892.304.588.263.439/fig-percentages-word-count-mechanical-engineers-minutes-interval.webp)