行政院國家科學委員會專題研究計畫 成果報告
軟體流程改善、軟體發展問題因素與軟體可維護性相互影 響之研究
研究成果報告(精簡版)
計 畫 類 別 : 個別型
計 畫 編 號 : NSC 98-2221-E-011-096-
執 行 期 間 : 98 年 08 月 01 日至 99 年 07 月 31 日 執 行 單 位 : 國立臺灣科技大學資訊管理系
計 畫 主 持 人 : 黃世禎
計畫參與人員: 碩士班研究生-兼任助理人員:劉安蓉 碩士班研究生-兼任助理人員:王繼忠 博士班研究生-兼任助理人員:王子儀
報 告 附 件 : 出席國際會議研究心得報告及發表論文
處 理 方 式 : 本計畫可公開查詢
中 華 民 國 99 年 12 月 27 日
An Empirical Analysis of the Impact of Software Development Problem Factors on Software Maintainability
Abstract
Understanding software development problem factors can help in not only reducing the incidence of project failure but can also ensure software maintainability. This study focuses on (1) those software development problem factors which may possibly affect software maintainability, (2) the influence of software process improvement (SPI) on project problems and the associated software maintainability, and (3) the top 10 list of higher-severity software development problem factors. In this study, we classified 25 problem factors into 5 dimensions and build a questionnaire. There were 137 software projects grouped as low, medium and high maintainability in our survey. Results suggest that SPI can help reduce the level of severity of the documentation quality and process management problems, and is only likely to enhance software maintainability to a medium level. Finally, the top 10 higher-severity software development problem factors were identified, and implications were discussed.
Keywords: Software development problem factors, Software maintainability, Software process improvement
1. Introduction
There are two major phases in the software life cycle: the software development and the software maintenance. The previous studies reveal the fact that software maintenance has been recognized as the most costly and difficult phase in the software life cycle [1].
According to the concept of Software process improvement (SPI), well-defined and clearly documented processes are able to effectively solve the project problems and eventually result in high quality products [2][4][6][8][9][10]. Hence, understanding the problems which can be solved by SPI and the nature of various software development problem factors and their relationship with software maintainability have become both important and necessary in order to improve the maintainability of the delivered software systems.
The purposes of this study are: (1) to explore patterns in software development problem dimensions across low, medium, and high maintainability projects; (2) to determine how SPI affects software development problem dimensions and the associated software maintainability;
(3) to explore the top 10 higher-severity software development problem factors affecting software maintainability.
2. Software maintainability and development problem
According to ISO/IEC 9126-1 (2001), software maintainability, which includes 5 sub-characteristics, is defined as the capability of the software systems to be modified.
Through a literature survey, we have identified 25 major problem factors in the
development phase of software projects which may possibly affect the maintainability of the delivered software systems and classified them into five dimensions: Documentation quality problems (DOC), Programming quality problems (PGM), System requirements problems (SYS), Personnel resources problems (PER), and Process management problems (PM).
Improving software development processes can enhance the quality of software systems and the overall performance of the software project and organization [11]. The ISO 9001 Quality Management System (QMS) (2000) and the Capability Maturity Model Integration (CMMI) (2002) are well-known methodologies that provide guidelines for SPI.
3. Research approach
Initially, this study developed a preliminary questionnaire consisting of 32 items relating to problem factors. Some experts were invited to verify the content validity and readability of the original version of the questionnaire. After deleting some inappropriate items, 25 items remained and were used with a five-point Likert-type scale, ranging from 1 (strongly disagree) to 5 (strongly agree).
This study is based on data collected via an e-mail survey. 160 of 400 questionnaires surveys were returned within a span of four weeks and 23 incomplete questionnaires were discarded. As a result, only 137 became effective response questionnaires yielding a response rate of 34.25%.
The t-test method, Cronbach’s alpha and item-to-total correlation coefficients were conducted to test the potential non-response bias, reliability and internal consistency.
4. Data analysis and results
4.1. Patterns in problem dimensions across different levels of software maintainability
The result of the K-means Cluster Analysis divided the 137 projects into three clusters representing low (n = 62), medium (n = 63) and high (n = 12) levels of software maintainability. In order to avoid the distortion of the analysis results, the outlier samples were eliminated in the subsequent analyses.
In order to explore the patterns in software development problem dimensions across low,
medium and high maintainability projects, the differences between the mean scores of each problem dimension across the different levels of software maintainability projects were computed.
2 .0 0 0 2 .5 0 0 3 .0 0 0 3 .5 0 0 4 .0 0 0 4 .5 0 0 5 .0 0 0
DOC P GM S YS P ER P M Ma in ta in a b ility
P ro b le m d im e n s io n s a n d s o ft wa re m a in t a in a b lit y
Mean scores
Lo w m a in ta in a b ility Me d iu m m a in ta in a b ility Hig h m a in ta in a b ility
Fig. 1. Profile plot of clusters.
Five important findings are presented as follows:
(1) The mean scores of each problem dimension obviously decrease from the low to high software maintainability clusters, as shown in Fig. 1. This indicates that the severity of software development problems needs to be decreased if the maintainability of software projects is to be improved.
(2) The DOC and PGM problem dimensions of all the three levels of software maintainability exceed the baseline threshold. This suggests that successfully dealing with these two problem dimensions is a key requirement to achieve the desired software maintainability.
(3) The PER problem dimension has the maximum value (0.584) of the “Dist 1”. This indicates that the PER problem dimension requires the most attention in relation to achieving improvement as we move from the low to the medium maintainability cluster.
However, the PGM problem dimension has the minimum value (0.252) of the “Dist 1”.
This indicates that the PGM problem dimension only requires minimum attention in relation to achieving improvement as we move from the low to the medium maintainability cluster.
(4) The PER problem dimension has the maximum value (0.962) of the “Dist 2”. This indicates that the PER problem dimension requires the most attention in relation to achieving improvement as we move from the medium to the high maintainability cluster.
However, the SYS problem dimension has the minimum value (0.494) of the “Dist 2”.
This indicates that the SYS problem dimension only requires minimum attention in relation to achieving improvement as we move from the medium to the high maintainability cluster.
(5) For all of the five problem dimensions, the values of “Dist 2” are greater than the values of “Dist 1”. This indicates that as higher levels of software maintainability are required, a corresponding increase in cost and effort in relation to improvement is also required.
The Pearson correlation analysis was performed to explore the relationship between problem dimensions and software maintainability. It suggests that there is a negative and middle-level linear correlation (r = –0.41 ~ –0.62, p < 0.01) between project problems and software maintainability.
Furthermore, in order to explore the influence of all problem factors on software maintainability, the 25 problem factors were combined into one variable, namely “software development problems”. Cronbach’s alpha coefficient exceeded the threshold (0.70) as suggested in [12]; and the item-to-total correlation coefficients were all greater than 0.40, as suggested in [13]. This indicates that the internal consistency of the construct of “software development problems” is acceptable.
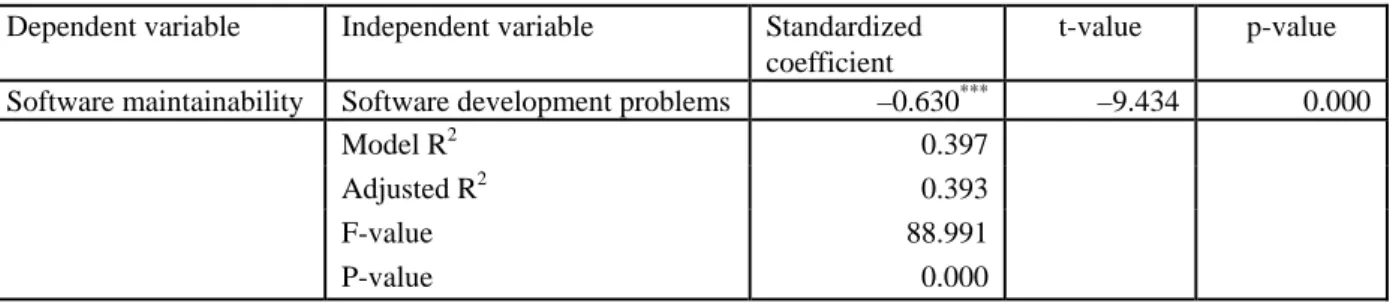
In order to examine the relationship between software development problems and software maintainability, a regression analysis was conducted. As shown in Table 1, it provides empirical evidence that (1) software development problems can negatively affect software maintainability and (2) decreasing levels of the severity of software development problems in projects can improve maintainability of the delivered software systems.
Table 1: Regression analysis: software development problems on software maintainability
Dependent variable Independent variable Standardized coefficient
t-value p-value Software maintainability Software development problems –0.630*** –9.434 0.000
Model R2 0.397
Adjusted R2 0.393
F-value 88.991
P-value 0.000
*** Indicates significance at the 0.001 level.
4.2. The relationship between project demographics and software maintainability
This study also explored the possible confounding effect of project demographics (i.e., project size, project duration, and average experience of project members) on software maintainability.
All project demographics are ordinal scale variables, so one-way ANOVA analyses were
conducted (SPSS, 2004) in this study to examine the relationship between project demographics and software maintainability [5]. The 137 surveyed projects were classified into two or three groups (Models 1 ~ 3), as shown in Tables 2 ~ 4. Each group contains more than 20 projects to ensure that the analysis results are robust [5]. The results suggest that there is no significant relationship (P > 0.05) between project demographics and software maintainability.
Table 2: The results of one-way ANOVA analysis between project size and software maintainability
Model Independent variable Dependent Results
variable F-value P-value a Notes
Model 1 Project size N Software 2.046 0.133
Group 1: 1 – 5 persons 54 maintainability Group 2: 6 – 10 persons 50
Group 3: > 10 persons 33
No significant relationship
Model 2 Project size N Software 2.942 0.089
Group 1: 1 – 5 persons 54 maintainability Group 2: > 5 persons 83
No significant relationship
Model 3 Project size N Software 0.030 0.864
Group 1: 1 – 10 persons 104 maintainability Group 2: > 10 persons 33
No significant relationship
a P > 0.05 indicates no significant relationship.
Table 3: The results of one-way ANOVA analysis between project duration and software maintainability
Model Independent variable Dependent Results
variable F-value P-value a Notes Model 1 Project duration N Software 0.665 0.516
Group 1: < 6 months 31 maintainability Group 2: 6 – 12 months 83
Group 3: > 12 months 23
No significant relationship
Model 2 Project duration N Software 0.151 0.698 Group 1: < 6 months 31 maintainability
Group 2: >= 6 months 106
No significant relationship
Model 3 Project duration N Software 0.922 0.339 Group 1: <= 12 months 114 maintainability
Group 2: > 12 months 23
No significant relationship
a P > 0.05 indicates no significant relationship.
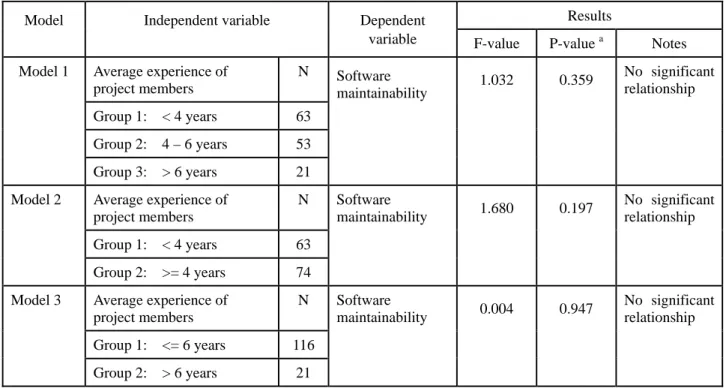
Table 4: The results of one-way ANOVA analysis between average experience of project members and software maintainability
Model Independent variable Dependent Results
variable F-value P-value a Notes Model 1 Average experience of
project members
N Software
maintainability 1.032 0.359 Group 1: < 4 years 63
Group 2: 4 – 6 years 53 Group 3: > 6 years 21
No significant relationship
Model 2 Average experience of project members
N Software
maintainability 1.680 0.197 Group 1: < 4 years 63
Group 2: >= 4 years 74
No significant relationship
Model 3 Average experience of project members
N Software
maintainability 0.004 0.947 Group 1: <= 6 years 116
Group 2: > 6 years 21
No significant relationship
a P > 0.05 indicates no significant relationship.
4.3. Impact of SPI on problem dimensions
In this study, the 137 surveyed projects were classified into two groups: (1) organizations certified with ISO 9001 and/or CMMI; and (2) organizations without ISO 9001 and CMMI certification. This study has no intention to compare or distinguish between ISO 9001 and CMMI, so that if an organization has either one of these two certifications, its projects are regarded as being part of the SPI group. The Univariate F-test was performed (SPSS, 2004) in this study to explore the relationship between SPI and problem dimensions, as shown in Table 5.
The results reveal that SPI projects have a significantly lower level of severity on the DOC dimension (P = 0.040) and PM dimension (P = 0.000) than non-SPI projects. Possible explanations of this finding are: (1) SPI methodologies attach importance to software documentation writing, which can contribute to problem-solving[8][9]; and (2) SPI methodologies place an emphasis on improving the capability of process management, which can contribute to achieving project objectives [3][7]. Therefore, these results suggest that SPI can reduce the level of severity on the DOC and PM dimensions.
Furthermore, the results also reveal that SPI projects have significantly higher levels of software maintainability (P = 0.045) than non-SPI projects. One possible explanation of this finding is that the well-defined and clearly documented processes provided by SPI
methodologies can eventually result in quality products [2][4][6][10]. However, the SPI group-mean value of software maintainability (3.56) does not yet achieve high maintainability, which suggests that SPI is able to increase levels of software maintainability, but is only likely to enhance it to a medium level.
Table 5: Univariate F-test results with SPI toward the five problem dimensions and software maintainability
Problem dimensions and software maintainability
Group1:
SPI = “Yes”
(n = 90)
Group2:
SPI = “No”
(n = 47)
F-value P-value Group mean difference Documentation quality problems (DOC) 3.68 3.92 4.31 0.040* Group1 < Group2 Programming quality problems (PGM) 3.59 3.69 0.82 0.367 –
System requirements problems (SYS) 3.44 3.57 1.13 0.289 – Personnel resources problems (PER) 3.34 3.58 3.28 0.072 –
Process management problems (PM) 3.10 3.60 12.98 0.000** Group1 < Group2 Software maintainability (MA) 3.56 3.35 4.10 0.045* Group1 > Group2
* P-value < 0.05.
** P-value < 0.01.
5. Conclusions
This study has provided empirical evidence that problem factors in the software development phase can negatively affect software maintainability. Therefore, the requirement of software maintainability should be taken into account, and the associated problem factors should also be properly dealt with when performing analysis, design and implementation activities during the software development phase in order to achieve higher levels of software maintainability.
This study also provided empirical evidence that SPI can help in reducing the level of severity of the documentation quality and process management problems, and can help enhance software maintainability to a medium level. Such knowledge can help project managers develop an effective management strategy in order to achieve higher levels of project performance.
Acknowledgement: Based on the result of this NSC research grant, the paper entitled “An Empirical Analysis of the Impact of Software Development Problem Factors on Software Maintainability,” has been accepted for publication in the Journal of Systems and Software.
References
[1] Sousa, M.J., 1998. A Survey on the Software Maintenance Process. In: 14th IEEE International Conference on Software Maintenance (ICSM'98), pp. 265.
[2] Ashrafi, N., 2003. The impact of software process improvement on quality: in theory and
practice. Information & Management 40(7), pp. 677–690.
[3] Chrissis, M.B., Konrad, M., Shrum, S., 2006. CMMI: Guidelines for Process Integration and Product Improvement; 2nd Edition. Addison-Wesley Professional.
[4] Diaz, M. Sligo, J., 1997. How software process improvement helped Motorola. IEEE Software 14(5), 75–81.
[5] Girden, E.R., 1992. ANOVA: Repeated Measures - Quantitative applications in the social sciences. Sage Publications.
[6] Haley, T.J., 1996. Software process improvement at Raytheon. IEEE Software 13(6), 33–41.
[7] Hoyle, D., 2005. ISO 9000 Quality Systems Handbook; Fifth Edition.
Butterworth-Heinemann.
[8] Humphrey, W.S., 1992. Introduction to Software Process Improvement. Software Engineering Institute Technical Report CMU/SEI-92-TR-7.
[9] Kuilboer, J. P., Ashrafi, N., 2000. Software process and product improvement: an empirical assessment. Information and Software Technology 42(1), 27–34.
[10] McGarry, F., Pajerski, R., Page, G., Waligora, S., Basili, V., Zelkowitz, M., 1994. Software Process Improvement in the NASA Software Engineering Laboratory. Software Engineering Institute Technical Report CMU/SEI-94-TR-22.
[11] Paulish, D.J., Carleton, A.D., 1994. Case studies of software-process-improvement measurement. Computer 27(9), 50–57.
[12] Nunnally, J.C., 1978. Psychometric Theory. McGraw-Hill, New York, NY.
[13] Park, C.H., Kim, Y.G., 2003. Identifying key factors affecting consumer purchase behavior in an online shopping context. International Journal of Retail & Distribution Management 31(1), 16–29.
Report on the International conference attendance
The 11th ACIS International Conference on Software Engineering (SE), Artificial Intelligence (AI), Networking and Parallel/Distributed Computing (NPDC) (SNPD-2010) was held on 9-11 June, 2010 by The University of Greenwich, London, United Kingdom and Sponsored by the International Association for Computer and Information Science. The SNPD-2010 Proceeding was published by Conference Publishing Services. The conference chairs were Dr. Liz Bacon at The University of Greenwich, U.K. and Dr. Wencai Du at Hainan University, China.
The program chairs were Jixin Maand and Miltos Petridis, both at The University of Greenwich, U.K.
The conference stared at two keynotes speakers. The title of the first one is
“What’s computing? –Enabling computationally Oriented thinkers” given by Prof.
Lynn Andera. The second one is “Model-based Testing for Web Application” given by Prof. H. Miao at Shanghai University. I only attended the second keynote speech. Prof. H. Miao mentioned that high-performance web application brings many new features such as dynamic behaviors, heterogeneous representations and uncertainty in execution, and thus makes it extremely difficult to test. Prof. H.
Miao surveyed many recent research works in Web applications testing, and presented an approach to modeling Web application using UML and FSM and generating test cases according to the test coverage criteria. He also introduced a tool for automatically building test model of Web application, generating test cases and executing the test cases.
Following two keynote speakers, four sessions were held at the first day and 8 sessions at the second day. I was most interested in and therefore only attended software engineering-related sections. The presented SE-related papers at Sessions 1A, 1D, 2D and 2G included Component-Based Software Engineering, Software Specification & Architecture, Software Testing, E-Commerce and its applications, User-Centered Design Methods, Web-Based Applications.
Session 1A was “Software Specification and Architecture”, which was most closed to my main research areas. Six papers were presented at this session. The titles of thee six papers were: “From Textual Use-Cases to Component-Based Applications”, “Co-Design of the Business and Software Architectures: A Systems Engineering and Model-Driven Method”, “Design and Performance Evaluation of a Machine Learning based Method for Intrusion Detection” , “Integrated Wireless Networking Architecture for Maritime Communications” , “Research on a Cooperative Model for Service Chain of Digital Library” and “ERA: Evolving Reconfigurable Architecture”.
Session 1D was “Internet Technology and Applications/Web-Based Applications”. Four papers were presented and thy are “XML Document Recommendation by Using Case-Based Reasoning”, “An External Storage Support for Mobile Applications with Scare Resources”, “Web Object Prefetching:
Approaches and a New Algorithm” and “Architectural Reconstruction of 3D Building Objects Through Semantics Knowledge Management”.
Session 2D was Data Mining and Knowledge Discovery/Software Testing.
Four papers were presented but only one paper was related to software testing.
Its tile was “Test Generation for Web Applications Using Model-Checking”.
Session 2G was “Collaborative Computing/ Service-Oriented Computing/ Visual and Multimedia Computing”. One of four presented papers was lightly closed to my master student’s work. It was “Bounded Model Checking for Web Service Discovery and Composition”. The title of my student’s master thesis was”具備功能 性分析與 QoWS 評估機制之網路服務組合流程模式”.
After tow-day paper presentation, five papers were chosen as best papers and recommended for publication in the International Journal of Computer and Information Science (IJCIS). Some outstanding papers were also selected for publication in the Springer’s academic series.
This conference brought scholars and industry practitioners together to discuss and exchange their new ideas and research results. Most scholars come from UK and China. I got some acquainted with some papers’ authors from China.
I had benefited from attending this conference and it also facilitated possible opportunities for further collaborations and linkages with software engineering researchers. Therefore, I thank NSC for the financial support so that I can attend this conference.
國科會補助計畫衍生研發成果推廣資料表
日期:2010/12/27
國科會補助計畫
計畫名稱: 軟體流程改善、軟體發展問題因素與軟體可維護性相互影響之研究 計畫主持人: 黃世禎
計畫編號: 98-2221-E-011-096- 學門領域: 資訊系統管理
無研發成果推廣資料
98 年度專題研究計畫研究成果彙整表
計畫主持人:黃世禎 計畫編號:98-2221-E-011-096-
計畫名稱:軟體流程改善、軟體發展問題因素與軟體可維護性相互影響之研究 量化
成果項目 實際已達成
數(被接受 或已發表)
預期總達成 數(含實際已
達成數)
本計畫實 際貢獻百
分比
單位
備 註 ( 質 化 說 明:如 數 個 計 畫 共 同 成 果、成 果 列 為 該 期 刊 之 封 面 故 事 ...
等)
期刊論文 0 0 100%
研究報告/技術報告 0 0 100%
研討會論文 0 0 100%
論文著作 篇
專書 0 0 100%
申請中件數 0 0 100%
專利 已獲得件數 0 0 100% 件
件數 0 0 100% 件
技術移轉
權利金 0 0 100% 千元
碩士生 2 2 100%
博士生 1 1 100%
博士後研究員 0 0 100%
國內
參與計畫人力
(本國籍)
專任助理 0 0 100%
人次
期刊論文 1 1 100%
研究報告/技術報告 0 0 100%
研討會論文 0 0 100%
論文著作 篇
專書 0 0 100% 章/本
申請中件數 0 0 100%
專利 已獲得件數 0 0 100% 件
件數 0 0 100% 件
技術移轉
權利金 0 0 100% 千元
碩士生 0 0 100%
博士生 0 0 100%
博士後研究員 0 0 100%
國外
參與計畫人力
(外國籍)
專任助理 0 0 100%
人次
其他成果
(
無法以量化表達之成果如辦理學術活動、獲 得獎項、重要國際合 作、研究成果國際影響 力及其他協助產業技 術發展之具體效益事 項等,請以文字敘述填 列。)
This study also provided empirical evidence that SPI can help in reducing the level of severity of the documentation quality and process management problems, and can help enhance software maintainability to a medium level. Such knowledge can help project managers develop an effective management strategy in order to achieve higher levels of project performance.
成果項目 量化 名稱或內容性質簡述
測驗工具(含質性與量性) 0
課程/模組 0
電腦及網路系統或工具 0
教材 0
舉辦之活動/競賽 0
研討會/工作坊 0
電子報、網站 0
科 教 處 計 畫 加 填 項
目 計畫成果推廣之參與(閱聽)人數 0
國科會補助專題研究計畫成果報告自評表
請就研究內容與原計畫相符程度、達成預期目標情況、研究成果之學術或應用價 值(簡要敘述成果所代表之意義、價值、影響或進一步發展之可能性) 、是否適 合在學術期刊發表或申請專利、主要發現或其他有關價值等,作一綜合評估。
1. 請就研究內容與原計畫相符程度、達成預期目標情況作一綜合評估
■達成目標
□未達成目標(請說明,以 100 字為限)
□實驗失敗
□因故實驗中斷
□其他原因 說明:
2. 研究成果在學術期刊發表或申請專利等情形:
論文:■已發表 □未發表之文稿 □撰寫中 □無 專利:□已獲得 □申請中 ■無
技轉:□已技轉 □洽談中 ■無 其他:(以 100 字為限)
3. 請依學術成就、技術創新、社會影響等方面,評估研究成果之學術或應用價 值(簡要敘述成果所代表之意義、價值、影響或進一步發展之可能性)(以 500 字為限)
This study has provided empirical evidence that problem factors in the software development phase can negatively affect software maintainability. Therefore, the requirement of software maintainability should be taken into account, and the associated problem factors should also be properly dealt with when performing analysis, design and implementation activities during the software development phase in order to achieve higher levels of software maintainability.