CHAPTER THREE METHODOLOGY
This chapter presents the design of the present study. The subject will be described in section 3.1, the instruments in section 3.2, the procedures in section 3.3, and the results in section 3.4. Finally, the main points of this chapter will be summarized in section 3.5.
3.1 Subjects
One hundred and seven EFL learners1 from Taipei Municipal Fu-Hsing Senior High school participated in the study. The age of the participants ranged between 15 and 16. The subjects were all female students, coming from three classes of the first- year students the researcher instructed. At the time of the study, there were thirty-eight classes for the subjects a week, with forty students in a class in general.
The proportion of male to female students was approximately 1 to 1. The researcher’s school was similar to most of other senior high schools in Taiwan, except that there were one physical education-majored class and four art-majored classes (music, arts, drama, and dance) in each grade. English was a required subject for the participants and monthly examinations and regular quizzes were administered to assess their English achievement.
The first-year female students were selected as the participants of the present study for three reasons. For one thing, their cognitive abilities were mature enough to report appropriately about learning styles and multiple intelligences. For another, the first-year students were not suffering pressure from the Joint College Entrance
1 Originally one hundred and eight students participated in the experiment. Since one subject did not take the speaking test, only the data of 107 students were analyzed.
Examination as their senior schoolmates were. So they might be more willing to be spend time participating in the present study. Besides, female students, in general, are considered more obedient and cooperative compared with their male counterparts in language learning.
3.2 Instruments
Four tests were given to the subjects to measure their English proficiency, including listening comprehension, reading comprehension, oral production, and written production. Two questionnaires were also used to collect information on the subjects’ learning styles and multiple intelligences. In addition, interview questions were designed based on the subjects’ responses to the questionnaires.
Testing of English Proficiency
The students’ English proficiency was determined from four aspects, including the students’ performances on GEPT listening and reading tests as well as their performances in the speaking and writing tasks.2 First of all, GEPT (General English Proficiency Test) listening and reading tests were used to measure the subjects’ English reading and listening ability. Because the students were juniors in high school and their English was not good in general, the researcher adopted the elementary level of the GEPT, which equals to the standard level of junior high school graduates’ English proficiency. The listening test consisted of thirty multiple choice questions and the reading test consisted of thirty-five questions. The students were asked to choose an appropriate answer according to the questions. In addition, the subjects’ oral production was measured. They were asked to prepare a 2-minute
2 To add variety to the testing method and integrate the testing into the curriculum, the subjects’ oral production was measured by the tasks.
speech in which they had to introduce the most precious thing in their rooms3 by showing it in class and talking about it, such as where it came from and the reason why they treasured it. Besides, the subjects’ written production was measured: they were asked to write a composition about 100 words as an assignment under the topic
“My Ideal boyfriends.” The subjects were told to describe the qualities of their ideal boyfriends and the reasons behind them. They were allowed to consult the dictionary while doing the task at home. After they finished their work, they had to e-mail it to the researcher by the deadline.
Learning Style Inventory
The Learning Style Inventory (see Appendix A) was a self-reporting questionnaire composed of 24 elements4 and 104 items divided into four major categories: immediate environment, emotionality, sociological needs, and physical needs. The research findings of the Dunns and their colleagues verify that most students can correctly identify their learning strengths, particularly when an element is strongly preferred or rejected (Dunn, 1984). The researcher adopted the LSI for two reasons. For one thing, its good reliability and its validity has been recognized.
Examined by the National Center for Research in Vocational Education at the Ohio State University for more than two decades, the LSI (Dunn, Dunn & Price, 1975, 1978, 1984, 1986, 1987, 1989) has established impressive reliability and construct
3 Because in the present study there was no language laboratory with recording equipments in the subjects’ school, the GEPT speaking test was not used.
4The 24 elements divided into four major categories include: (a) environment (sound, light, temperature,
seating design; (b) emotionality (motivated, adult-motivated, teacher-motivated, persistent, responsible, needs structure, prefers learning through several ways; (c) sociological needs (prefers learning alone, peer-oriented, learning with adults; (d) physical needs (perceptual preferences for auditory/visual/tactile/kinesthetic, requires intake, functions best in morning/ late morning/ afternoon/
evening, and needs mobility.
validity (Dunn & Dunn, 1993; Kirby, 1979). Keefe (1982) indicated that it “is the most widely used in elementary and secondary schools”(p.52). For the other, compared with other inventories concerning learning styles (e.g., Reid’s PLSPQ, 1984;
Oxford’s SAS, 1993), the LSI covers a wider range of elements such as motivation, persistence, and responsibility, which might influence learning. Therefore, the Dunns’ instrument was best suited for the present study.
To prevent the students from feeling exhausted by responding to so many items, the researcher omitted the environmental stimulus5 and some elements in the category of physical needs (i.e. intake, time of day, mobility) in the LSI, which were not relevant to the present study. In this way, the modified inventory included 40 statements consisting of ten elements divided into three main categories (see Table 3-1).
Table 3-1 Revised Learning Style Inventory (for the Present Study)
Categories Elements Emotional motivation, persistence, responsibility, structure
Sociological Peer-oriented, adult-oriented Perceptual auditory, visual, tactile, kinesthetic
The ten elements are motivation, persistence, responsibility, structure, peer-oriented, adult-oriented, auditory, visual, tactile and kinesthetic (see pp.5-6 for definition). The 4-point scale inventory ranges from “strongly agree” (point 4) to
“strongly disagree” (point 1). The internal consistency reliability of this inventory was .92 and .68 ~ .83 for each subscales in Wu’s (2002) study. To prevent possible
5 The environmental stimulus include sound, light, temperature, and seating design.
misunderstandings caused by the participants’ limited English proficiency, the Chinese edition of LSI (Dunn et al., 1989) from Price System, Inc. was adopted. The inventory can be completed in approximately 20 minutes.
To further understand the subjects’ learning backgrounds, four multiple questions concerning personal information were added to the questionnaire (see Appendix A):
the subjects’ family economic status, when they started to learn English, how long they had studied English, and how they liked English. The questions were written in Chinese to prevent misunderstandings. The subjects were asked to make their choices according to their real situations.
MI Inventory
The MI Inventory (see Appendix B) used in the present study was developed by Hsieh (2000). The instrument consisted of 64 statements in a six-point Likert scale on the eight intelligences to be measured: logical-mathematical, linguistic, spatial, bodily-kinesthetic, musical, interpersonal, intrapersonal, and naturalist intelligences.
The inventory used in this study was a self-reporting questionnaire, ranging from
“strongly agree” (point 6) to “strongly disagree” (point 1). Hsieh’s (2000) inventory was adopted for the present study for two reasons. For one thing, her inventory was based on the essence of Gardner’s (1983, 1995) MI theory. Thus, the results of the inventory were able to indicate the subjects’ distribution of multiple intelligences.
Another reason is that the results of the inventory indicated a good reliability and validity. Hsieh (2000) reported internal consistency reliability of .97 on 105 samples.
The correlation coefficient for each subscale ranged from .50 to .81 (P < .001).
Cronbach’s alpha for each subscale was also reported: linguistic (.89), logical-mathematical (.87), spatial (.88), bodily-kinesthetic (.83), musical (.84), interpersonal (.83), intrapersonal (.80), naturalist (.81).
Interview
To confirm the reliability of the subjects’ responses to the two questionnaires and further explore the causes behind their responses, a more in-depth investigation was done through interviews. On the basis of their responses to the questionniares, six students were selected6 and interviewed I in Chinese about 40 minutes respectively.
The interview questions (see Appendix C) were designed by the researcher not only according to the main points of the questionnaires but to the different responses from the interviewees.
3.3 Procedures
This section consists of three sections: 3.3.1 Formal Testing, 3.3.2 Scoring and 3.3.3 Data Analysis. Since a good reliability and validity of the two inventories has been indicated in previous studies (Hsieh, 2000; Wu, 2002), a pilot study appeared unnecessary. Nevertheless, the researcher still asked for two Chinese teachers’
advice on the two questionnaires to improve the ambiguous items. Their suggestions were used as a reference to modify the questionnaire used in the formal study (see Appendixes D & E).
3.3.1 Formal Testing English Proficiency
The students’ English proficiency was determined by their performances in the four different tests. One hundred and seven students took the test.7 The researcher
6 The subjects who were considered high/ low achievers in all the four tests were chosen for the interview.
7 To avoid the “practice effect” and maintain the reliability of the test, those who had taken the test before were ruled out of the valid samples. The same rule applies to the reading test.
herself conducted all the tests. To begin with, the subjects’ listening test was given in October, 2003. They were given the GEPT listening test consisting of 30 questions in class in the third week of October. It took them about twenty minutes to finish the test. Then their test papers were collected. Next, they were given the GEPT reading test consisting of 35 questions in class in the following week. It took them about 35 minutes to finish the test. Similarly, their test papers were then collected. In addition, the subjects’ writing test was done in November, 2003.
They were told to write a 100-word composition whose topic was “My Ideal Boyfriend” and hand in the assignment through e-mail within two weeks. They were further told that their performances would be graded and considered in their English final grades. The students’ compositions were collected by the researcher in the middle of November8. Finally, the testing of students’oral production was conducted during early December, 2003. Each student had to prepare a 2-minute English speech with the topic “The Most Precious Thing in My Rooms”. Similarly, they were told that their performances would be graded. They were given two weeks to prepare for their speech. The testing was administered during two meetings for each class in the middle of December. The students’ performances were videotaped as a basis of rating. Since one student was absent during the testing of speaking test, the final sample size was 107.
Questionnaires
The administration of the questionnaires took place during the last week of October, 2003. The learning style questionnaire and the MI questionnaire were given to the subjects in different periods of English class to prevent them from feeling
8 To offer feedback to the subjects, they also got back the corrected copies of their compositions through e-mail from the researcher.
too tired. The researcher carried out the surveys in the following order: First, the researcher explained the purpose of the study and the procedure of administration to the subjects. In addition, they were told that the results of the survey would only be used for academic research and wouldn’t influence their grades. Next, they read a general instruction form and signed a consent form (see Appendix A). They were also asked to complete the personal information form and respond to the statements on the questionnaire of learning styles, which consisted of 40 items ranging from
“strongly agree” (point 4) to “strongly disagree” (point 1). It took about twenty minutes for the subjects to self-report their own learning style preferences. They were asked to hand in the questionnaires after completing them.
The MI questionnaire was administered in a similar way in another period of English class. It consisted of 64 items ranging from strongly agree (point 6) to strongly disagree (point 1). The MI questionnaire could be completed in approximately 30 minutes.
Interviews
After the surveys of the inventories, those who were considered high/ low achievers in all the four tests were chosen for the interview9. The researcher interviewed the subjects one by one for about forty minutes respectively. Due to the subjects’ limited English proficiency, the interview was conducted in Chinese to avoid misunderstanding. Before the interview began, the subjects were told that what they said in the interview would not affect their grades. This was done to prevent them from having any concern about revealing their true opinions. The whole process was recorded by the researcher for further data analysis.
9 High/low achievers were identified by the students’ performances in the test. The high achievers were those who scored at least one standard deviation above the mean of grades, and the low achievers were those who scored one standard deviation below the mean.
3.3.2 Scoring
Listening and Reading Test
Since the GEPT listening and reading tests were used in the present study, the scoring policy was also adopted. The full score for both tests was 120. Four points were given for each question in the listening test and 3.4 points in the reading test.
The subjects’ final scores on the two tests were decided by the number of question items that they answered correctly. After the administration of each test, their test papers were collected. Then their final scores were calculated, entered into the computer, and performed for necessary statistical analyses.
Speaking & Writing Tests
After the administration of the speaking test, the subjects’ performances were rated by the researcher and one of her colleague10 respectively. The two raters had communicated with each other about the scoring standard by rating several samples before they started rating. The subjects’ performances were given scores by the two raters11, ranging from 1 to 5. Pronunciation, intonation, fluency, and content were all taken into consideration to attain a holistic score. Finally, the scores given by the two raters were averaged for the final grades. In addition, if there was a sharp disagreement on the score12, a third rater (a more senior colleague) was asked to determine the final grade. A similar rating strategy applied to the writing test13. The subjects’ compositions were rated by two raters, including the rater herself and
10 The other rater had been an English teacher for five years.
11 Since the difference in the scores given by the two raters was small, the inter-rater reliability was not run.
12 If the difference in the score given by the two raters was higher than two points, a third rater would determine the final grades of the subject.
13 Likewise, if the difference in the scoring was higher than two points, a third rater was asked to decide the final grade.
another colleague, who had taught English for more than ten years. The students’
performances were given scores ranging from 1 to 5 again. Content, grammar, and wording were taken into consideration. The scores were averaged later to be the final grades.
The Criteria of Grouping
The high/ low achievers were identified by the subjects’ performances in the test. The so-called high achievers were those who scored at least one standard deviation above the mean scores, and the low achievers were those who scored one standard deviation below the mean.
3.3.3 Data Analysis
All the data were computed by the SAS (6.12) statistic package. The subjects’
scores in the two questionnaires were first analyzed by descriptive statistics, so were their scores in the four tests. Next, Multiple Regression was performed to investigate the learning styles and multiple intelligences dominating the subjects’ English proficiency. To further compare differences between high and low achievers in learning styles and multiple intelligences, a series of t-tests were then performed.
Besides, Pearson Correlation Coefficients were used to examine the correlation among the scores in the four skills as well as the correlation between the subjects’ English proficiency and personal information. An acceptable significance level was set at .05.
Finally, the recorded interviews were transcribed and translated into English by the researcher. The word-by-word written transcription offered great insights for further discussion in the latter part of Chapter Four.
3.4 Results
In this section, the subjects’ performances in the four tests and the correlation among the four skills will be described in section 3.4.1. In section 3.4.2, descriptive statistics of the students’ learning style preferences will be presented. Moreover, learning styles of the high and low achievers will also be discussed. In section 3.4.3, descriptive statistics of the subjects’ multiple intelligences, including those of the high and low achievers will be reported.
3.4.1 The Students’ English Proficiency
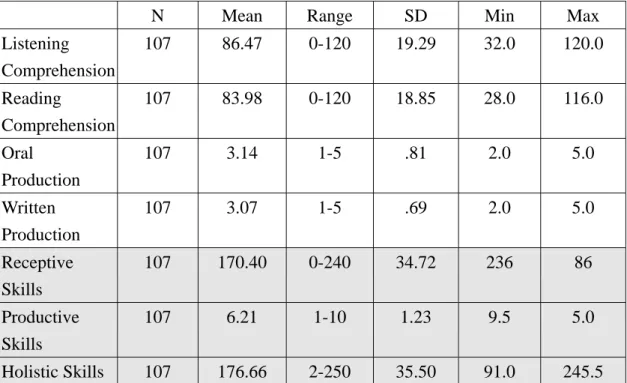
Table 3-2 presents the descriptive statistics of the subjects’ English proficiency.
In general, the subjects did better in the listening test (M=86.47) than in the reading test (M=83.98). On the other hand, they scored higher in the speaking test (M=3.14) than in the writing test (M=3.07).
Table 3-2 Descriptive Statistics of the Subjects’ English Proficiency
N Mean Range SD Min Max
Listening Comprehension
107 86.47 0-120 19.29 32.0 120.0 Reading
Comprehension
107 83.98 0-120 18.85 28.0 116.0 Oral
Production
107 3.14 1-5 .81 2.0 5.0 Written
Production
107 3.07 1-5 .69 2.0 5.0 Receptive
Skills
107 170.40 0-240 34.72 236 86
Productive Skills
107 6.21 1-10 1.23 9.5 5.0
Holistic Skills 107 176.66 2-250 35.50 91.0 245.5
Note: 1. N= number of students; SD=Standard Deviation; Min =minimum; Max=maximum 2. Receptive skills consist of listening and reading skills while productive skills consist of
speaking and writing skills.
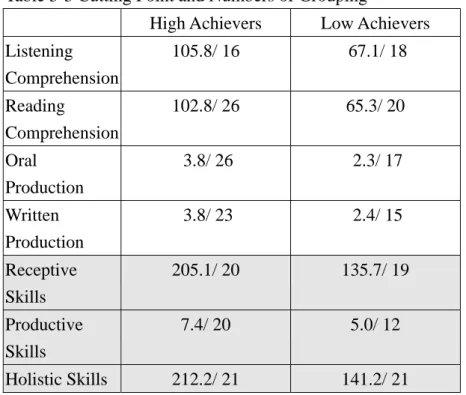
The high and low achievers were identified by the subjects’ performances in the tests. The high achievers were those who scored at least one standard deviation above the mean scores, and the low achievers were those who scored one standard deviation below the mean. Table 3-3 shows the results with regard to the cutting points and numbers for the high and low achievers:
Table 3-3 Cutting Point and Numbers of Grouping
High Achievers Low Achievers Listening
Comprehension
105.8/ 16 67.1/ 18 Reading
Comprehension
102.8/ 26 65.3/ 20 Oral
Production
3.8/ 26 2.3/ 17
Written Production
3.8/ 23 2.4/ 15
Receptive Skills
205.1/ 20 135.7/ 19 Productive
Skills
7.4/ 20 5.0/ 12
Holistic Skills 212.2/ 21 141.2/ 21
On the whole, the high achievers in the listening and reading test were those who scored higher than 102, and the low achievers’ scores were lower than 65. The high achievers in the speaking and writing test were those who scored higher than about 4, and the low achievers scored lower than 2. The high achievers in the receptive skills scored higher than 205, but the low achievers scored lower than 135. The high/ low achievers in the productive skills were those who scored higher than 7/ lower than 5.
The high/ low achievers in holistic skills were those who scored higher than 212/
lower than 141.
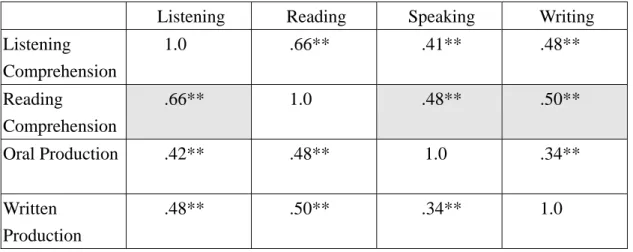
Pearson product-moment correlation was performed to examine the relationship among the four English skills (i.e. listening, reading, speaking and writing). As shown in Table 3-4, the subjects’ performances in the four skills were significantly correlated to one another (p< .01). In fact, a moderate correlation was indicated among the four skills. Of all the four skills, the correlation between reading skills and the other three skills was the strongest, implying that reading ability plays a crucial role in the master of the other three skills. In other words, the better a subject could read, the better her English proficiency could be.
Table 3-4 Pearson Correlation Coefficients Among the Four Skills
Listening Reading Speaking Writing
Listening Comprehension
1.0 .66** .41** .48**
Reading
Comprehension
.66** 1.0 .48** .50**
Oral Production .42** .48** 1.0 .34**
Written Production
.48** .50** .34** 1.0
** indicates statistically significant difference at p< .01.
Results obtained from Pearson Correlation Coefficients also indicated a significant correlation between the receptive skills and productive skills (r=.62;
p< .01). Additionally, the holistic skills were correlated to both the receptive skills and productive skills. Moreover, the receptive skills showed a stronger correlation (r=.99) with the holistic skills than the productive skills (r=.65). The results were understandable, since the receptive skills measured by the GEPT were expected to
attain higher reliability.
Table 3-5 shows the correlation among receptive, productive, and holistic skills:
Table 3-5 Correlation Among Receptive, Productive and Holistic Skills Productive skills Holistic skills
Receptive skills .62** .99**
Productive skills 1.0 .65**
** indicates statistically significant difference at p< .01.
3.4.2 Descriptive Statistics of the Learning Style Preferences
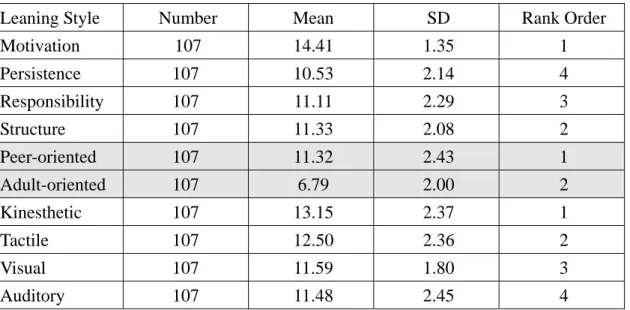
Descriptive statistics of the learning style questionnaire were computed to obtain the subjects’ learning style preferences. Table 3-6 shows that the means for the ten learning styles ranged from 6.79 to 14.41. In the emotional category, there was only a slight difference among the styles. The highest frequency of use fell on motivation (M=14.41), followed by needing structure (M=11.33), responsibility (M=11.11), and persistence (M=10.53). Obviously, except for motivation, there was no big difference among the other three categories. As for the sociological category, there was a noticeable difference between peer-oriented (M=11.32) and adult-oriented (M=6.79), showing that most of the subjects would rather work with their peers than with an authority figure. This indicates that our subjects desired to be identified by their peers and objected to authoritative education. With regard to the perceptual learning, the subjects preferred kinesthetic and tactile learning the most (M=13.15 &
12.50). This result is similar to Reid’s (1987), Rossi-Li’s (1995), and Stebbin’s (1995) findings that most ESL learners expressed a major preference for kinesthetic and tactile learning modes. The result also shows that the students preferred visual learning modes second to the least (M=11.59), and auditory learning the least (M=11.48), which contradicts Tsao’s (2002) finding that students preferred auditory
leaning the most.
In general, the results showed that these subjects had rather strong motivation for learning, preferred a style of learning that involved them in the totality of the language learning experience (kinesthetic and tactile) and in collaborative work (peer-oriented). Therefore, it is possible that they benefited from realistic contexts and interactive behaviors as a basis for their language development.
Table 3-6 Descriptive Statistics of the Subjects’ Learning Styles
Leaning Style Number Mean SD Rank Order
Motivation 107 14.41 1.35 1
Persistence 107 10.53 2.14 4
Responsibility 107 11.11 2.29 3
Structure 107 11.33 2.08 2
Peer-oriented 107 11.32 2.43 1
Adult-oriented 107 6.79 2.00 2
Kinesthetic 107 13.15 2.37 1
Tactile 107 12.50 2.36 2
Visual 107 11.59 1.80 3
Auditory 107 11.48 2.45 4
Notes: 1. SD stands for standard deviation.
2. The maximum mean for each style is 16, and the minimum mean is 4.
To further compare the differences in learning style preferences between the high and the low achievers in listening, reading, speaking, writing, receptive, productive, and holistic skills respectively, a series of tables were presented as follows:
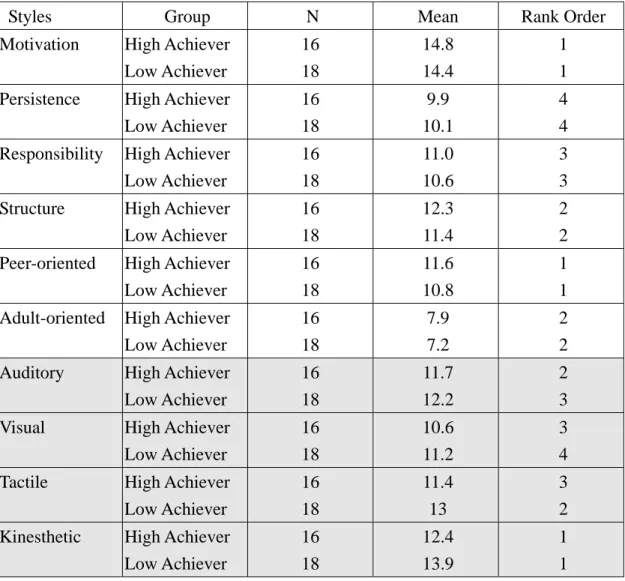
Table 3-7 shows that there was only a slight difference between high and low achievers in listening comprehension. Nevertheless, the high achievers were more motivated, responsible, peer-oriented, adult-oriented and preferred structure. As for perceptual preferences, both the high achievers and the low achievers preferred
kinesthetic learning the most. Moreover, it was obvious that the high achievers did not show a stronger preference for all four learning styles.
Table 3-7 Learning Styles of the High and Low Achievers in Listening Comprehension
Styles Group N Mean Rank Order
Motivation High Achiever Low Achiever
16 18
14.8 14.4
1 1 Persistence High Achiever
Low Achiever
16 18
9.9 10.1
4 4 Responsibility High Achiever
Low Achiever
16 18
11.0 10.6
3 3 Structure High Achiever
Low Achiever
16 18
12.3 11.4
2 2 Peer-oriented High Achiever
Low Achiever
16 18
11.6 10.8
1 1 Adult-oriented High Achiever
Low Achiever
16 18
7.9 7.2
2 2 Auditory High Achiever
Low Achiever
16 18
11.7 12.2
2 3 Visual High Achiever
Low Achiever
16 18
10.6 11.2
3 4 Tactile High Achiever
Low Achiever
16 18
11.4 13
3 2 Kinesthetic High Achiever
Low Achiever
16 18
12.4 13.9
1 1
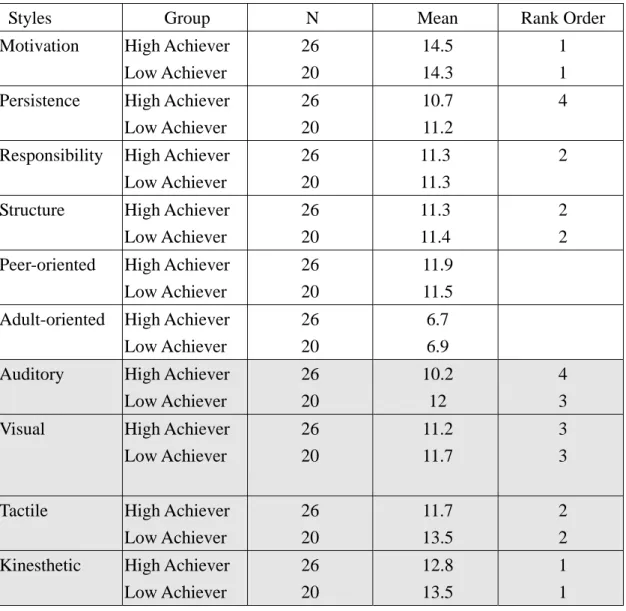
As shown in Table 3-8, there was little difference in reading comprehension between the high and low achievers except for auditory and tactile learning. In addition, the high achievers were more motivated and peer-oriented while reading.
With regard to perceptual preferences, the high achievers showed a weak preference for all the learning styles again.
Table 3-8 Learning Styles of the High and Low Achievers in Reading Comprehension
Styles Group N Mean Rank Order
Motivation High Achiever Low Achiever
26 20
14.5 14.3
1 1 Persistence High Achiever
Low Achiever
26 20
10.7 11.2
4 Responsibility High Achiever
Low Achiever
26 20
11.3 11.3
2 Structure High Achiever
Low Achiever
26 20
11.3 11.4
2 2 Peer-oriented High Achiever
Low Achiever
26 20
11.9 11.5 Adult-oriented High Achiever
Low Achiever
26 20
6.7 6.9 Auditory High Achiever
Low Achiever
26 20
10.2 12
4 3 Visual High Achiever
Low Achiever
26 20
11.2 11.7
3 3 Tactile High Achiever
Low Achiever
26 20
11.7 13.5
2 2 Kinesthetic High Achiever
Low Achiever
26 20
12.8 13.5
1 1
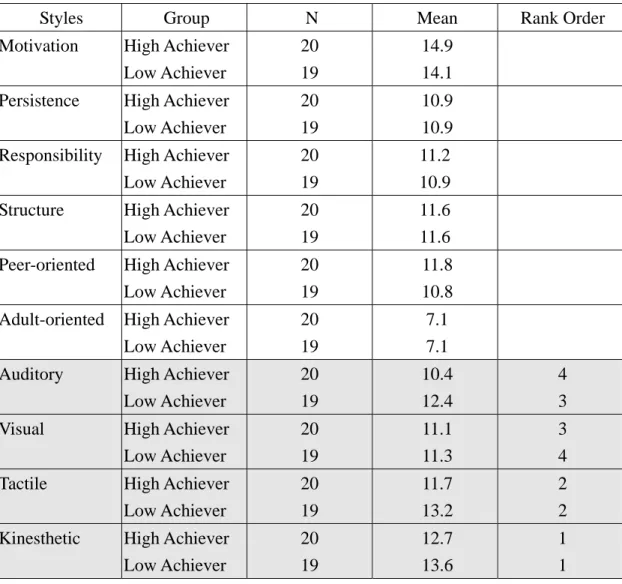
With regard to the receptive skills, Table 3-9 shows that similarly, there was almost no difference in reading comprehension between the high and low achievers except for auditory and tactile learning. Also, the high achievers tended to be more motivated, responsible, and peer-oriented. Similar to the previous results, the high achievers did not show a strong tendency for all the perceptual learning styles.
Table 3-9 Learning Styles of the High and Low Achievers in Receptive Skills
Styles Group N Mean Rank Order
Motivation High Achiever Low Achiever
20 19
14.9 14.1 Persistence High Achiever
Low Achiever
20 19
10.9 10.9 Responsibility High Achiever
Low Achiever
20 19
11.2 10.9 Structure High Achiever
Low Achiever
20 19
11.6 11.6 Peer-oriented High Achiever
Low Achiever
20 19
11.8 10.8 Adult-oriented High Achiever
Low Achiever
20 19
7.1 7.1 Auditory High Achiever
Low Achiever
20 19
10.4 12.4
4 3 Visual High Achiever
Low Achiever
20 19
11.1 11.3
3 4 Tactile High Achiever
Low Achiever
20 19
11.7 13.2
2 2 Kinesthetic High Achiever
Low Achiever
20 19
12.7 13.6
1 1
Table 3-10 shows the learning styles of the high and low achievers in oral production. As can be seen in Table 3-10, the high achievers were more motivated, responsible, peer-oriented, adult-oriented, and structure-oriented in speaking.
Besides, there was little difference in oral production between the high and low achievers except for tactile learning.
Table 3-10 Learning Styles of the High and Low Achievers in Oral Production
Styles Group N Mean Rank Order
Motivation High Achiever Low Achiever
26 17
14.8 14.4 Persistence High Achiever
Low Achiever
26 17
10.8 10.8 Responsibility High Achiever
Low Achiever
26 17
11.7 11.6 Structure High Achiever
Low Achiever
26 17
11.7 11.4 Peer-oriented High Achiever
Low Achiever
26 17
11.6 10.5 Adult-oriented High Achiever
Low Achiever
26 17
7.2 6.3 Auditory High Achiever
Low Achiever
26 17
10.8 11.9
4 3 Visual High Achiever
Low Achiever
26 17
11.6 11.9
2 3 Tactile High Achiever
Low Achiever
26 17
11.6 13.1
2 2 Kinesthetic High Achiever
Low Achiever
26 17
12.4 13.8
1 1
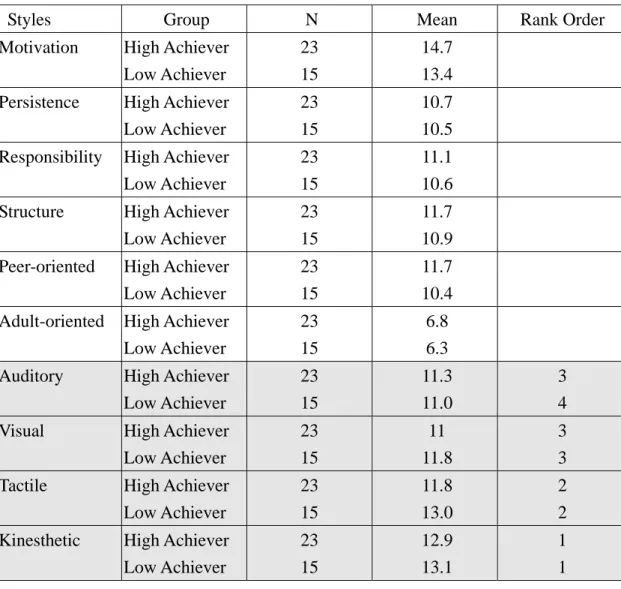
As shown in Table 3-11, the high achievers were more motivated, responsible, peer-oriented, adult-oriented, and structure-oriented in writing. Nevertheless, there was still little difference in written production between the high and low achievers with an exception of tactile learning.
Table 3-11 shows the learning styles of the high and low achievers in written production:
Table 3-11 Learning Styles of the High and Low Achievers in Written Production
Styles Group N Mean Rank Order
Motivation High Achiever Low Achiever
23 15
14.7 13.4 Persistence High Achiever
Low Achiever
23 15
10.7 10.5 Responsibility High Achiever
Low Achiever
23 15
11.1 10.6 Structure High Achiever
Low Achiever
23 15
11.7 10.9 Peer-oriented High Achiever
Low Achiever
23 15
11.7 10.4 Adult-oriented High Achiever
Low Achiever
23 15
6.8 6.3 Auditory High Achiever
Low Achiever
23 15
11.3 11.0
3 4 Visual High Achiever
Low Achiever
23 15
11 11.8
3 3 Tactile High Achiever
Low Achiever
23 15
11.8 13.0
2 2 Kinesthetic High Achiever
Low Achiever
23 15
12.9 13.1
1 1
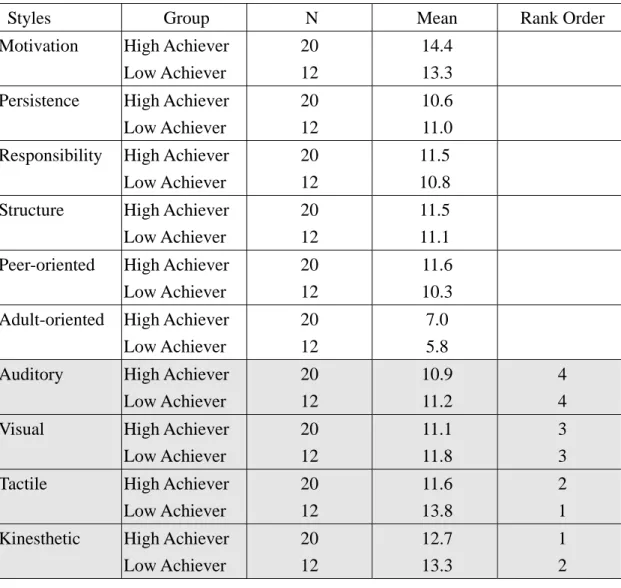
As shown in Table 3-12, the high achievers in productive skills were more motivated, responsible, peer-oriented, adult-oriented, and structure-oriented.
Likewise, there was little difference in productive skills between the high and low achievers apart from tactile learning.
Table 3-12 Learning Styles of the High and Low Achievers in Productive Skills
Styles Group N Mean Rank Order
Motivation High Achiever Low Achiever
20 12
14.4 13.3 Persistence High Achiever
Low Achiever
20 12
10.6 11.0 Responsibility High Achiever
Low Achiever
20 12
11.5 10.8 Structure High Achiever
Low Achiever
20 12
11.5 11.1 Peer-oriented High Achiever
Low Achiever
20 12
11.6 10.3 Adult-oriented High Achiever
Low Achiever
20 12
7.0 5.8 Auditory High Achiever
Low Achiever
20 12
10.9 11.2
4 4 Visual High Achiever
Low Achiever
20 12
11.1 11.8
3 3 Tactile High Achiever
Low Achiever
20 12
11.6 13.8
2 1 Kinesthetic High Achiever
Low Achiever
20 12
12.7 13.3
1 2
As shown in Table 3-13, the high achievers in holistic skills were more motivated, responsible, peer-oriented, adult-oriented, and structure-oriented.
Nevertheless, apart from auditory and tactile learning, there was almost no difference between the high and low achievers.
Table 3-13 Learning Styles of the High and Low Achievers in Holistic Skills
Styles Group N Mean Rank Order
Motivation High Achiever Low Achiever
21 21
14.8 14.1 Persistence High Achiever
Low Achiever
21 21
10.9 10.8 Responsibility High Achiever
Low Achiever
21 21
11.2 11.0 Structure High Achiever
Low Achiever
21 21
11.7 11.5 Peer-oriented High Achiever
Low Achiever
21 21
11.6 10.8 Adult-oriented High Achiever
Low Achiever
21 21
7.1 6.8 Auditory High Achiever
Low Achiever
21 21
10.4 12.4
4 3 Visual High Achiever
Low Achiever
21 21
11.0 11.2
3 4 Tactile High Achiever
Low Achiever
21 21
11.7 13.2
2 2 Kinesthetic High Achiever
Low Achiever
21 21
12.7 13.3
1 1
In sum, based on the results concerning learning styles of the high and low achievers, it was found that the high achievers were more motivated than their low-achieving peers in all the skills. Also, the high achievers tended to be more adult-oriented in listening, speaking, productive, and holistic skills. However, it can be seen that there was no big difference between the two groups in many ways.
Therefore, further statistic analyses will be performed to explore the differences in leaning styles between the two groups. With regard to the perceptual preferences,
there was little difference between high achievers and low achievers, either. In addition, kinesthetic learning was found to be the most preferred style for both the high and low achievers in all the skills14, which was in agreement with the results of descriptive statistics of the learning style preferences (See Table 3-6). Moreover, the high achievers did not show a strong preference for all perceptual styles, which needs further investigation to find out the causes.
3.4.3 Descriptive Statistics of Multiple Intelligences
The results of the descriptive statistics of the students’ multiple intelligences are shown in Table 3-14. Obviously, interpersonal intelligence was the strongest intelligence (M= 34.76) whereas naturalist intelligence was the weakest intelligence (M=25.52) among the eight intelligences for all the subjects. In between were musical intelligence (M=34.54), spatial intelligence (M=33.36), intrapersonal intelligence (M=32.93) , bodily-kinesthetic intelligence (M=32.13), linguistic intelligence (M=31.01), and logical-mathematical intelligence (M=28.47).
Table 3-14 Descriptive Statistics of the Subjects’ Multiple Intelligences
Multiple Intelligences Number Mean SD Rank Order
Interpersonal 107 34.76 5.98 1
Musical 107 34.54 7.24 2
Spatial 107 33.36 6.02 3
Intrapersonal 107 32.93 5.93 4
Bodily-Kinesthetic 107 32.13 8.18 5
Linguistic 107 31.01 5.64 6
Logical-Mathematical 107 28.47 6.44 7
Naturalist 107 25.52 7.16 8
Notes: The maximum mean for each style is 48, and the minimum mean is 8.
14 There was only an exception to it: the low achievers preferred tactile instead of kinesthetic learning he most (See Table 3-12).
As Table 3-15 indicates, there was a slight difference in multiple intelligences between the high and low achievers in listening comprehension. In fact, the biggest difference between the two groups fell on logical-mathematical intelligence (23.9<
30.8). On the other hand, for the high achievers, musical (M=35), interpersonal (M=33.9), and intrapersonal intelligence (M=32.3) were obvious while naturalist (M=21.3) and logical-mathematical (M=23.9) were not significant. Compared with their low-achieving peers, the high achievers showed more bodily-kinesthetic, musical, and intrapersonal intelligences.
Table 3-15 Multiple Intelligences of the High and Low Achievers in Listening Comprehension
Multiple Intelligences Group N M Rank Order
Linguistic High Achiever Low Achiever
16 18
28.7 31.4
6 5 Logical-Mathematical High Achiever
Low Achiever
16 18
23.9 30.8
7 7
Spatial High Achiever
Low Achiever
16 18
31.6 33.1
5 2 Bodily-Kinesthetic High Achiever
Low Achiever
16 18
32.2 31.1
4 6 Musical High Achiever
Low Achiever
16 18
35 32.1
1 3 Interpersonal High Achiever
Low Achiever
16 18
33.9 33.9
2 1 Intrapersonal High Achiever
Low Achiever
16 18
32.3 32
3 4 Naturalist High Achiever
Low Achiever
16 18
21.3 24.6
8 8
As Table 3-16 shows, there was a slight difference between the two groups again, and the biggest difference lay in logical-mathematical intelligence again (24.5< 30.7).
Similarly, for the high achievers, their interpersonal (M=35.1), musical (M=34.9), and intrapersonal intelligences (M=32) were strong while naturalist (M=22.7) and logical-mathematical intelligences (M=24.5) were weak. In general, the high achievers showed a stronger tendency for musical, and interpersonal intelligences.
Table 3-16 Multiple Intelligences of the High and Low Achievers in Reading Comprehension
Multiple Intelligences Group N M Rank Order
Linguistic High Achiever Low Achiever
26 20
31.6 33
4 6 Logical-Mathematical High Achiever
Low Achiever
26 20
24.5 30.7
6 7
Spatial High Achiever
Low Achiever
26 20
30.9 34.9
5 1 Bodily-Kinesthetic High Achiever
Low Achiever
26 20
30.9 33.2
5 5
Musical High Achiever
Low Achiever
26 20
34.9 33.4
2 4 Interpersonal High Achiever
Low Achiever
26 20
35.1 34.4
1 2 Intrapersonal High Achiever
Low Achiever
26 20
32 34.1
3 3 Naturalist High Achiever
Low Achiever
26 20
22.7 28.4
7 8
As for the receptive skills, as Table 3-17 shows, the biggest difference between the two groups fell on logical-mathematical intelligence again (25.3< 31.5). Similar
to the results in listening and reading comprehension, musical (M=36.6), interpersonal (M=35.6), and intrapersonal intelligences (M=33.3) were strong for the high achievers while naturalist (M=23.2) and logical-mathematical (M=25.3) were weak. Besides, the high achievers showed a stronger tendency for bodily-kinesthetic, musical, interpersonal, and intrapersonal intelligences.
Table 3-17 Multiple Intelligences of the High and Low Achievers in Receptive Skills
Multiple Intelligences Group N M Rank Order
Linguistic High Achiever Low Achiever
20 19
32.2 32.8
6 4 Logical-Mathematical High Achiever
Low Achiever
20 19
25.3 31.5
7 7
Spatial High Achiever
Low Achiever
20 19
32.3 34.2
5 2 Bodily-Kinesthetic High Achiever
Low Achiever
20 19
33.2 31.7
4 7
Musical High Achiever
Low Achiever
20 19
36.6 32.2
1 5 Interpersonal High Achiever
Low Achiever
20 19
35.6 34.7
2 1 Intrapersonal High Achiever
Low Achiever
20 19
33.3 33.0
3 3 Naturalist High Achiever
Low Achiever
20 19
23.2 27.1
8 8
Table 3-18 shows that there was little difference between the two groups in oral production, with an exception of logical-mathematical intelligence (27.5< 31.4).
Different from the previous results in listening and reading comprehension, spatial intelligence (M=33.9) was one of the strong intelligences for the high achievers besides interpersonal (M=35.1) and musical (M=34.1) intelligences. On average, the high achievers showed stronger tendency in linguistic, spatial, musical, interpersonal,
and intrapersonal intelligences.
Table 3-18 Multiple Intelligences of the High and Low Achievers in Oral Production
Multiple Intelligences Group N M Rank Order
Linguistic High Achiever Low Achiever
26 17
30.8 30.1
6 7 Logical-Mathematical High Achiever
Low Achiever
26 17
27.5 31.4
7 6
Spatial High Achiever
Low Achiever
26 17
33.9 33.2
3 3 Bodily-Kinesthetic High Achiever
Low Achiever
26 17
31.3 32
5 5
Musical High Achiever
Low Achiever
26 17
34.1 33.5
2 2 Interpersonal High Achiever
Low Achiever
26 17
35.1 33.9
1 1 Intrapersonal High Achiever
Low Achiever
26 17
32.7 32.4
4 4 Naturalist High Achiever
Low Achiever
26 17
23.8 26.4
8 8
Table 3-19 shows that there was a slight difference between the two groups in written production, and the biggest difference fell on logical-mathematical intelligence again (26< 30.5). Similar to the results found in oral production, musical (M=36.3), interpersonal (M=35.9), and spatial intelligences (M=34) were strong for high achievers. Besides, high achievers showed a stronger tendency for bodily-kinesthetic, musical, interpersonal, and intrapersonal intelligences.
Table 3-19 shows the multiple intelligences between the high and low achievers in written production:
Table 3-19 Multiple Intelligences Between the High and Low Achievers in Written Production
Multiple Intelligences Group N M Rank Order
Linguistic High Achiever Low Achiever
23 15
30.6 31.7
6 3 Logical-Mathematical High Achiever
Low Achiever
23 15
26 30.5
7 7
Spatial High Achiever
Low Achiever
23 15
34 35.6
3 1 Bodily-Kinesthetic High Achiever
Low Achiever
23 15
33.7 30.6
4 6
Musical High Achiever
Low Achiever
23 15
36.3 31.4
1 4 Interpersonal High Achiever
Low Achiever
23 15
35.9 32.1
2 2 Intrapersonal High Achiever
Low Achiever
23 15
32.5 31
5 4 Naturalist High Achiever
Low Achiever
23 15
24.3 26.7
8 8
With regard to the productive skills, as Table 3-20 shows, little difference was found between the two groups except for naturalist intelligence (22.5< 28.7). For the high achievers, their musical (M=36.8), interpersonal (M=35.8), and intrapersonal intelligences (M=33.6) were whereas naturalist (M=22.5) and logical-mathematical (M=27.9) were weak. Also, the high achievers showed more bodily-kinesthetic, musical, interpersonal, and intrapersonal intelligences.
Table 3-20 Multiple Intelligences of the High and Low Achievers in Productive Skills
Multiple Intelligences Group N M Rank Order
Linguistic High Achiever Low Achiever
20 12
30.2 30.9
6 7 Logical-Mathematical High Achiever
Low Achiever
20 12
27.9 31.4
7 5
Spatial High Achiever
Low Achiever
20 12
32.8 33.7
3 1 Bodily-Kinesthetic High Achiever
Low Achiever
20 12
30.9 31.6
5 4
Musical High Achiever
Low Achiever
20 12
35.6 33.3
1 2 Interpersonal High Achiever
Low Achiever
20 12
33.6 31.4
2 5 Intrapersonal High Achiever
Low Achiever
20 12
32.2 32.7
4 3 Naturalist High Achiever
Low Achiever
20 12
22.5 28.7
8 8
With regard to the holistic skills, there was no big difference between the two groups, as shown in Table 3-21. The biggest difference fell on logical-mathematical intelligence (25.4< 31.8). Again, for the high achievers, their musical (M=36.8), interpersonal (M=35.8), and intrapersonal intelligences (M=33.6) were strong whereas naturalist (M=23.1) and logical-mathematical intelligences (M=25.4) were weak. Besides, the high achievers showed more bodily-kinesthetic, musical, interpersonal, and intrapersonal intelligences.
Table 3-21 Multiple Intelligences of the High and Low Achievers in Holistic Skills
Multiple Intelligences Group N M Rank Order
Linguistic High Achiever Low Achiever
21 21
32.1 32.8
6 5 Logical-Mathematical High Achiever
Low Achiever
21 21
25.4 31.8
7 7
Spatial High Achiever
Low Achiever
21 21
32.5 34.6
5 2 Bodily-Kinesthetic High Achiever
Low Achiever
21 21
33.2 31.9
4 6
Musical High Achiever
Low Achiever
21 21
36.8 33.1
1 3 Interpersonal High Achiever
Low Achiever
21 21
35.8 35.2
2 1 Intrapersonal High Achiever
Low Achiever
21 21
33.6 33.1
3 3 Naturalist High Achiever
Low Achiever
21 21
23.1 27.3
8 8
To sum up, according to the results concerning multiple intelligences of the high and low achievers, it was found that musical intelligence was the strongest intelligence for high achievers in all the skills (except for reading skills) while logical-mathematical and naturalist intelligences were the weak intelligences for them. On the other hand, for the low achievers, spatial and interpersonal intelligences were the strong intelligences while logical-mathematical, naturalist and linguistic15 intelligences were the weak intelligences for them. Moreover, the high achievers showed more musical and interpersonal intelligences16 whereas the low achievers showed stronger logical-mathematical, naturalist and spatial intelligences17. Besides, based on the high
15 Linguistic intelligence was the weak intelligence for the low achievers in reading and speaking (Tables 16 & 18).
16 The high achievers showed more interpersonal intelligence in all the skills except for the listening skill (33.9= 33.9, Table 3-15).
17 The low achievers showed more spatial intelligence in all the skills except for the speaking skill (33.2<33.9, Table 3-18).
achievers’ top/ bottom 3 strong intelligences in every skill, it was found that musical, interpersonal, and intrapersonal intelligences were positively related to the subjects’
English proficiency while logical-mathematical and naturalist intelligences were negatively related to their English proficiency. To confirm the results above, further statistic analyses will be presented in the next chapter.
3.5 Summary of Chapter Three
In this chapter, the researcher has introduced the subjects, methodology, procedures, and the results of descriptive statistics. In the next chapter, more in-depth comparisons will be made and the findings will be further discussed.