The Hong Kong Debt Market in 2018
by the Financial Infrastructure Department
The international bond market was weighed down for most of 2018 by the tightened monetary policy stance of the US Federal Reserve. Bond markets in emerging market economies were also hit by capital outfows, the escalating US-China trade tensions, and a slowdown in the Mainland economy. In Hong Kong, the total issuance volume of Hong Kong dollar debt instruments rose, mainly due to the increased issuance of Exchange Fund Bills and Notes. The Government also introduced a number of initiatives to support the development of the bond market.
Overview of the international bond market
Global economic expansion continued in 2018, although becoming less synchronised. In developed economies, sovereign bond yields rose gradually during the frst three quarters, but decreased markedly in the fourth quarter (Chart 1). In the US, the US Federal Reserve (Fed) raised interest rates four times and continued the gradual normalisation of its balance sheet. Short-term US Treasury yields rose notably, while long-term yields increased to a lesser extent, resulting in a fattening of the yield curve during the year and, indeed, an inverted yield curve over some maturities towards the end of the year. In Europe, the European Central Bank ended its net asset purchase programme in December, while maintaining an accommodative monetary policy. As a result, government bond yields of major European economies decreased moderately in 2018.
Sovereign bond yields in emerging markets had surged since the second quarter, before returning to lower levels in the fourth quarter in tandem with US treasury yields (Chart 1). In emerging Asia, capital outfows from debt market were observed amid the tightening US monetary policy stance and higher yields in the US. Meanwhile, investors have become more risk averse amid continuing uncertainties over
US-China trade tensions and an economic slowdown in Mainland China, which weighed on the bond market.
CHART 1
Average borrowing costs in developed and emerging markets
% %
1.8 5.3
1.7 5.2
1.6 5.1
1.5 5.0
1.4 4.9
1.3 4.8
1.2 4.7
1.1 4.6
1.0 4.5
Jan 18 Apr 18 Jul 18 Oct 18
BofA ML G7 Govt (LHS) (%) ICE EM Sovereign Bond Index (RHS) (%)
Notes:
1. Average yields of the BofA Merrill Lynch G7 Government index are used as proxies to the yield levels of developed markets.
2. Average yields of ICE BofA Merrill Lynch emerging market sovereign bond index are used as proxies to the yield levels of emerging markets.
Sources: Thomson Reuters, Bloomberg, Bank of America Merrill Lynch.
Hong Kong Debt Market Review
Since the global fnancial crisis, a massive amount of funds have fowed into the Hong Kong dollar. In 2018, however, there were signs of capital outfows,
CHART 2
Key tenors of US dollar/Hong Kong dollar basis spreads
Basis Points
0 -5 -10 -15 -20 -25 -30 -35
Jan 18 Apr 18 Jul 18 Oct 18
2 year 3 year 5 year 10 year
Source: Bloomberg.
5
especially in the second and third quarters. As the aggregate balance declined, Hong Kong dollar interest rates rose across the board. Correspondingly, the Government Bond yield curve also showed an upward trend during the year. The negative yield spread between US Treasuries and Hong Kong Government Bonds narrowed, making it relatively more attractive to invest in Hong Kong dollar bonds.
Despite the capital outfows, liquidity remained ample during the year. Hong Kong dollar debt issuance increased for the tenth consecutive year to HK$3.56 trillion, a rise of 6.6% over 2017, largely driven by increased issuance of Exchange Fund Bills and Notes.
Overseas entities
Overseas entities are cost sensitive and their issuance tends to be opportunistic by nature. Although Hong Kong dollar interest rates, such as Hong Kong Interbank Ofered Rate (HIBOR) and Government Bond yields were lower than their US dollar counterparts, the US dollar/Hong Kong dollar basis spreads remained negative during the year (Chart 2). As a result, the Hong Kong dollar market was less attractive for overseas issuers seeking US dollar funds through the Hong Kong market, compared with tapping the US dollar market directly. A decrease in bond issuance by overseas issuers, including mainly fnancial institutions and corporates, was observed during the year. On the other hand, multilateral development banks, led by the World Bank and the Asian Development Bank, tapped the market in 2018 and increased their issuance.
Local corporates and authorized institutions (AIs)
On the back of robust economic growth, local corporates expanded their funding scale in the local debt market, with the issuance volume increasing by 35% in 2018 year on year. Many large corporates had access to the international bond market, and would tap the Hong Kong dollar market only when the cost was low. “Pre-refnancing” activities were buoyant in the frst half of the year to take advantage of the low local interest rates. However, worries about US- China trade tensions and a slowdown in the Mainland economy dampened bond market sentiment in the second half. The rise in interest rates also meant there was less chance of obtaining cheap funding from the Hong Kong dollar bond market. Likewise, statutory bodies and government-owned corporations reduced their reliance on the bond market because they remained well-funded. AI’s fund-raising activities to support their funding needs also decreased by 6%
year on year, while some chose to re-fnance by issuing papers in US dollars.
Other developments
Since its introduction, Bond Connect has become an important channel through which international investors gain exposure to the Mainland bond market while taking advantage of the market infrastructure and fnancial services in Hong Kong. As at end-2018, 503 investors had registered as eligible Bond Connect investors. Daily turnover averaged RMB3.5 billion in 2018, compared with RMB1.5 billion during its initial launch in July 2017. In August, several major enhancements were made, including the full implementation of the real-time delivery versus payment settlement model, which substantially reduces settlement risk and enhances efciency, and is critical in drawing major overseas institutional investors to Bond Connect. Other enhancements included the launch of block trade functionality and the State Council’s announcement of a tax waiver for overseas investors investing in the Mainland onshore bond market. In November, an additional electronic trading platform was announced to be added to Bond Connect, ofering more choices to investors. The convenience and fexibility ofered by Bond Connect,
coupled with the enhancements this year, prepared the ground for Mainland bonds to be included in major fxed income indices, thereby accelerating the allocation to renminbi assets by passive portfolio managers and active managers alike.
In early 2018, the Government and the HKMA announced a number of initiatives designed to promote bond issuances and the development of the bond market in Hong Kong. The initiatives included the launch of a three-year Pilot Bond Grant Scheme to attract local, Mainland and overseas enterprises to issue bonds in Hong Kong. The Scheme covers eligible enterprises issuing bonds in Hong Kong for the frst time. The grant amount for each bond issue is equivalent to half the eligible issuance expenses, up to HK$2.5 million if the bond, its issuer or its guarantor(s) possesses a credit rating by a rating agency recognised by the HKMA; or HK$1.25 million if none of the bond, its issuer or its guarantor(s) possesses a credit rating by a rating agency recognised by the HKMA.
In addition, the Qualifying Debt Instruments (QDI) Scheme was improved by (i) exempting profts tax from debt instruments, regardless of their tenors;
and (ii) allowing debt instruments listed on the Stock Exchange of Hong Kong Limited as well as for instruments lodged with and cleared by the Central Moneymarkets Unit, to be qualifed for tax exemption.
The new arrangements apply to QDIs issued on or after 1 April 2018.
In November 2018, the Legislative Council approved the Government Green Bond Programme. Its primary objective is to promote the development of green fnance in Hong Kong by encouraging issuers to arrange fnancing for their green projects through Hong Kong’s capital markets and growing the local green investor base.
Government Bond (GB) Programme
The HKMA continued to implement the GB Programme to promote further sustainable development of the local bond market. At the end of 2018, the total outstanding amount of 12 issues of institutional bonds reached HK$87.1 billion. The Government has also issued three Islamic bonds under the GB Programme, each with an issuance size of US$1 billion.
During the year, the Government issued the third batch of Silver Bond, an infation-linked bond with a minimum annual interest rate of 3%, aimed at Hong Kong residents aged 65 or above. The size of the issuance was HK$3 billion, with a tenor of three years. It was also the frst time securities brokers participated in the bond placement. The number of valid applications was 45,488, with total subscription of more than HK$6.2 billion. The results were very satisfactory against the backdrop of rising bank deposit rates, and demonstrated the immense potential of the silver market that the fnancial sector could tap into.
Looking ahead
Looking into 2019, the risks and uncertainties that negatively afected the bond market in 2018, such as tightened fnancial conditions, capital outfows, US- China trade tensions, and a slowdown in the Mainland economy, could continue. However, the US Fed has signalled a more gradual pace of rate hikes, and hence investor sentiment may improve. In addition, local infrastructure projects may create new opportunities for bond fnancing. The HKMA will continue to support the development of the local bond market through the implementation of various initiatives.
APPENDIX (see notes)
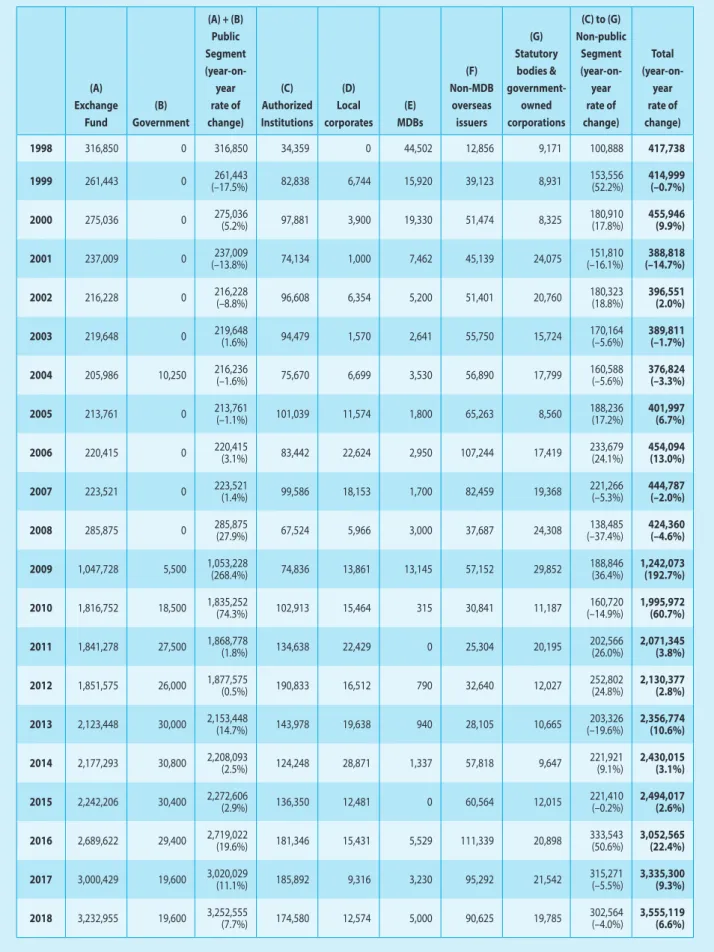
Table B1: Issuance of Hong Kong dollar debt instruments (in HK$ million)
(A) Exchange
Fund
(B) Government
(A) + (B) Public Segment (year-on- year rate of change)
(C) Authorized Institutions
(D) Local corporates
(E) MDBs
(F) Non-MDB
overseas issuers
(G) Statutory
bodies &
government- owned corporations
(C) to (G) Non-public
Segment (year-on- year rate of change)
Total (year-on-
year rate of change)
1998 316,850 0 316,850 34,359 0 44,502 12,856 9,171 100,888 417,738
1999 261,443 0 261,443
(–17.5%) 82,838 6,744 15,920 39,123 8,931 153,556
(52.2%) 414,999 (–0.7%)
2000 275,036 0 275,036
(5.2%) 97,881 3,900 19,330 51,474 8,325 180,910
(17.8%) 455,946 (9.9%)
2001 237,009 0 237,009
(–13.8%) 74,134 1,000 7,462 45,139 24,075 151,810
(–16.1%) 388,818 (–14.7%)
2002 216,228 0 216,228
(–8.8%) 96,608 6,354 5,200 51,401 20,760 180,323
(18.8%) 396,551 (2.0%)
2003 219,648 0 219,648
(1.6%) 94,479 1,570 2,641 55,750 15,724 170,164
(–5.6%) 389,811 (–1.7%)
2004 205,986 10,250 216,236
(–1.6%) 75,670 6,699 3,530 56,890 17,799 160,588
(–5.6%) 376,824 (–3.3%)
2005 213,761 0 213,761
(–1.1%) 101,039 11,574 1,800 65,263 8,560 188,236
(17.2%) 401,997 (6.7%)
2006 220,415 0 220,415
(3.1%) 83,442 22,624 2,950 107,244 17,419 233,679
(24.1%) 454,094 (13.0%)
2007 223,521 0 223,521
(1.4%) 99,586 18,153 1,700 82,459 19,368 221,266
(–5.3%) 444,787 (–2.0%)
2008 285,875 0 285,875
(27.9%) 67,524 5,966 3,000 37,687 24,308 138,485
(–37.4%) 424,360 (–4.6%) 2009 1,047,728 5,500 1,053,228
(268.4%) 74,836 13,861 13,145 57,152 29,852 188,846
(36.4%) 1,242,073 (192.7%) 2010 1,816,752 18,500 1,835,252
(74.3%) 102,913 15,464 315 30,841 11,187 160,720
(–14.9%) 1,995,972 (60.7%) 2011 1,841,278 27,500 1,868,778
(1.8%) 134,638 22,429 0 25,304 20,195 202,566
(26.0%) 2,071,345 (3.8%) 2012 1,851,575 26,000 1,877,575
(0.5%) 190,833 16,512 790 32,640 12,027 252,802
(24.8%) 2,130,377 (2.8%) 2013 2,123,448 30,000 2,153,448
(14.7%) 143,978 19,638 940 28,105 10,665 203,326
(–19.6%) 2,356,774 (10.6%) 2014 2,177,293 30,800 2,208,093
(2.5%) 124,248 28,871 1,337 57,818 9,647 221,921
(9.1%) 2,430,015 (3.1%) 2015 2,242,206 30,400 2,272,606
(2.9%) 136,350 12,481 0 60,564 12,015 221,410
(–0.2%) 2,494,017 (2.6%) 2016 2,689,622 29,400 2,719,022
(19.6%) 181,346 15,431 5,529 111,339 20,898 333,543
(50.6%) 3,052,565 (22.4%) 2017 3,000,429 19,600 3,020,029
(11.1%) 185,892 9,316 3,230 95,292 21,542 315,271
(–5.5%) 3,335,300 (9.3%) 2018 3,232,955 19,600 3,252,555
(7.7%) 174,580 12,574 5,000 90,625 19,785 302,564
(–4.0%) 3,555,119 (6.6%)
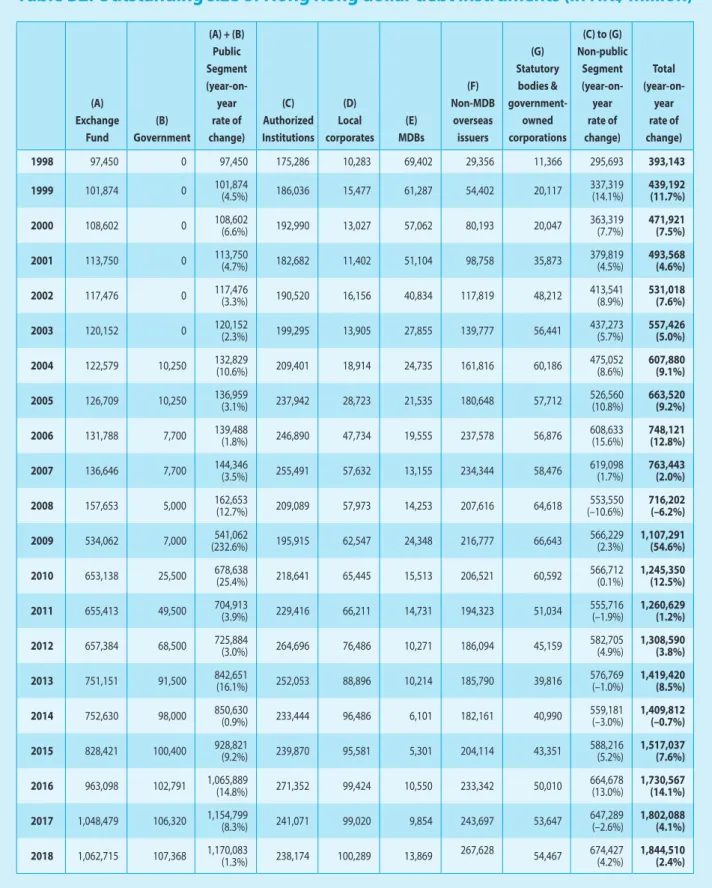
Table B2: Outstanding size of Hong Kong dollar debt instruments (in HK$ million)
(A) Exchange
Fund
(B) Government
(A) + (B) Public Segment (year-on- year rate of change)
(C) Authorized Institutions
(D) Local corporates
(E) MDBs
(F) Non-MDB
overseas issuers
(G) Statutory
bodies &
government- owned corporations
(C) to (G) Non-public
Segment (year-on- year rate of change)
Total (year-on-
year rate of change)
1998 97,450 0 97,450 175,286 10,283 69,402 29,356 11,366 295,693 393,143
1999 101,874 0 101,874
(4.5%) 186,036 15,477 61,287 54,402 20,117 337,319
(14.1%) 439,192 (11.7%)
2000 108,602 0 108,602
(6.6%) 192,990 13,027 57,062 80,193 20,047 363,319
(7.7%) 471,921 (7.5%)
2001 113,750 0 113,750
(4.7%) 182,682 11,402 51,104 98,758 35,873 379,819
(4.5%) 493,568 (4.6%)
2002 117,476 0 117,476
(3.3%) 190,520 16,156 40,834 117,819 48,212 413,541
(8.9%) 531,018 (7.6%)
2003 120,152 0 120,152
(2.3%) 199,295 13,905 27,855 139,777 56,441 437,273
(5.7%) 557,426 (5.0%)
2004 122,579 10,250 132,829
(10.6%) 209,401 18,914 24,735 161,816 60,186 475,052
(8.6%) 607,880 (9.1%)
2005 126,709 10,250 136,959
(3.1%) 237,942 28,723 21,535 180,648 57,712 526,560
(10.8%) 663,520 (9.2%)
2006 131,788 7,700 139,488
(1.8%) 246,890 47,734 19,555 237,578 56,876 608,633
(15.6%) 748,121 (12.8%)
2007 136,646 7,700 144,346
(3.5%) 255,491 57,632 13,155 234,344 58,476 619,098
(1.7%) 763,443 (2.0%)
2008 157,653 5,000 162,653
(12.7%) 209,089 57,973 14,253 207,616 64,618 553,550
(–10.6%) 716,202 (–6.2%)
2009 534,062 7,000 541,062
(232.6%) 195,915 62,547 24,348 216,777 66,643 566,229
(2.3%) 1,107,291 (54.6%)
2010 653,138 25,500 678,638
(25.4%) 218,641 65,445 15,513 206,521 60,592 566,712
(0.1%) 1,245,350 (12.5%)
2011 655,413 49,500 704,913
(3.9%) 229,416 66,211 14,731 194,323 51,034 555,716
(–1.9%) 1,260,629 (1.2%)
2012 657,384 68,500 725,884
(3.0%) 264,696 76,486 10,271 186,094 45,159 582,705
(4.9%) 1,308,590 (3.8%)
2013 751,151 91,500 842,651
(16.1%) 252,053 88,896 10,214 185,790 39,816 576,769
(–1.0%) 1,419,420 (8.5%)
2014 752,630 98,000 850,630
(0.9%) 233,444 96,486 6,101 182,161 40,990 559,181
(–3.0%) 1,409,812 (–0.7%) 2015 828,421 100,400 928,821
(9.2%) 239,870 95,581 5,301 204,114 43,351 588,216
(5.2%) 1,517,037 (7.6%) 2016 963,098 102,791 1,065,889
(14.8%) 271,352 99,424 10,550 233,342 50,010 664,678
(13.0%) 1,730,567 (14.1%) 2017 1,048,479 106,320 1,154,799
(8.3%) 241,071 99,020 9,854 243,697 53,647 647,289
(–2.6%) 1,802,088 (4.1%) 2018 1,062,715 107,368 1,170,083
(1.3%) 238,174 100,289 13,869 267,628 54,467 674,427
(4.2%) 1,844,510 (2.4%)
Note on the tables:
The debt securities statistics are reclassifed in accordance with the latest international statistical standards set forth in the Handbook of Securities Statistics published by the Bank for International Settlements, International Monetary Fund and European Central Bank. They may not be comparable with statistics previously published in this report.
CHART B2
Proportions of outstanding Hong Kong dollar debt instruments (by type of issuers)
% 100
80
60
40
20
0 1998 1999 2000 2001 2002 2003 2004 2005 2006 2007 2008 2009 2010 2011 2012 2013 2014 2015 2016 2017 2018
Exchange Fund Government Authorized Institutions Local corporates MDBs
Non-MDB overseas issuers
Statutory bodies & government-owned corporations CHART B1
Proportions of Hong Kong dollar debt issuance activities (by type of issuers)
%
100 Exchange Fund
Government
80 Authorized Institutions
Local corporates MDBs 60
Non-MDB overseas issuers
Statutory bodies & government-owned corporations 40
20
0 1998 1999 2000 2001 2002 2003 2004 2005 2006 2007 2008 2009 2010 2011 2012 2013 2014 2015 2016 2017 2018
Notes:
1. Authorized institutions include licensed banks, restricted licence banks and deposit-taking companies.
2. Multilateral Development Banks (MDBs) refer to the Asian Development Bank, the Council of Europe Development Bank (formerly known as the Council of Europe Social Development Fund), the European Company for the Financing of Railroad Rolling Stock, the European Investment Bank, the European Bank for Reconstruction and Development, the Inter-American Development Bank, the International Bank for Reconstruction and Development, the International Finance Corporation, the African Development Bank, the Nordic Investment Bank, and the CAF - Development Bank of Latin America. Income earned on Hong Kong dollar debt securities issued by the MDBs is exempt from profts tax.
3. Statutory bodies and government-owned corporations include Bauhinia Mortgage-backed Securities Limited, The Hong Kong Mortgage Corporation, Airport Authority Hong Kong, Hong Kong Link 2004 Limited, Kowloon-Canton Railway Corporation, MTR Corporation Limited, Hong Kong Interbank Clearing Limited, Urban Renewal Authority, Hong Kong Housing Society, and the Hong Kong Science and Technology Parks Corporation. It should be noted that while the issuers are public bodies in the legal sense, they are typically considered as non-public issuers by the market. Hence, they are categorised under the “non-public” segment in the tables above.
4. Figures may not add up to total because of rounding.
5. The debt securities statistics are reclassifed in accordance with the latest international statistical standards set forth in the Handbook of Securities Statistics published by the Bank for International Settlements, International Monetary Fund and European Central Bank. They may not be comparable with statistics previously published in this report.