I
國立臺灣大學工學院化學工程學研究所 碩士論文
Department of Chemical Engineering College of Engineering
National Taiwan University Master Thesis
水熱法合成尖晶石結構之鋰鈦氧負極材料
Spinel Li4Ti5O12 Synthesis via Hydrothermal Process and its Electrochemical Study
斐爾文
Erwin F. Rodriguez Tolava
指導教授:吳乃立 博士 Advisor: Nae-Lih Wu, Ph.D.
中華民國 100 年 6 月 June, 2011
I
Acknowledgment
This thesis would not have been possible unless the support of many people. First of all, I would like to express my profound gratefulness to my supervisor, Prof.
Dr. Nae-Lih Wu who made possible my study in National Taiwan University and also was abundantly helpful, and offered invaluable assistance, support, and guidance to the present thesis. Also my deepest gratitude is to Assistant Prof. Dr.
Jerry Hsu who advised me during the writing. I would like to thank the Industrial
Technology Research Institute ITRI for permitting me used its facilities. I am also indebted with National Taiwan University NTU for giving me the opportunity to study in its classrooms.
I indeed acknowledge and extend my heartfelt gratitude to all group members of Energy Materials Laboratory of NTU with whom this thesis would be not possible. Dr. 林彥伯 who contributed with his experience and extend knowledge in the electrochemical field. Dr. 嚴佑展 and Dr. 吳憲昌 which also contributed with their advices. The PhD students, 趙崧傑, 張志毅 and 楊乃璇 which helped me with their experience in research. 李榮川, 何維凱, 陳文勤 contributed with their sharing literature and experimental experience and analysis. Not forgetting 李富生, 林均潔, 翁郁婷, 林嘉男, 李光正, 陳炯宏, 簡廷育, Fatemeh, 沈運祥 which also contribute in some kind.
I would also like to convey thanks to the Department of Chemical Engineering NTU for providing financial means and laboratory facilities.
II
I wish to express my love and gratitude to my beloved families back in Bolivia;
for their understanding and endless love, through the duration of my studies.
I
摘要
水熱法為一較親近環境的液相合成法,且此方法有著控制合成顆粒尺
寸與形貌的潛力。包括奈米尺寸的方形粒子、奈米薄片及球形二次粒子,
這些不同形態的 Li4Ti5O12 (LTO),皆可以用 TiO2粉體與 LiOH 透過水熱水
溶性之鈦過氧化物與後續熱處理合成出來,且不同晶相之 TiO2皆被當作反
應的前驅物。由實驗結果顯示,LTO 顆粒型態受到反應溫度、鋰鈦化學計 量比、過氧化氫濃度以及 ph 值之影響甚大。藉由調整這些參數,可控制所 合成之粒子為具有均一粒徑分佈之奈米方形粒子、厚度小於 10nm 之奈米薄 片以及由均一奈米粒子所形成之球形二次粒子。奈米結構之 LTO 粉體能夠 縮短鋰離子之擴散路徑並提高電解液與電極之接觸面積,進而提升其在高 速充放電時之電容量。奈米薄片型態之 LTO 在高 C-rate 下具有極佳之效 能,在 50 C-rate 時能夠達到 75%之電容量(124mAh/g)。由實驗結果可知其 充放電效能為:奈米薄片>奈米方形粒子>奈米薄片所形成之二次粒子>
奈米方形粒子所形成之二次粒子。在大於 5 C-rate 之條件下,LTO 粉體具 極佳之充放電循環效能,且在充放電 900 圈之後僅損失 7%之電容量(奈米 方形粒子)。
關鍵字:水熱法、水溶性鈦過氧化物、Li4Ti5O12、形貌控制
II
Abstract
The hydrothermal synthesis is a soft-solution process, which operates near the ambient condition, and one of its greatest advantages is the possibility to synthesize materials with controlled the size and morphology. Nanocrystalline square particles, nano flakes or spherical secondary particles of Li4Ti5O12 (LTO) have been synthesized from TiO2 powder and LiOH via a hydrothermal treatment of water soluble titanium peroxide followed by thermal treatment. Titanium dioxide (TiO2) as a precursor has been employed in its different phases. The morphology of the resulting LTO products have strongly been found to depend on temperature, stoichiometric ratio of lithium titanium, concentration of hydrogen peroxide, and pH. With the latter parameters, the morphology was controlled obtaining square particles with narrow distribution size, nano flakes with less than 10 nm of thickness, and spherical secondary particles of the letter nano particles. The nanostructured LTO in powders serves to shorten the diffusion distance of lithium ion (path way) and enhances contact area between electrode and electrolyte, thus improving its high rate capability. Great performance at high C-rate has been delivered by the nano flakes morphology of LTO, which achieved 75 % (124 mAhg-1) of the capacity at 50 C-rate. The results show that the rate capability is in the following order: nano flakes powder > nano square particles powder > secondary particle of nano flakes powder > secondary particle of square particles powder. Upon cycling at 5 C-rate,
III
all the LTO powders show good cycle stability, losing less than 7 % capacity after 900 cycles (for the square particles).
Keyword: Hydrothermal synthesis, Soluble titanium peroxide, Li4Ti5O12, morphology control
IV
Table of Contents
摘要 ... I
Abstract ... II Table of Contents ... IV List of Figures ... VI List of Tables ... XII
Chapter 1 Introduction and Background ... 1
Chapter 2 Literature Review ... 4
2-1 Introduction to Li-ion Batteries ... 4
2-2 Li4Ti5O12 as Anode Material for Li-ion Batteries ... 7
2-3 Hydrothermal Synthesis of LTO ... 14
2-4 Aqueous Soluble Peroxo Titanate ... 17
Chapter 3 Experimental Part ... 20
3-1 Chemicals ... 20
3-2 Synthesis of LTO by Hydrothermal Treatment ... 22
3-3 Analysis and Characterization ... 26
3-3.1 Phase Identification ... 26
3-3.2 Morphology Observation ... 28
V
3-3.3 Surface Area Analysis ... 29
3-4 Electrochemical Test ... 29
3.4-2 Electrode Preparation and Assembling of the Coin Cell ... 29
3.4-2 Charge and Discharge Strategies ... 31
Chapter 4 Results and Discussions ... 32
4-1 Hydrothermal Synthesis: First Method ... 32
4-2 Hydrothermal Synthesis: Second Method ... 39
4-3 Hydrothermal Synthesis: Third Method... 41
4-3.1 The Formation of Titanium Peroxide and the Hydrothermal Process . 45 4-3.2 Morphology Control by Hydrothermal Synthesis ... 52
4-4 Summary ... 70
Chapter 5 Electrochemical Performance ... 73
5-1 Synthesis of the Li4Ti5O12 ... 74
5-1 Electrochemical Test ... 80
Chapter 6 Conclusion ... 89
References ... 91
VI
List of Figures
Figure 2-1 Ragone chart of the main secondary battery systems [8]. ... 5 Figure 2-2 Schematic description of the LIB based on the electrochemical
intercalation process (discharge). The anode is composed by graphite while cathode is a layered oxide [8]. ... 6 Figure 2-3 Voltage of LTO anode and various cathode materials [12]... 8 Figure 2-4 (a) Li4Ti5O12 spinel structure type. Blue tetrahedra represent lithium, and the green octahedral represent disorder lithium and titanium. (b) Li7Ti5O12, rock salt. Blue octahedral represent lithium, and green octahedral represents disorder lithium and titanium [14]. ... 9 Figure 2-5 The zero strain Li4+xTi5O12 material as a two-phase system is unstable at room temperature, and it is the fast Li insertion that leads to a kinetically induced effective two-phase reaction. The solid-solution-induced disorder, resulting from the mixed 8a/16c occupation, is most likely responsible for the high rate capabilities in Li4+xTi5O12.[15] ... 11 Figure 2-6 (d-1) High-resolution TEM images of 20 wt% pitch coated LTO showing penetration of carbon into the particle boundary and (d-2) high-
resolution TEM images of 20 wt% pitch coated LTO showing the carbon coating layer [20]. ... 12 Figure 2-7 LTO by the solution combustion approach. (a) TEM micrograph of the synthesized LTO. (b) The electrochemical performance [25]. ... 14
VII
Figure 2-8 LTO synthesized from AHTO by hydrothermal process (a) XRD pattern before and after the calcination of the powder (b) High Resolution TEM micrograph [29]. ... 16 Figure 2-9 TEM micrographs of as-prepared LTO [30]. ... 17 Figure 3-1 SEM micrographs of the TiO2 (a) P25 (b) Rutile PT-501, and (c) Anatase ST-01 ... 22 Figure 3-2 Schematic diagram of the hydrothermal synthesis: First Method ... 23 Figure 3-3 Schematic diagram of the hydrothermal process: Second Method .... 24 Figure 3-4 General schematic diagram of the hydrothermal process, the
concentration and conditions vary for the various experiments: Third Method .. 26 Figure 3-5 XRD patterns for the involved material in this study ... 27 Figure 3-6 Illustration of parts for the coin cells CR2032. ... 30 Figure 4-1 patterns of the powder before and after the calcination. First method of hydrothermal synthesis with water. ... 35 Figure 4-2 SEM micrograph of the powder. First method of hydrothermal
synthesis with water... 35 Figure 4-3 XRD patterns for the solvothermal synthesis SA. (a) and (c) LiOH concentration of 1.5 M, with calcination and without calcination respectively. (b) and (d) LiOH concentration of 3.5 M, with calcination and without calcination respectively. A and R indicates the main peaks for antase and rutile, respectively.
... 36 Figure 4-4 SEM micrograph of the powder. Second Method of solvothermal synthesis. ... 37
VIII
Figure 4-5 SEM micrographs for the hydrothermal and solvothermal synthesis for two calcination temperatures, 600 oC and 700 oC for 2 hours. The melting and growing of the particles could be observed at 700 oC. ... 38 Figure 4-6 XRD pattern of the powder synthesized by hydrothermal synthesis of AHTO. ... 40 Figure 4-7 SEM micrographs (a) AHTO; (b) powder synthesized by
hydrothermal treatment after calcination. ... 40 Figure 4-8 Plot of the conductivity and pH of the filtered water, and dilution factor of the sample vs. the step of process for 1 gram of precipitate. ... 43 Figure 4-9 Powder products obtained at 150 °C for 12 h hydrothermal synthesis at increasing step of treatment with deionized water: (a) XRD patterns of the powder products after calcination at 550 °C for 4 h, and (b) closer look of the XRD patterns. A, R, and L stand for anatase, rutile, and Li2TiO3, respectively. 44 Figure 4-10 SEM micrographs of the powder products obtained at 150 °C for 12 h hydrothermal synthesis, the samples were taken (a) right after the hydrothermal, (b) at the step 13th before the calcination, and (c) at the step 13th after the
calcination. ... 45 Figure 4-11 Clear solution of titanium peroxide ... 47 Figure 4-12 Hydrothermal processes were carried out 0.4 M LiOH, 0.1 M
TiO2(rutile, anatase, P25) and, 0.89 M H2O2, at various temperatures for 12 h. (a) Comparison of the XRD patterns for different precursors at 130 oC. (b)
Comparison of the XRD pattern for rutile at different temperatures. “R”
represents rutile in the Figure. ... 50
IX
Figure 4-13 Hydrothermal processes were carried out with the concentrations 0.4 M LiOH, 0.1 M TiO2 (rutile, anatase, and P25) and, 0.89 M H2O2 at 130 °C for 12 h. ... 51 Figure 4-14 XRD patterns of the powders obtained by hydrothermal treatment of 0.1 M titanium peroxide, 0.4 M LiOH, and 0.89 M H2O2 at 130 °C, 150 °C, and 180 °C for 12 h, before the calcination... 52 Figure 4-15 (a) and (b) SEM micrographs of the powder before the calcination;
the hydrothermal treatment was carried out with the concentrations 0.4 M LiOH, 0.1 M titanium peroxide and, 0.89 M H2O2, at 130 °C for 12 h. (c) TEM
micrograph of the powder... 53 Figure 4-16 Powder before the calcination; the hydrothermal treatment was carried out with the concentrations 0.4 M LiOH, 0.1 M titanium peroxide, and 0.89 M H2O2 at 180 °C for 12 h. (a) SEM micrograph, (b) TEM micrograph, and (c) HRTEM micrograph. ... 56 Figure 4-17 (a) and (b) SEM micrographs of the powder before the calcination;
the hydrothermal treatment was carried out with the concentrations 0.4 M LiOH, 0.1 M titanium peroxide, and 0.89 M H2O2, at 150 °C for 12 h. ... 57 Figure 4-18 XRD patterns of the powders synthesized by the hydrothermal
treatment at 180 °C for various stoichiometric ratios Li/Ti, before the calcination.
The concentration of hydroxyl and H2O2 were kept at 0.4 M and 0.89 M,
respectively. ... 59 Figure 4-19 SEM micrographs of the powder synthesized at 180 °C with various stoichiometric ratio Li/Ti. ... 60
X
Figure 4-20 XRD patterns of the powders synthesized by the hydrothermal treatment for various stoichiometric ratios Li/Ti, before the calcination. The concentration of hydroxyl and H2O2 were kept at 0.4 M and 0.89 M, respectively.
(a) at 150 °C (b) at 200 °C. ... 61 Figure 4-21 Powder products obtained by 12 h hydrothermal synthesis at 130 °C, for various concentration of H2O2 between 0.32 M to 1.63 M, the concentration for the reactants are 0.4 M LiOH, and 0.1 M, and titanium peroxide were kept constant, (a) and (b) XRD patterns before calcination. (c) SEM micrograph of the powder prepared with 0.89 and 0.47 M H2O2. ... 64 Figure 4-22 (a) XRD pattern of the powder synthesized by hydrothermal
treatment of titanium peroxide 0.125 M at 200 °C for 12 h for the concentration of hydroxyl of 0.4 M and 1 M, stequiometric ratio of Li/Ti of 2, and the
concentration of H2O2 was kept to 0.61 M. (b) and (c) TEM micrographs the two concentration of OH-. ... 66 Figure 4-23 Powder synthesized by hydrothermal treatment of titanium peroxide 0.125 M, 0.4 M NH3, and 0.89 M H2O2 and stequiometric ratio of Li/Ti was 1 at 130 °C for 12 h. (a) XRD pattern of the powder before and after the calcination at 550 °C for 4 h, (b) TEM micrograph. ... 69 Figure 4-24 Diagram of morphology of lithium titanium oxide, for the
concentration of OH- 0.4 M in the hydrothermal synthesis. nano plate agglomeration, mixture of plates and square particles, square particles agglomeration. ... 72
XI
Figure 5-1 Powder obtained at 150 °C by hydrothermal synthesis, then calcined at 550 oC for 4 h. (c) HRTEM micrograph and the SAED (the inset in the left) of a nanoflake. ... 76 Figure 5-2 Thermal analysis TG and DTA of the powder obtained at 150 °C by hydrothermal synthesis follow by calcination at 550 oC for 4 h. ... 77 Figure 5-3 Charge-discharge capacity at different current rates for the powders Plates, SP, NPA, SPA, Particles, and SST. represents the columbic efficiency.
... 81 Figure 5-4 Capacity-voltage profile for the powder “Plates” comparing at
different current rates... 82 Figure 5-5 Percentage of Retention of capacity related to the reversible capacity at 0.5 C-rate vs C-rate ... 84 Figure 5-6 Capacity-voltage profile comparison for the nano materials at 50 C- rate. ... 85 Figure 5-7 Cross-sections of a square particle and a plate particle showing the gradient of lithium during the diffusion ... 87 Figure 5-8 Cycle performance at 5 C-rate for the nano material. The test with SPA were taken until 900 cycles. ... 88
XII
List of Tables
Table 3-1 List of reagents and solvents. ... 21 Table 3-2 Electrode composition ... 31 Table 4-1 Variables investigated in the hydrothermal treatment and the
stoichiometric ratio Li/Ti used: Fist method ... 33 Table 4-2 Summary of the influence of the parameters in the hydrothermal
synthesis ... 71 Table 5-1 BET surface area before and after the calcination for the nano materials.
... 79 Table 5-2 Summary of the powders synthesized and description of the
morphology ... 80 Table 5-3 Values of the discharge capacity and percentage retention for the nano materials. ... 84
1
Chapter 1 Introduction and Background
Energy is increasingly becoming a great issue in this new century as the fossil fuel is depleting faster as a consequence of increasing consumption of energy, not only in the developed countries but also in the emerging countries. In the last decade, many people have ascended up to the middle class in the developing countries pushing further the consumption of energy. Approximately, 68% of 2011’s energy is produced from fossil fuel: coal, natural gas, and oil, another 29% is produced from hydro and nuclear power, and only the remaining 3% accounts for renewable technologies [1]. The price of petroleum peaked its record in 2008 over 140 US dollars per barrel and is expected to continuing rising currently at the current rate of consumptions. Another connected problem is the deterioration of environment causes by vast fossil-fuel consumption. Hence, the energy storage as more efficient step of using energy have become extensively studied [2]. To smooth out the intermittency of renewable energy production, low-cost electrical energy storage will become necessary being considered as a key enabler of the smart grid, which is expected to integrate a significant amount of renewable energy resources while providing fuel to hybrid and electrical vehicles (HEV and EV, respectively), even though the cost is of great concern [1].
To date, some companies are promoting the use of EVs, as the policies in the developed world inclines to green energies, currently Toyota has in the market hybrid electro vehicles, namely Prius, and also other major auto companies have electric cars in development.
2
All the latter facts are increasingly causing the use of rechargeable batteries like Lithium Ion Batteries (LIB). The development of the large-scale of LIB is remarkable due to the high ratio of energy-weight of these batteries. In this context, a high performance of the anode and cathode in LIB is desirable.
Spinel Li4Ti5O12 (LTO) has been considered as a promising alternative to the carbon because of (i) during the Li-insertion process, it shows a potential plateau at 1.5 V (vs. Li+/Li). This higher potential (vs. Li+/Li) is desirable because at this voltage the reduction of the organic solvents and electrolytes is inhibited;
moreover, the formation of dendritic is also avoided [3]; (ii) the zero-strain insertion property, during the lithiation/delithiation [4]. This special characteristic makes it a robust material during cycling performance. However, the LTO has insulating characteristic with band gab ~ 2 eV [5]. preventing its high current performance. To overcome the latter drawback, doping with a conductive material, modifying the surface with a conductive material like TiN [6], or making nanomaterials to increase the surface area are carried out recently.
The concept called soft solution processing has been introduced [7], as process that is inspired basically by natural processes, being able to operate above ambient conditions. The hydrothermal synthesis falls into this category, being the greatest advantages the possibility to synthesize advance materials controlling the size and morphology of the product. In previous studies, LTO was synthesized via hydrothermal process. In this thesis, the hydrothermal approach has been used to prepare the nano size LTO in different morphologies. The development of the process was taking account the employment of wide
3
available source of titanium like titanium dioxide (TiO2), in its different phases, as initial precursor. It was possible to obtain various morphologies: nano flakes or quasi-square nano particles, those forming aggregated secondary particles or dispersed alone, by controlling the parameters in the hydrothermal synthesis such as ratio Li/Ti, temperature, concentration of H2O2, and pH. The characteristics and the electrochemical performance of the synthesized products were being studied, showing a greater rate performance.
4
Chapter 2 Literature Review
2-1 Introduction to Li-ion Batteries
The electrochemical systems for the storage of energy can be classified in three main types: electrochemical capacitors, batteries, and fuel cells. Batteries can be divided in primary and secondary batteries, and these have been extensively used in daily life. Primary batteries can be used only once and then have to be disposal. On the other hand, the secondary batteries can be recharged after discharge. In an ideal battery, the discharge has to occur at constant voltage, so that a constant power is delivered during the time; this requirement implies that active materials having two phases during the discharge are preferred. High specific energy is achieved by using electrodes which can deliver a high amount of specific charge at a high voltage. High specific power is granted by fast electrochemical reaction, high specific conductivity of the electrolyte, high electronic conductivity of the electrodes and current collectors. In the Figure 2-1 is clear that the storage systems base in lithium has many advantages compare to the other systems. Batteries based on the lithium technology can be divided in two classes: lithium batteries and lithium- ion batteries. The former has many issues due to safety disadvantage, and the latter one is becoming increasingly more popular.
Since researchers at Sony Energytech developed the first commercial Li- ion batteries in the late 1980s, a variety of efforts have been undertaken to
5
improve the battery materials. Because the Li ions in the LIB is extract/intercalate from or into the two opposite electrodes during charge and discharge, this kind of batteries are also called rocking-chair batteries.
Figure 2-1 Ragone chart of the main secondary battery systems [8].
In the Figure 2-2 is illustrated the principle of the charge/discharge of the LIB. For example for LiCoO2/C (Cell), during the charging the Li ion will be extracted out from the layered structure of LiCoO2, then the Li ion will migrate through the electrolyte between the two electrodes to finally intercalate into the carbon graphite (anode), and then diffuse into it. During the discharge the reverse process take place. The following chemical equations represent the process:
6 Cathode reaction:
Li CoO xLi xeLiCoO x
e ch
e Disch
2 1
arg
arg 2
(2-1) Anode reaction:
6 arg
arg
6C xLi xe LixC
e Ch
e Disch
(2-2)
Global reaction:
6 2
1 arg
arg 6
2 C Li CoO Li C
LiCoO x x
e Ch
e Disch
(2-3)
Figure 2-2 Schematic description of the LIB based on the electrochemical intercalation process (discharge). The anode is composed by graphite while cathode is a layered oxide [8].
7
2-2 Li
4Ti
5O
12as Anode Material for Li-ion Batteries
The negative electrode in LIB substitutes metallic lithium. This is necessary because metallic lithium has not a stable surface during charge discharge and the risk of a shot-circuit can arise. To obtain high specific energy, the active material has to store high amount of charge and to have a more cathodic equilibrium potential for the Li exchange. Some limits on the latter properties are set by the stability window of the electrolyte and the deposition potential of metallic lithium (electroplating) on the electrode, which could result in the formation of dendrites. Mainly two kinds of material for the anode of the LIB can be distinguish, this is, intercalation compounds and lithium alloys.
Graphite is the most popular among the anodes for the LIB having a layered compound. The theoretical maximum specific charge is equal to 372 mAh g-1, the flat potentials of the graphite phases are between 0.22 and 0.1 V (Li/ Li+), at this potential range of Li+ intercalation in graphite, most of the electrolytes are thermodynamically unstable, forming a stable passivation film at the surface of graphite particle is necessary, this is, the so-called Solid Electrolyte Interphase (SEI).
Spinel LTO has a theoretical capacity of 175 mAh/g, this material is not toxic. LTO has been considered as a promising alternative to the carbon because of the following reasons: (i) during the Li-insertion process it shows a potential plateau at 1.5 V (vs. Li+/Li) which is ascribed to the two-phase reaction [9]. This higher potential (vs. Li+/Li) is desirable because at this voltage the reduction of the organic solvents and electrolytes is inhibited hence the formation of SEI is
8
avoided; moreover, the formation of dendritic is also avoided [3]. The latter causes a serious distress about safety using carbon as an anode; (ii) the zero- strain insertion property, during the lithiation/delithiation [4], for both end members, Li4Ti5O12 (LTO) and Li7Ti5O12 (LTO-rock-salt), are described by the same space group Fd-3m which have similar lattice parameters, as shown in Figure 2-4(a,b). Although substantial chemical changes occur during conversion between the two phases. This special characteristic makes it a robust material during cycling performance which is highly desirable for EVs which use heavy- duty batteries; (iii) The LTO framework provides a three-dimensional network of channels for facile lithium diffusion [9-11], this property provide this material with fast charge/discharge rates which is desirable. Nonetheless, as a drawback the material inherently has an insulating characteristic with band gab ~ 2 eV [5], which prevents seriously its high current performance. To overcome this issue, researches conduct doping it with a conductive material, modifying the surface with a conductive material like TiN [6], or making nanomaterials to increase the surface area.
Figure 2-3 Voltage of LTO anode and various cathode materials [12].
9
Figure 2-3 shows an operating voltage of LTO anode with various cathode materials. Various possible candidates stand out to replace the C/LiCoO2 battery.
For example the system LTO/LiFePO4 is very promising because of low cost of the cathode and possible heavy-duty use. The LTO/LiNi0.5Mn1.5O4 cell, among others, is one of the promising and attractive batteries for next generation LIB because of its high voltage (4.7 V), acceptable stability, and good cycling performance [13].
Figure 2-4 (a) Li4Ti5O12 spinel structure type. Blue tetrahedra represent lithium, and the green octahedral represent disorder lithium and titanium. (b) Li7Ti5O12, rock salt. Blue octahedral represent lithium, and green octahedral represents disorder lithium and titanium [14].
The LTO and LTO-rock-salt, both lithium titanium oxides crystallize in the space group Fd-3m (Figure 2-4). In the structure of the spinel LTO (Figure 2- 4a), the octahedral (16d) sites are randomly occupied by lithium and titanium
10
whereas the tetrahedral (8a) positions are occupied by lithium. LTO rock-salt structure is formed (Figure 2-4b), here, the octahedral (16c) positions are occupied by lithium; the occupancy of the octahedral (16d) positions is the same as in LTO, whereas in contrast to LTO, the tetrahedral (8a) positions are not occupied [15].
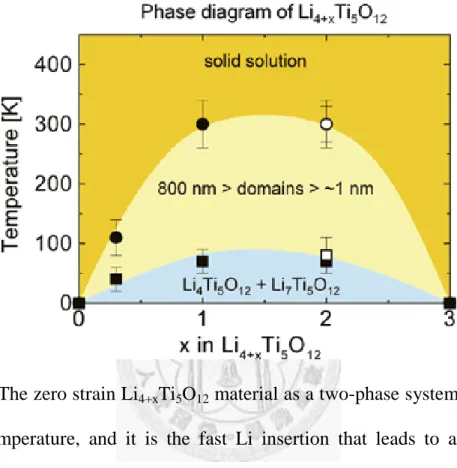
The zero strain property is of key technological importance since lattice strains upon cycling are among the main causes of capacity decays in lithium battery electrodes. It is known that the lithiation-delithiation proceeds through a two-phase equilibrium, which leads to a very constant potential over a large range of overall Li concentrations. On the other hand, recently it has been proposed that in Li4+xTi5O12 this two-phase separation is unstable above 80 K and most likely kinetically induced by the Li-insertion during charge/discharge [15].
As a consequence, in equilibrium the material forms a solid solution at room temperature with associated small changes in the open circuit potential [15-17].
A solid solution implies intimate mixing of 8a and 16c site occupation in contrast to the phase separated system where domains of 8a and 16c occupation are separated on a micrometer length scale [16]. The disorder resulting from the mixed 8a/16c occupation is most likely beneficial for the Li mobility as compared to the ordered coexistence of 8a and 16c domains. Based on observations Wagemaker illustrates this behavior in a phase diagram, shown in Figure 2.5 [15].
Referring the electronically insulating behavior of the LTO, to address this problem it has been proposed: doping with ion metals, modifying the surface of
11
the LTO particle with one electronic conductive material, or synthesizing nano material to increase the surface area. The approach of synthesis plays an important role in the electrochemical behavior of the LTO, including new ways of synthesis.
Figure 2-5 The zero strain Li4+xTi5O12 material as a two-phase system is unstable at room temperature, and it is the fast Li insertion that leads to a kinetically induced effective two-phase reaction. The solid-solution-induced disorder, resulting from the mixed 8a/16c occupation, is most likely responsible for the high rate capabilities in Li4+xTi5O12.[15]
Among the most straightforward synthesis processes of LTO is the solid state reaction. Nevertheless, the product suffers from great disadvantages like the broad size distribution and large particles size. [4, 18] A variant of this approach is the surface modification with one conductive material like carbon [19, 20]
(shown in Figure 2-6) or nitrite [6] which improve the electrochemical behavior.
12
Even though, a high energy milling is follow the solid state reaction not much improvement is obtained on the electrochemical performance as other researches show [18]. The spray-drying approach is another straightforward process; for instance, Hsiao et al [21] synthesized D- Li4Ti5O12 and P-Li4Ti5O12 by solid-state calcination (D and P stand for dense and porous particles) improving the rate capability for the letter.
Figure 2-6 (d-1) High-resolution TEM images of 20 wt% pitch coated LTO showing penetration of carbon into the particle boundary and (d-2) high- resolution TEM images of 20 wt% pitch coated LTO showing the carbon coating layer [20].
More elaborated processes which achieve products with great electrochemical properties for the anode material were developed; however, those processes are too complicated adding that the precursors are costly. The sol-gel [22, 23], hydrothermal [24], microwave, modified rheological phase (the last two mentioned in the paper review by Yi et al. [12] ), solution combustion
13
[25], spray pyrolysis [26] methods or a combination of these methods with a thermal treatment were being developed. The results of these more fancy approaches are astonishing in some cases, for instance, Prakash et al. [25]
prepared LTO using titanyl nitrate [TiO(NO3)2] and LiNO3 as the oxidant precursors and glycine as the fuel in the solid combustion approach. In the Figure 2-7(a) is shown the TEM micrograph, and in Figure 2.7(b) the electrochemical performance; this synthesized LTO is able to cycle at 100 C-rate, even though the loading of the active material over the current collector is ~4 mg/m2.
14
Figure 2-7 LTO by the solution combustion approach. (a) TEM micrograph of the synthesized LTO. (b) The electrochemical performance [25].
2-3 Hydrothermal Synthesis of LTO
M. Yoshimura et al. [7] has introduced the concept called Soft Solution Processing, as a process that is inspired basically by natural processes, being able to operate near above ambient conditions. The hydrothermal synthesis fall into
(b)
15
the category, being its greatest advantages the possibility to synthesize advance materials controlling the size and morphology of the product.
Fattakhova et al. [24, 27] in previous studies synthesized LTO via hydrothermal and solvothermal process, in these study, however, TiO2 is used as a precursor, employing strong basic solution with high concentration of lithium hidroxile; moreover, the final precipitate is too small as a consequence the product losses great capacity due to the extremely large surface area as is explained by Borghols et al. [17] and kavan et at. [28]. However, the two latter authors concluded separately through their studies that a large surface area leads a larger capacity than the theoretical one for the first cycles but this declined greatly for the further cycles.
In other approaches, in an attempt to soften the condition of the hydrothermal treatment and improve the morphology of the product, amorphous titanium oxide was prepared previously and then performed the hydrothermal synthesis; for example, Tang et al. [29] prepared LTO hollow microspheres from amorphous hydrous titanium oxide (AHTO) followed by calcination. The XRD pattern of the powder before and after the calcination is presented in the Figure 2- 8(a), and the high resolution TEM micrograph is presented in Figure 2-8(b). The electrochemical results indicate the right surface area and mesoporous structure of LTO hollow sphere provide the possibility of faster transport of electrons and lithium ions in high-rate LIB, maintaining 131 mAh/g at 50 C-rate.
16
Figure 2-8 LTO synthesized from AHTO by hydrothermal process (a) XRD pattern before and after the calcination of the powder (b) High Resolution TEM micrograph [29].
To prepare the nano size LTO, Chen et al. [30] carried out the hydrothermal process of the mixture of titanium tetra isopropoxide (TTIP) with H2O2 in LiOH solution; this approach leads to microspheres of nano flakes, as shown in Figure 2-9(a-b). During the cycling performance at various C-rates given in this research can be seen that at 57 C-rate the as-prepared LTO can deliver 132 mAh/g for 200 cycles; however, the weight of active material over the current collector is not reported in this study; the later point is important because LTO exhibit excellent activity toward Li insertion, even at charging rate as high as 250 C-rate if a thin film is prepared around 2-4 µm [31].
17
Figure 2-9 TEM micrographs of as-prepared LTO [30].
Particularly, this thesis focuses in the hydrothermal synthesis using titanium dioxide (TiO2) in their different phases (anatase, rutile, or a mixture of them) as initial precursor (in one set of experiments is employed AHTO);
moreover, the process leads to different morphologies: nano flakes or quasi- square nano particles, those forming aggregated secondary particles or dispersed alone, by controlling the parameters in the hydrothermal synthesis such as ratio Li/Ti, temperature, concentration of H2O2, and pH. The electrochemical performance of the synthesized products was measured showing a greater rate performance than many materials reported before.
2-4 Aqueous Soluble Peroxo Titanate
An aqueous solution of titanium peroxide is achieved from several methods. The most common way is mixing hydrogen peroxide and any soluble titanium, organo titanium (titanium alcoholxides), TiCl4, titanyl sulphate
18
TiOSO4·2H2O, Ti(SO4)2, H2TiO3, or dissolving powder of metallic titanium with H2O2 and NH3. The color of this solution is deep orange at strong acid solution, orange below pH 1, yellow around 3, becomes pale yellow when the pH is raised further, and the color disappears in a strong basic solution. Schwarzenbach et al.
[32] explained that the formation of titanium peroxo complex can followed the next global reaction, in acid media:
Ti4+(aq) + H2O2 ====> Ti(O2)(OH)n-2(4-n) + nH+ (2-4) In very acid media an orange-red color of the mono nuclear peroxo titanic acid, TiO2(OH)+ is observed [32], this nono nuclear complex is detected during the colorimetric measurement having a maximum absorbance at around 410 nm wavelength [33]. At higher pH the presence of the mono nuclear peroxo titanic acid is uncertain, rather an equilibrium of dinuclear titanium compounds is formed as Schwarzenbach et al. explained [32].
On the other hand, soluble titanium can be achieved by the dissolution of metallic powder of titanium in excess of NH3 and H2O2 at pH around 11 [34], the suggested global reaction is:
Ti0 + 3H2O2 + NH3 ===>TiO2(OH)3- + 2H2O + NH4+ (2-5)
Water-soluble complexes of titanium have been proved to be very promising reagents for synthesizing titanium compounds. Specifically, the peroxo titanate and their complexes are used by many researchers to obtain TiO2 in various morphologies and phases. The hydrothermal process was employed to obtain nanorod of TiO2 (brookite) in a basic solution [35], in another research the
19
hydrothermal synthesis of titanium peroxide in the present of H2SO4 leads to TiO2 (brookite) [36], also Murakami et al. [37] used the hydrothermal process and controlled the shape of the particle with polyvinyl alcohol obtaining anatase.
20
Chapter 3 Experimental Part
3-1 Chemicals
The chemicals employed in the experiments are listed in Table 3-1. The listed reagents were all laboratory-grade and were used without further purification. For the solvents, the ethyl alcohol was used as arrived, and the water was purified through reverse-osmosis (Purelab Maxima/ELGA) being its resistivity higher than 18 MΩ-cm. As a source of TiO2, anatase with a particle size around 10 nm (ST-01, Ishihara-Sangyo Co., Ltd.), rutile with a particle size between 100 to 300 nm (PT-501, Ishihara-Sangyo Co., Ltd.), and P25 (Degussa), that is, a mixture of anatase and rutile, with a particle size around 30 nm were employed as arrived; the particles size was estimated from the SEM micrographs for rutile and P25, but for anatase was estimated from the XRD pattern (approximated to the crystal size). Figure 3-1 shows the SEM micrographs for the different TiO2 precursors. Amorphous hydrous titanium oxide (AHTO) was used (mesoporous titania nanoparticles MTN [38] was provided and synthesized from titanium ethoxide) having a spherical shape of around 300 nm secondary particle, according the SEM micrographs.
21 Table 3-1 List of reagents and solvents.
Chemical Reagent Formula Assay Supplier
Sodium hydroxide NaOH 97 % nacalai tesque Inc.
Japan
Potassium hydroxide KOH 95 % nacalai tesque Inc.
Japan Lithium hydroxide mono
hydrated LiOH H2O 99.9
%
Hayashi Pure Chemical Industries Ltd. Japan
Aqueous ammonia NH3 28 % nacalai tesque Inc.
Japan
Ethanol C2H5OH 95 % Taiwan tobacco and
liquid corporation
Hydrogen peroxide H2O2 30% Wako
N-methyl 2 Pyrrolidone (NMP) C5H9NO 100% Taiwan Maxwave Lithium Hexafluoro -phosphate
in ethyl carbonate/ ethyl methyl carbonate 1:2 in vol.
LiPF6 in C3H4O3/C4H8O3
1:2 in vol.
99.9% Zhangjiagang Guotai Ronghua (from China)
Poly-vinylidene-fluoride
(PVDF) (-C2F2Cl2-)n 99% ALDRICH
22
Figure 3-1 SEM micrographs of the TiO2 (a) P25 (b) Rutile PT-501, and (c) Anatase ST-01
3-2 Synthesis of LTO by Hydrothermal Treatment
Three methods have been adopted to synthesize LTO powder in batches as white powder, all of them follow by hydrothermal process, however, the principle mechanism of LTO formation is different among them because of the different ions employed in the treated solution, and hence the morphology is also different. In this thesis the stoichiometric ratio Li/Ti is defined according to the compound Li4Ti5O12 will be used rather than the molar ratio, for example, a molar ratio Li/Ti equal 4/5 will be presented as stoichiometric ratio Li/Ti = 1.
23
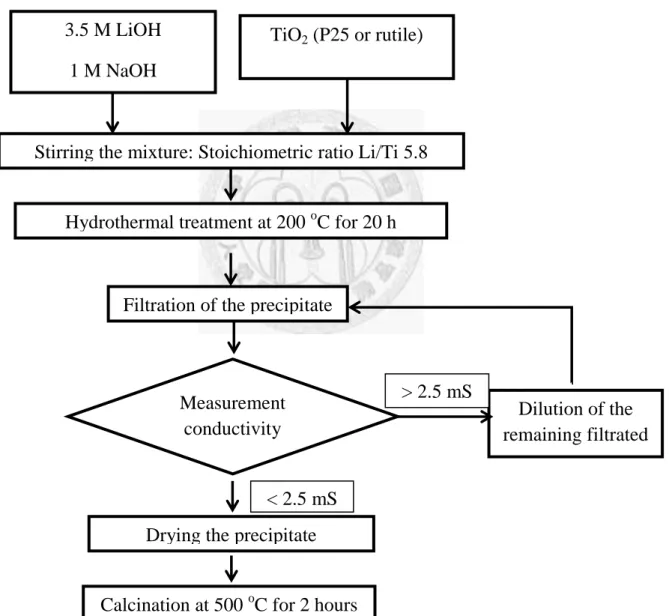
In the First Method, illustrated in Figure 3-2, NaOH and LiOH are mixed together in 30 mL of water or ethyl alcohol; the concentration of the solution is 1.0 M and 3.5 M, respectively, and then 1.8 grams TiO2 of is added (P25 or rutile;
the stoichiometric ratio of Li/Ti is 5.8). All the mixture is placed in Teflon-lined stainless steel autoclave and heats at 200 oC for 20 hours. The precipitate powder was washed several times until the conductivity starts to drop below 2.5 mS, dried at around 50 oC, and finally calcined at 500 oC for 2 h.
Figure 3-2 Schematic diagram of the hydrothermal synthesis: First Method 3.5 M LiOH
1 M NaOH
TiO2 (P25 or rutile)
Stirring the mixture: Stoichiometric ratio Li/Ti 5.8
Measurement conductivity
Filtration of the precipitate
Dilution of the remaining filtrated
< 2.5 mS
> 2.5 mS
Drying the precipitate
Calcination at 500 oC for 2 hours Hydrothermal treatment at 200 oC for 20 h
24
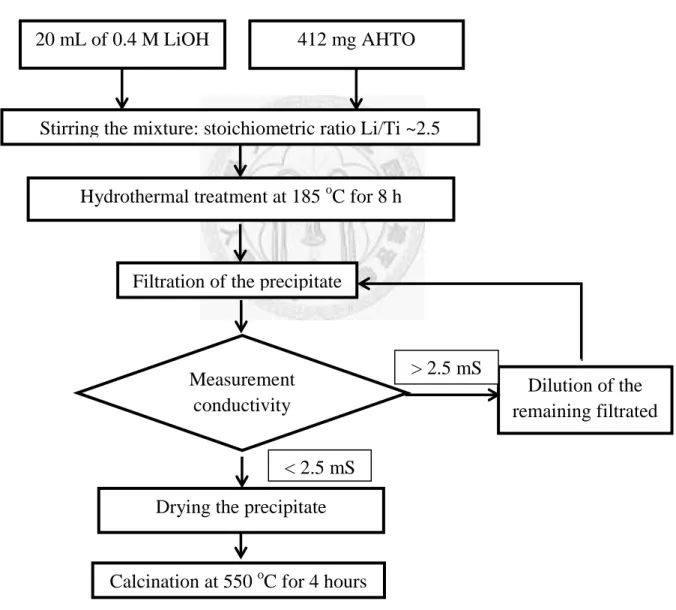
In the Second Method, illustrated in Figure 3-3, to 20 mL of 0.4 M LiOH solution was added 420 mg AHTO, with this amount of AHTO the stoichiometric ratio Li/Ti is roughly 2.5 (The AHTO was obtained from the hydrolysis of TTIP). Then the mixture is sealed in a Teflon-lined stainless steel autoclave and heats at 185 oC for 8 hours, the white precipitated powder is filtered, washed several times till the conductivity starts to drop below 2.5 mS, dried at around 50 oC, and then calcined at 550 oC for 4 h.
Figure 3-3 Schematic diagram of the hydrothermal process: Second Method 20 mL of 0.4 M LiOH 412 mg AHTO
Stirring the mixture: stoichiometric ratio Li/Ti ~2.5
Measurement conductivity
Filtration of the precipitate
Dilution of the remaining filtrated
< 2.5 mS
> 2.5 mS
Drying the precipitate
Calcination at 550 oC for 4 hours Hydrothermal treatment at 185 oC for 8 h
25
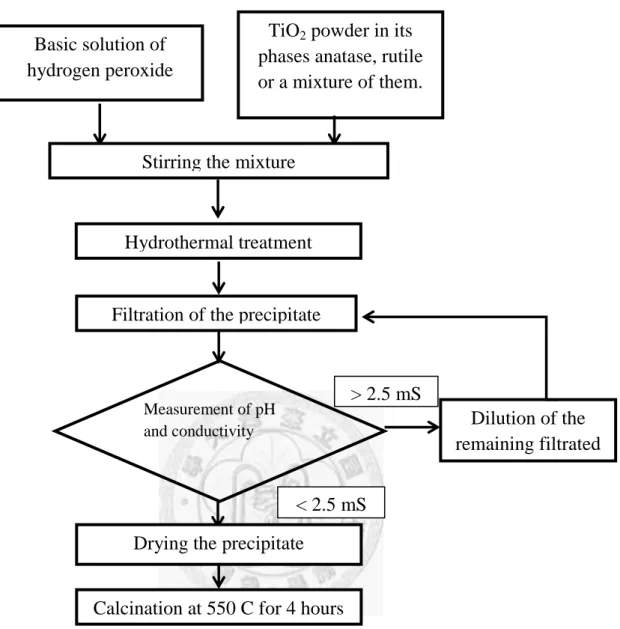
In the third method, shown Figure 3-4 in a general schematic diagram, a basic solution of lithium and H2O2 is prepared. The source of lithium was LiOH H2O, and to increase the pH it was employed NaOH and NH3. The range of concentration of lithium used was from 0.1 M to 0.8 M, and the concentration of H2O2 was from 0.32 M to 1.6 M. Then, titanium dioxide powder (anatase, rutile or a mixture of them) were added and stirred for one hour at room temperature.
The concentration of titanium employed was between 0.1 M - 0.6 M, and the stoichiometric molar ratio Li/Ti employed was in the range of 1 to 5. Upon the time of mixing, the solution remains in the basic pH, and for the nano particles of anatase a clear solution was obtained. The volume used was 30 mL unless it is stated the contrary. The prepared mixture was sealed in a Teflon-lined stainless steel autoclave and heated at 130 – 200 °C for 12 h. After the autoclave cooled down to the room temperature, the obtained precipitate was separated from the mother solution, diluted with deionized water, and then filtrated to recover the precipitate. To the filtrated water, the pH and the conductivity were measured.
This procedure was repeated several times, controlling the pH and the conductivity of the filtrated water until a suddenly decline of either the pH or conductivity was detected, and hence, in this fashion, the excess of lithium ions in solution was controlled. After drying the powder at 50 °C for at least 6 h, the powder was calcined at 550 °C under air atmosphere for 4 h with a heating rate of 250 °C per hour in a muffle furnace.
26
Figure 3-4 General schematic diagram of the hydrothermal process, the concentration and conditions vary for the various experiments: Third Method
3-3 Analysis and Characterization
3-3.1 Phase Identification
To determine the phase of the synthesized powder was performed the X- ray diffraction (XRD) analysis; technique commonly used which gives
Basic solution of hydrogen peroxide
TiO2 powder in its phases anatase, rutile or a mixture of them.
Stirring the mixture
Hydrothermal treatment
Measurement of pH and conductivity
Filtration of the precipitate
Dilution of the remaining filtrated
< 2.5 mS
> 2.5 mS
Drying the precipitate
Calcination at 550 C for 4 hours
27
information of the crystallinity, purity, size, and shape of unit cell. An incident X-ray beam is generated and applied to the sample which according to its crystal arrangement diffracts the X-ray obeying the Bragg’s law.
(3-1)
Where n is a positive integer called order of diffraction; λ is the wavelength of the beam; d is the distance between the corresponding crystal plane; and θ is the incident angle between the beam and the atomic layers in the crystal, also called Bragg’s angle.
10 20 30 40 50 60 70 80
10 20 30 40 50 60 70 80
10 20 30 40 50 60 70 80
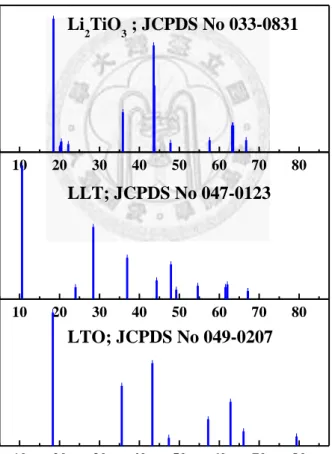
Li2TiO
3 ; JCPDS No 033-0831
2 Theta (degree) LTO; JCPDS No 049-0207 Intensity (I/I o)
LLT; JCPDS No 047-0123
Figure 3-5 XRD patterns for the involved material in this study
28
In this research, the X-ray powder diffraction (XRD) patterns were obtained on a multi-porpose X-ray diffractometer (Ultima IV, Rigaku Co.) using Cu k alpha radiation and operating at 40 kV, 40 mA, and from 6o to 80o with a constant scan rate of 17 o/minute. In Figure 3-5 is plotted the peaks for the LTO, Li2TiO3, and the layered lithium titanium which are the material involved in this study. These data was extracted from the JCPDS data base.
3-3.2 Morphology Observation
The morphology was examined by field-emission scanning electron microscope (SEM) and transmission electron microscopy (TEM). The scanning electron microscope uses a focused beam of high-energy electrons to generate a variety of signals at the surface of solid specimens. The signals that derive from electron-sample interactions reveal information about the sample including external morphology (texture), chemical composition, and crystalline structure and orientation of materials making up the sample. Data are collected over a selected area of the surface of the sample, and a 2-dimensional image is generated that displays spatial variations in these properties.
The TEM operates on the same basic principles as the light microscope but uses electrons instead of light. What it is seen with a light microscope is limited by the wavelength of light. TEMs use electrons as "light source" and their much lower wavelength makes it possible to get a resolution a thousand times better than with a light microscope. It is possible to focus objects to the order of a few angstrom (10-10 m).
29
The SEM used in this study was (FESEM; FESEM: FEI/Nova NanoSEM 230). Also, the powder sample was dispersed in ethyl alcohol 95% and a droplet of this suspension was transferred onto a Cu microgrid. After evaporation of the ethanol, the sample was used for characterization by transmission electron microscopy (TEM; Hitachi: H-7100; 75 kV) and high resolution transmission electron microscopy (HRTEM: FEI, TENAI G2: 200 kV).
3-3.3 Surface Area Analysis
In this study, the BET (Brunauer, Emmett, and Teller) surface area of materials was conducted with a surface area analyzer (ASAP-2010/Micrometrics).
The 5-points measurement was utilized in which the relative pressure was ranging from 0.06 to 0.20.
3-4 Electrochemical Test
3.4-2 Electrode Preparation and Assembling of the Coin Cell
The electrochemical performance was tested with coin cells CR 2032 type.
First was prepared the electrodes using mixtures comprising 75 wt% of active material (LTO), 15 wt% of carbon black (XC72), and 10 wt% of polyvinylidene fluoride (PVDF) binder, the recipe is presented in Table 3-3. These components were mixed by mortar and pestle, adding NMP as solvent then was continued by mixing until obtaining well-dispersed slurry. The slurry was pasted over etched aluminum foil as a current collector, and around 40 μm film was obtained. The
30
electrodes were roll-pressed getting around 20 μm thickness of the film, and finally the electrode was dried at 120 °C under vacuum overnight. The resulting loading layers bases on the active material were over 1.5 mg/cm2 in weight of the active material. Coin-type cells CR2032 were assembled with the LTO electrode, lithium metal as counter electrode, and electrolyte 1 M solution of LiPF6 in ethylene carbonate/ethyl methyl carbonate (EMC; Mitsubishi Chemical). The assembling was done in a dry room with atmosphere dew point between -40 and -45 °C. The Figure 3-6 illustrate the assembling of the coin-type cells CR2032.
Figure 3-6 Illustration of parts for the coin cells CR2032.
Upper cap Conic Spring
Stainless steel slice Li foil
Membrane separator Active material layer Current collector
Bottom cap
31 Table 3-2 Electrode composition
Material Composition % w/w
Active material 75
Carbon black (XC72) 15
Polyvinylidene fluoride (PVDF) binder 10
3.4-2 Charge and Discharge Strategies
The electrochemical performances were conducted by constant current charge/discharge (C/D) test, with selected current rates between 3 and 1 V on a battery tester (Arbin, model: MCN6410). The charge and discharge phases of a cycle were conducted at the same selected current rate.
32
Chapter 4 Results and Discussions
Plenty of methods to synthesize LTO have been reported; however, many of these processes lack of simplicity and are too costly for practical applications.
In this study the hydrothermal method is used to synthesize LTO. It is used three variants of the hydrothermal approach. These three methods are different in their mechanisms which lead to LTO, and as a result the morphologies and the electrochemical performance are different as well.
This chapter is divided in four parts. Part I copes with the hydrothermal synthesis with TiO2 (anatase and rutile) and LiOH in presence of NaOH; this approach is the most conventional approach. In Part II, AHTO is used in presence of LiOH, in this particular synthesis the conditions are softened hence the formation of LTO is easier. In Part III, a new hydrothermal synthesis, using as a precursor TiO2, is explained. The influence in the morphology of the different condition and concentration of the precursors is studied in this Part.
Finally, in Part IV a summary of the result is given.
4-1 Hydrothermal Synthesis: First Method
In general, low temperature LTO phases were prepared by hydrothermal reaction of TiO2 (P25 or rutile) and LiOH with the presence of NaOH in water or alcohol at temperature around 200°C for 20 h, as is illustrated in Figure 3-2. The
33
hydrothermal reaction produced white powder, which was carefully filtered and washed with distilled water to remove an excess of hydroxides and carbonates.
During the treatment with distilled water, the conductivity of the water was controlled and when this property started to drop suddenly to a lower value of 2.5 mS/cm, the process of washing was stopped. Then the powder was dried and finally calcined at 500 oC for 2 hours.
The influence of three variables was investigated: the concentration of LiOH, concentration of NaOH, and the use of solvent (water and alcohol). In Table 4-1 is specified the value of these parameters. It was used two levels for the LiOH, three levels for the NaOH, and two levels for the solvent hence the total number of experiments were 12. The processes are called as follow: for using water Hydrothermal process (HW), and for using alcohol Solvothermal process (SA).
Table 4-1 Variables investigated in the hydrothermal treatment and the stoichiometric ratio Li/Ti used: Fist method
Level 1 Level 2 Level 3
Solvent Water Alcohol 95% -
[LiOH] M 1.50 3.50 -
Stoichiometric ratio Li/Ti 2.5 5.8 -
[NaOH] M 0.00 0.55 1.00
34
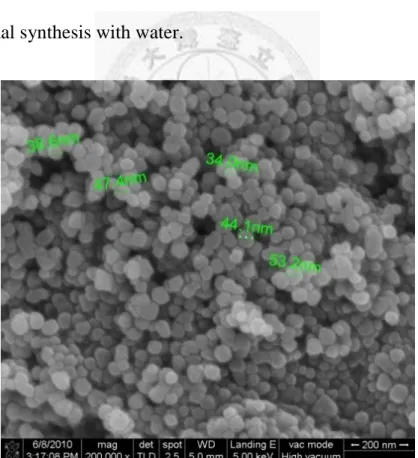
For hydrothermal treatment HW, six experiments were carried out and the outcome was the same for all of them, in the Figure 4-1 is presented the XRD pattern for the samples before and after the calcination, the presented pattern are common for all the powders. However, during the preliminary experiments was encountered that with concentration of LiOH less than 1.0 M the powder before the calcination presented some amount of anatase and rutile unreacted, even employing a stoichiometric ration Li/Ti of 4 the latter result persisted. The XRD pattern shown, in Figure 4-1 (before the calcination, lower pattern) presents a small hump at around 2θ = 18°, and strong reflections at 2θ = 43°, 2θ = 63°, and 2θ = 80°, this XRD pattern was encountered before and, actually, has an square structure of lithium titanium oxide; however, as it is explained by Fattakhova et al. [27], the apparent deviation of the experimental diffraction pattern from that expected for spinel structure, namely, diffuse scattering in the range corresponding to 2θ = 18.3° (111) reflection and missing 2θ = 35.5° (311) reflection can be attributed most probably to a disorder in Ti–O framework. In this thesis the latter compound will be called disorder spinel LTO. The synthesized powder was nano crystalline with coherent domain size estimated from SEM micrographs of about 50 nm, as shown the Figure 4-2. After the calcination at 500 oC for 2 hours, yield to a conventional LTO confirmed by XRD measurement, as seen in Figure 4-1.
35
10 20 30 40 50 60 70 80
Intensity
2 Theta (degree)
Before calcination After calcination
Figure 4-1 patterns of the powder before and after the calcination. First method of hydrothermal synthesis with water.
Figure 4-2 SEM micrograph of the powder. First method of hydrothermal synthesis with water.
36
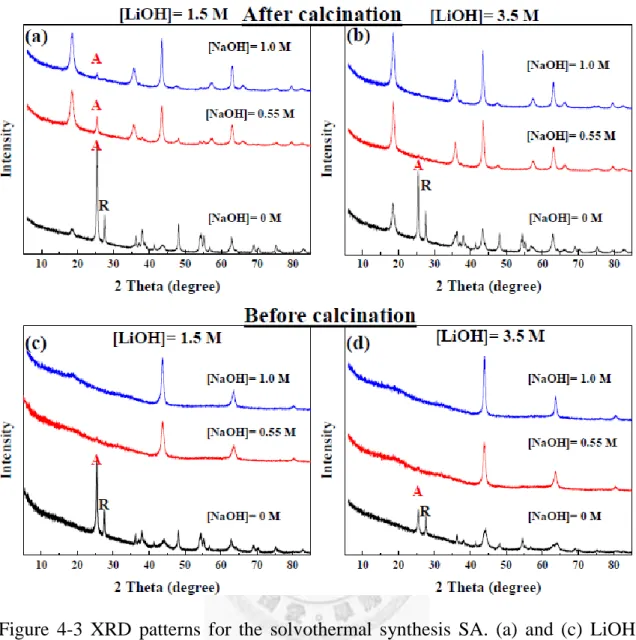
Figure 4-3 XRD patterns for the solvothermal synthesis SA. (a) and (c) LiOH concentration of 1.5 M, with calcination and without calcination respectively. (b) and (d) LiOH concentration of 3.5 M, with calcination and without calcination respectively. A and R indicates the main peaks for antase and rutile, respectively.
Figure 4-3 shows the XRD patterns for solvothermal synthesis SA, in total was carried out 6 experiments. Figure 4-3 (a) and (c) show the XRD patterns for sample synthesized at 1.5 M of LiOH at three levels of NaOH, with calcination and without calcination respectively, the conversion to LTO is almost totally
37
hindered if there is no used of NaOH, but as shown in Figure 4-3 (b) and (c), for 3.5 M of LiOH, the conversion improves with a higher concentration of LiOH.
Figure 4-3 shows that the presence of NaOH is essential in SA for the conversion being completed. As previously explained, in the preliminary experiments was encountered that at lower concentration of 1 M of LiOH the TiO2 is not converted totally, the latter occurs even at larger than 4 of the stoichiometric ratio Li/Ti. Similarly to HW, the SA leads to the disordered spinel LTO, as explained by Fattakhova et al. [27], and the latter can be converted to conventional LTO with thermal treatment (500 oC for 2 hours). According to the SEM micrographs, the morphology is composed of dispersed nano square particles of around 10 nm of size, as displayed in Figure 4-4; hence, SA leads to a smaller particle than HW.
Figure 4-4 SEM micrograph of the powder. Second Method of solvothermal synthesis.
38
The calcination of the powder was carried out at various temperatures between 400 oC to 800oC for 2 hours. For the two powders, i.e. HW’s and SA’s, the tendency is the same, at higher temperature the crystallinity improves, and the peaks in the XRD patterns get shaper; however, between 600 oC and 700 oC, there is a morphology transition where the nano particles melt and join together to form larger particles, as shown in Figure 4-5. As a consequence for the further experiments was chosen an intermediate temperature of 550 oC to keep the same morphology after hydrothermal and obtain good crystallinite.
Figure 4-5 SEM micrographs for the hydrothermal and solvothermal synthesis for two calcination temperatures, 600 oC and 700 oC for 2 hours. The melting and growing of the particles could be observed at 700 oC.
39
The hydrothermal treatment leads to the same products regardless whether rutile or anatase powders were used as starting source of TiO2. Hence the reaction has to proceed most likely via dissolution – precipitation mechanism.
4-2 Hydrothermal Synthesis: Second Method
In previous reports, the AHTO was synthesized first then the hydrothermal synthesis was performed, as example we can cite Kabac et al. [39], Qiu et al. [40], and Tang et al. [29]. We follow a similar approach , in Figure 3-3 shows the schematic diagram of the process.
Mono dispersed AHTO microspheres were prepared by controlled hydrolysis of titanium ethoxide, this precursor was used as received from Wu et al [38]. In a typical process of fabricating LTO, 412 mg of AHTO were dispersed in 20mL, 0.4M LiOH solution (stoichiometric ratio Li/Ti around 2.5). After stirred for 10 min, the suspension was transferred into a 40mL Teflon-lined stainless steel autoclave and heated at 185 oC for 8 h. The hydrothermal reaction produced white powder, which was carefully washed with distilled water to remove an excess of hydroxides. Then the powder was separated from the washing solution by filtration, dried in an oven, and finally calcined at 550 oC for 24h. For AHTO presents an amorphous phase according to the XRD pattern and after the hydrothermal treatment the disordered spinel LTO is synthesized, further calcination leads to conventional LTO, as shown the XRD patterns of the powders presented in Figure 4-6. It is believed that the uptaking of Li follows the mechanism analogous to the Kirkendall effect as is explained by Wang et al. [41].
The morphology of the AHTO and LTO synthesized by this method are shown in
40
the micrographs of Figure 4-7(a, b). According to the XRD pattern, following the Scherrer formula, delivered approximately 20 nm for particle size.
Figure 4-6 XRD pattern of the powder synthesized by hydrothermal synthesis of AHTO.
Figure 4-7 SEM micrographs (a) AHTO; (b) powder synthesized by hydrothermal treatment after calcination.
41
4-3 Hydrothermal Synthesis: Third Method
Nano size LTO was prepared by Chen et al. [30] carrying out the hydrothermal process of the mixture of titanium tetra iso propoxide (TTIP) and H2O2 in LiOH solution leading to micro spheres secondary particles of nano flakes. Differently, this study uses titanium dioxide (TiO2) in their different phases (anatase, rutile, or mixture of them) as initial precursor. The process described below leads to different morphologies: nano flakes or quasi-square nano particles, those forming aggregated secondary particles or dispersed alone, by controlling the parameters in the hydrothermal synthesis such as ratio Li/Ti, temperature, concentration of H2O2, and pH.
Figure 3-4 presents the process diagram flow of the hydrothermal process to produce LTO using titanium peroxide. TiO2 is stirred in basic hydrogen peroxide solution, and then this mixture is placed into a Teflon-line for the hydrothermal synthesis. After the reaction, the precipitate is filtrated and treated with deionized water, this step of procedure is repeated until the pH and conductivity begins to drop. At this point, the precipitate is dried and finally calcined in a furnace.
During the preliminary experiments, after the hydrothermal reaction, it was noticed that the treatment with deionized water is an essential part to obtain pure LTO, to elucidate this phenomenon the next experiment was designed measuring the pH and the conductivity during every treatment with deionized water. The hydrothermal treatment of solution 0.2 M titanium peroxide, 0.4 M LiOH, and 0.89 M H2O2, was carried out at 150 °C for 12 hours (the
![Figure 2-1 Ragone chart of the main secondary battery systems [8].](https://thumb-ap.123doks.com/thumbv2/9libinfo/9607155.632950/20.893.139.785.320.769/figure-ragone-chart-main-secondary-battery-systems.webp)

![Figure 2-9 TEM micrographs of as-prepared LTO [30].](https://thumb-ap.123doks.com/thumbv2/9libinfo/9607155.632950/32.893.134.772.130.407/figure-tem-micrographs-prepared-lto.webp)